Building a Distributed Log from Scratch, Part 2: Data Replication

In part one of this series we introduced the idea of a message log, touched on why it’s useful, and discussed the storage mechanics behind it. In part two, we discuss data replication.

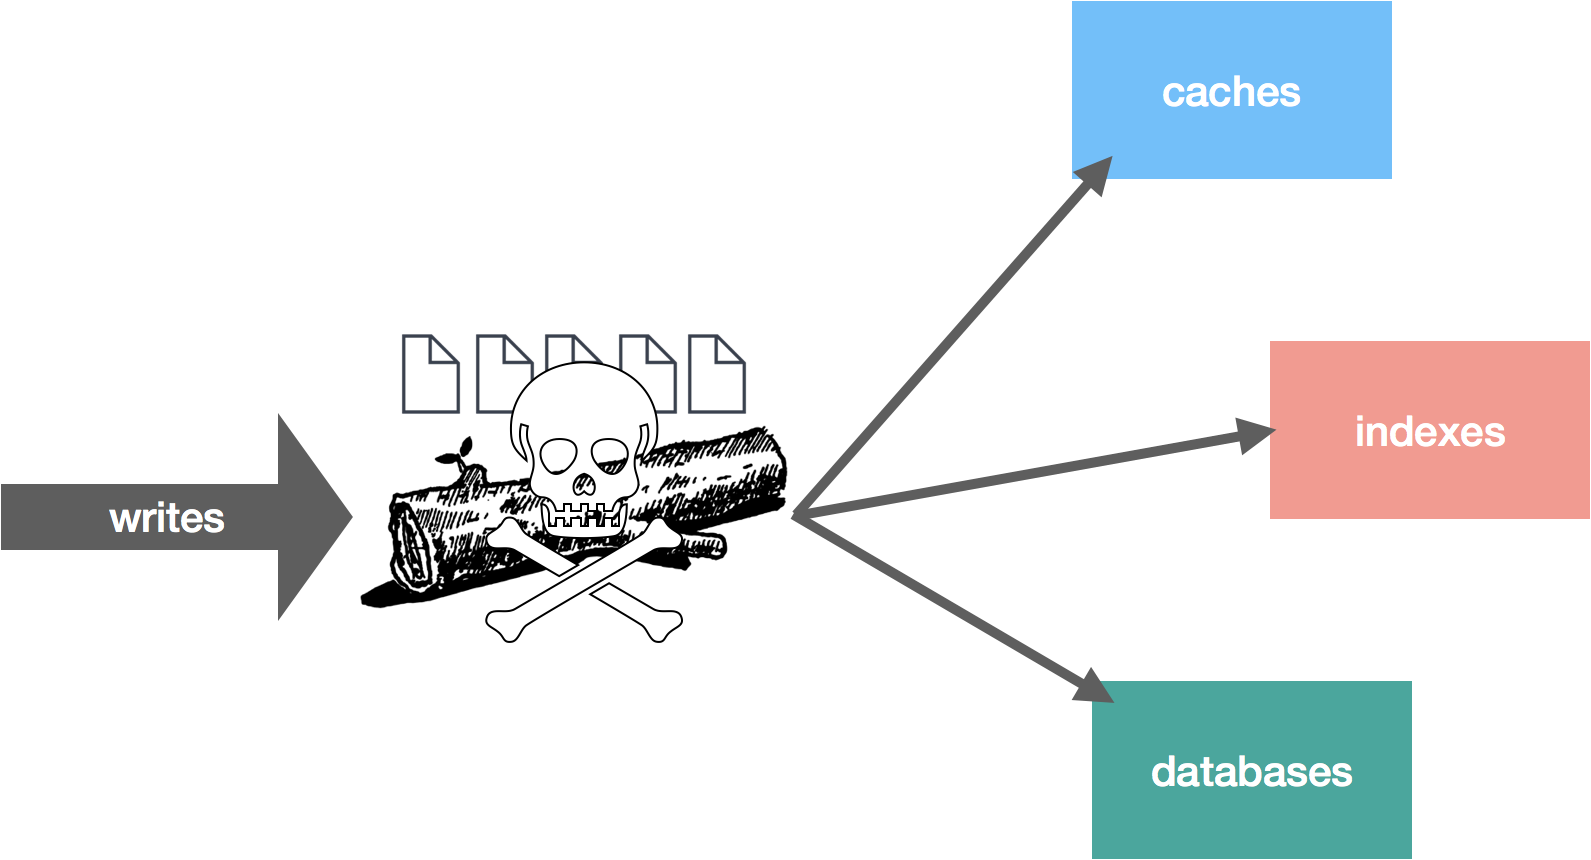
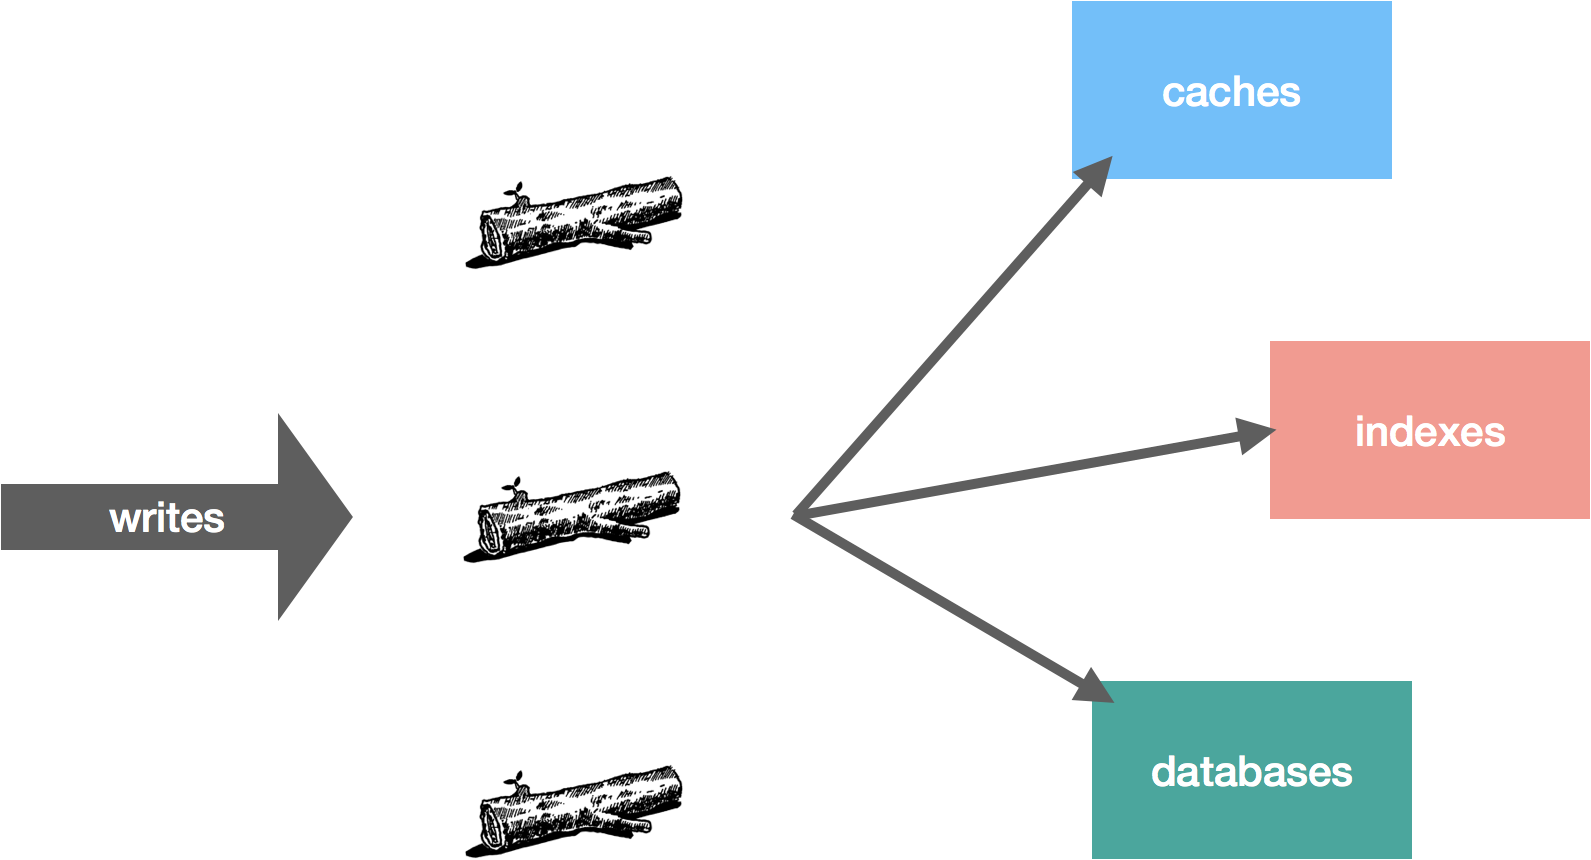
We have our log. We know how to write data to it and read it back as well as how data is persisted. The caveat to this is, although we have a durable log, it’s a single point of failure (SPOF). If the machine where the log data is stored dies, we’re SOL. Recall that one of our three priorities with this system is high availability, so the question is how do we achieve high availability and fault tolerance?

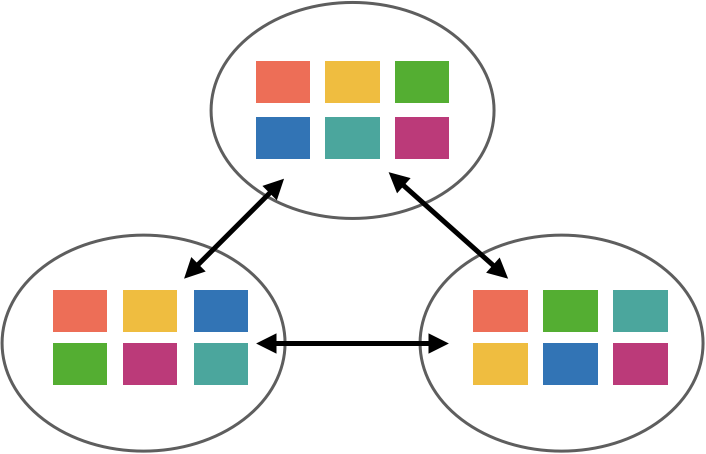
With high availability, we’re specifically talking about ensuring continuity of reads and writes. A server failing shouldn’t preclude either of these, or at least unavailability should be kept to an absolute minimum and without the need for operator intervention. Ensuring this continuity should be fairly obvious: we eliminate the SPOF. To do that, we replicate the data. Replication can also be a means for increasing scalability, but for now we’re only looking at this through the lens of high availability.

There are a number of ways we can go about replicating the log data. Broadly speaking, we can group the techniques into two different categories: gossip/multicast protocols and consensus protocols. The former includes things like epidemic broadcast trees, bimodal multicast, SWIM, HyParView, and NeEM. These tend to be eventually consistent and/or stochastic. The latter, which I’ve described in more detail here, includes 2PC/3PC, Paxos, Raft, Zab, and chain replication. These tend to favor strong consistency over availability.

So there are a lot of ways we can replicate data, but some of these solutions are better suited than others to this particular problem. Since ordering is an important property of a log, consistency becomes important for a replicated log. If we read from one replica and then read from another, it’s important those views of the log don’t conflict with each other. This more or less rules out the stochastic and eventually consistent options, leaving us with consensus-based replication.

There are essentially two components to consensus-based replication schemes: 1) designate a leader who is responsible for sequencing writes and 2) replicate the writes to the rest of the cluster.

Designating a leader can be as simple as a configuration setting, but the purpose of replication is fault tolerance. If our configured leader crashes, we’re no longer able to accept writes. This means we need the leader to be dynamic. It turns out leader election is a well-understood problem, so we’ll get to this in a bit.

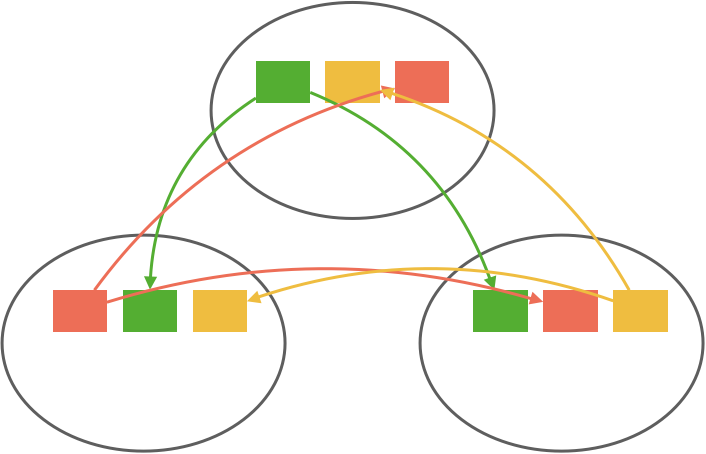
Once a leader is established, it needs to replicate the data to followers. In general, this can be done by either waiting for all replicas or waiting for only a quorum (majority) of replicas. There are pros and cons to both approaches.

Pros Cons
All Replicas Tolerates f failures with f+1 replicas Latency pegged to slowest replica
Quorum Hides delay from a slow replica Tolerates f failures with 2f+1 replicas

Waiting on all replicas means we can make progress as long as at least one replica is available. With quorum, tolerating the same amount of failures requires more replicas because we need a majority to make progress. The trade-off is that the quorum hides any delays from a slow replica. Kafka is an example of a system which uses all replicas (with some conditions on this which we will see later), and NATS Streaming is one that uses a quorum. Let’s take a look at both in more detail.

Replication in Kafka

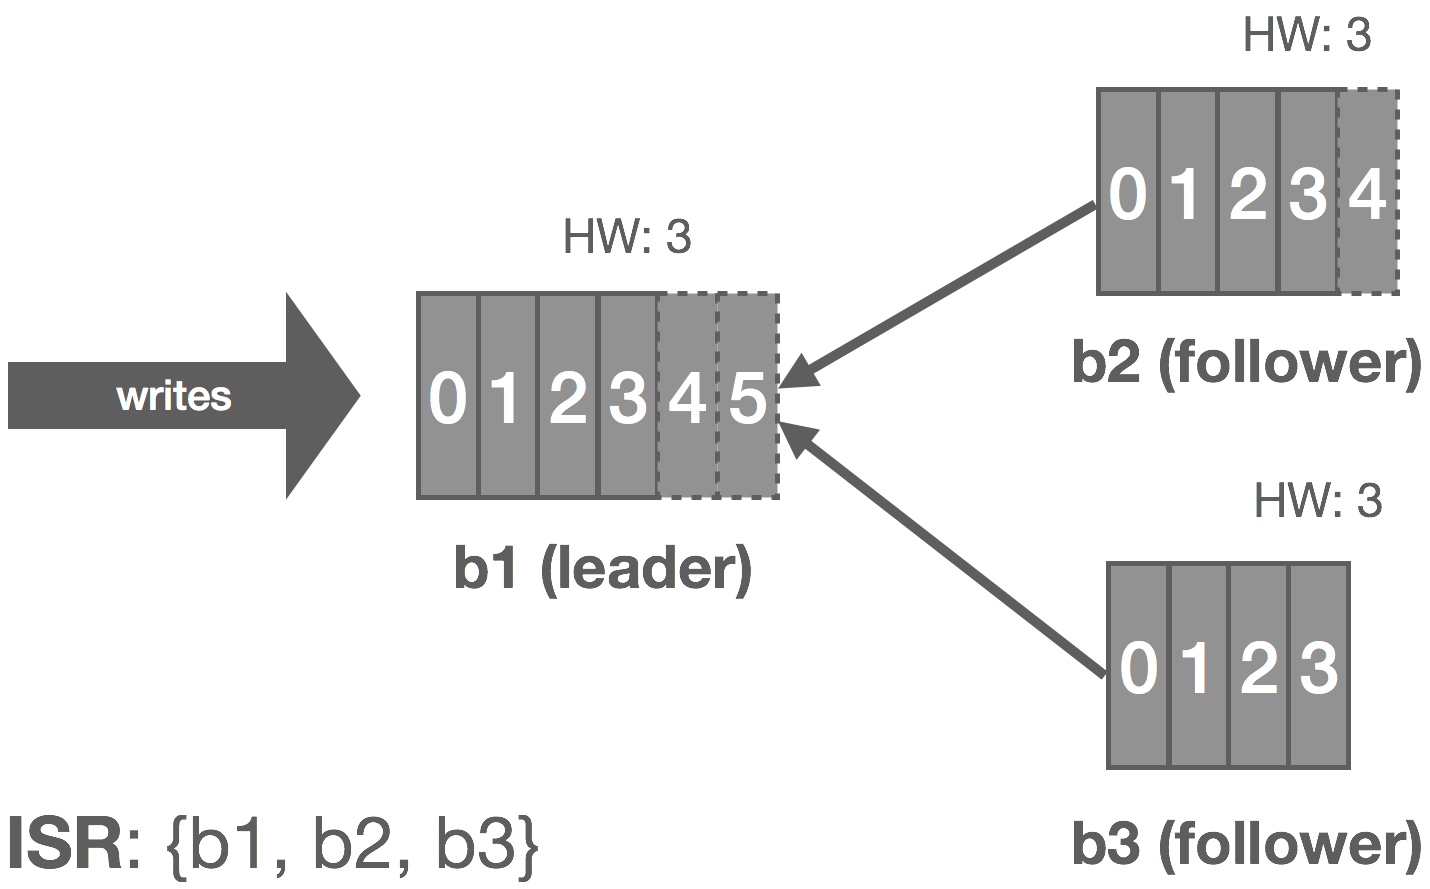
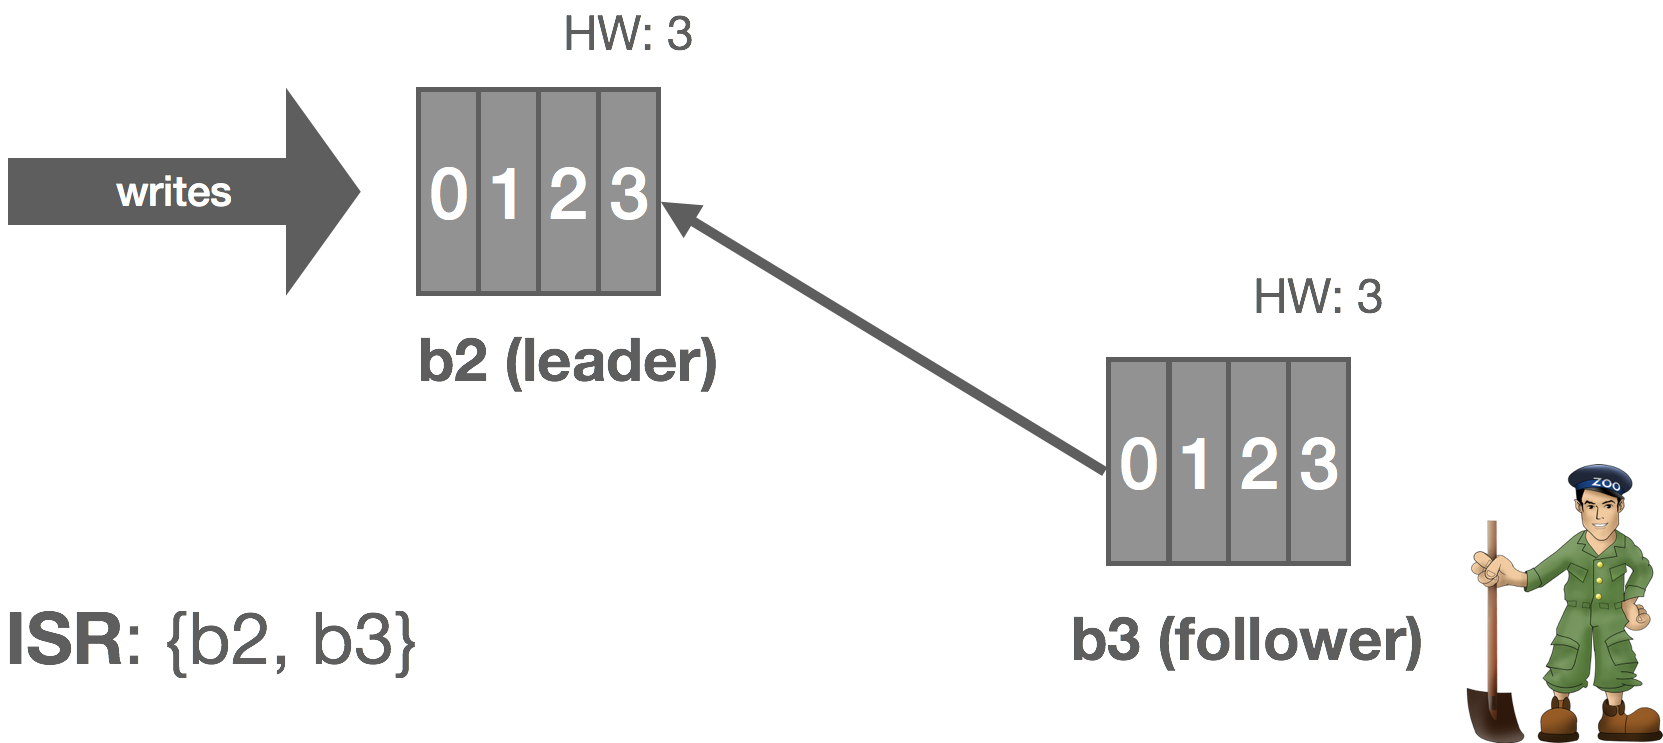
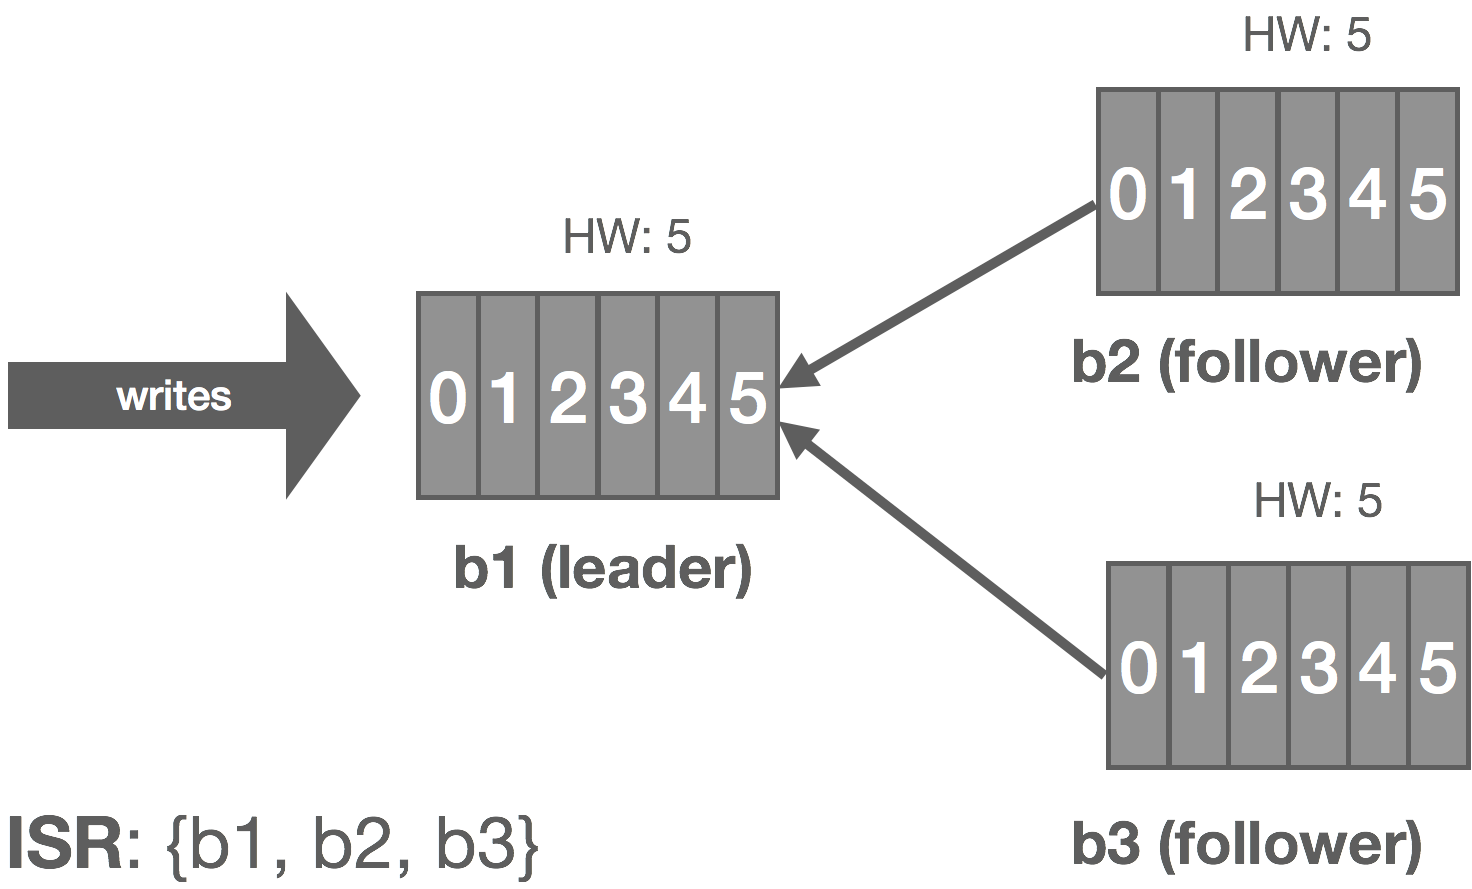
In Kafka, a leader is selected (we’ll touch on this in a moment). This leader maintains an in-sync replica set (ISR) consisting of all the replicas which are fully caught up with the leader. This is every replica, by definition, at the beginning. All reads and writes go through the leader. The leader writes messages to a write-ahead log (WAL). Messages written to the WAL are considered uncommitted or “dirty” initially. The leader only commits a message once all replicas in the ISR have written it to their own WAL. The leader also maintains a high-water mark (HW) which is the last committed message in the WAL. This gets piggybacked on the replica fetch responses from which replicas periodically checkpoint to disk for recovery purposes. The piggybacked HW then allows replicas to know when to commit.

Only committed messages are exposed to consumers. However, producers can configure how they want to receive acknowledgements on writes. It can wait until the message is committed on the leader (and thus replicated to the ISR), wait for the message to only be written (but not committed) to the leader’s WAL, or not wait at all. This all depends on what trade-offs the producer wants to make between latency and durability.

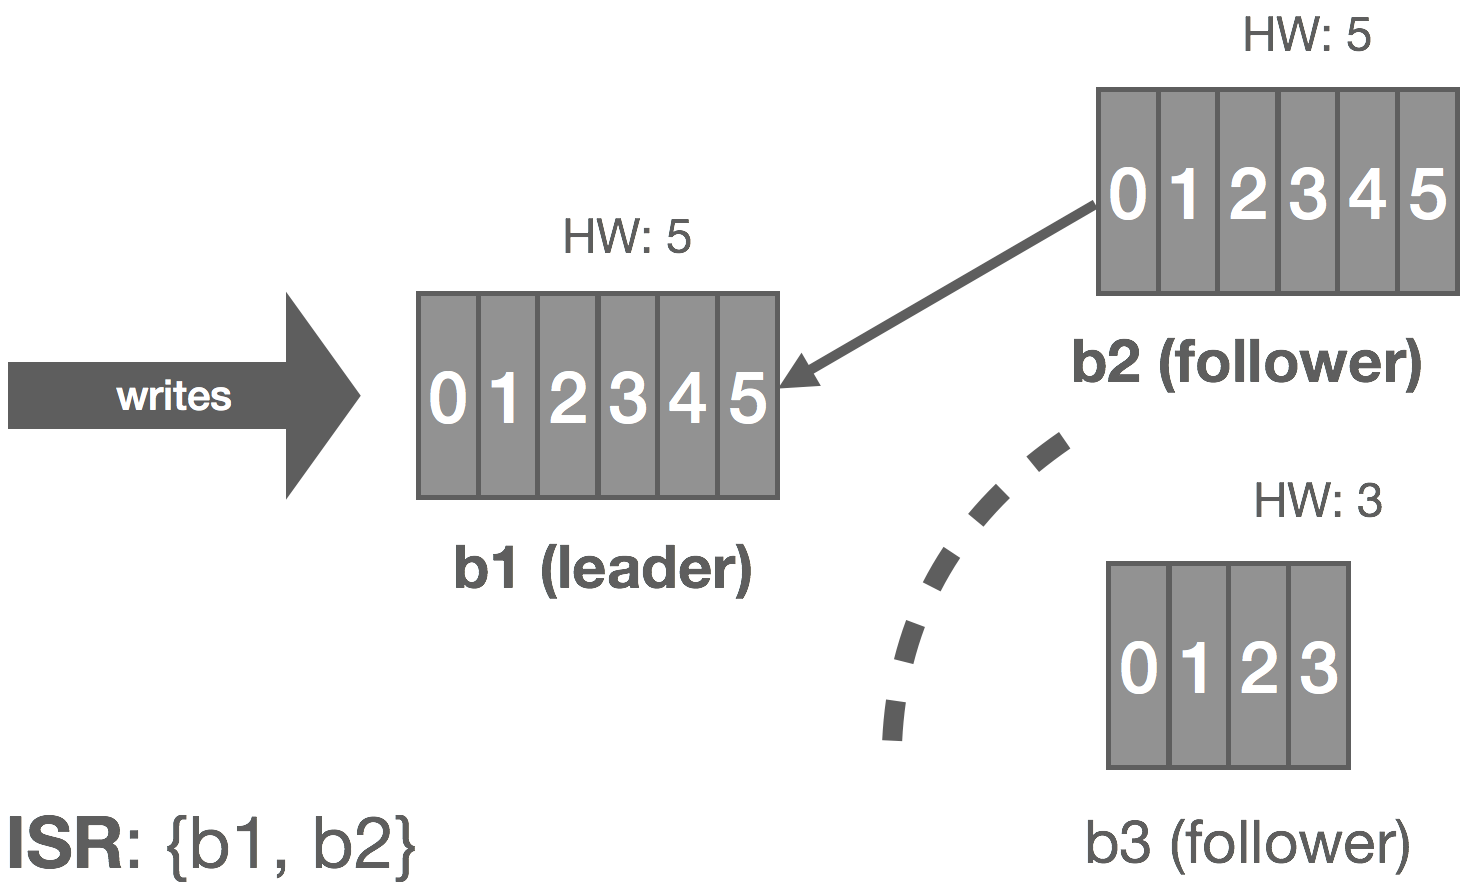
The graphic below shows how this replication process works for a cluster of three brokers: b1, b2, and b3. Followers are effectively special consumers of the leader’s log.

Now let’s look at a few failure modes and how Kafka handles them.

Leader Fails

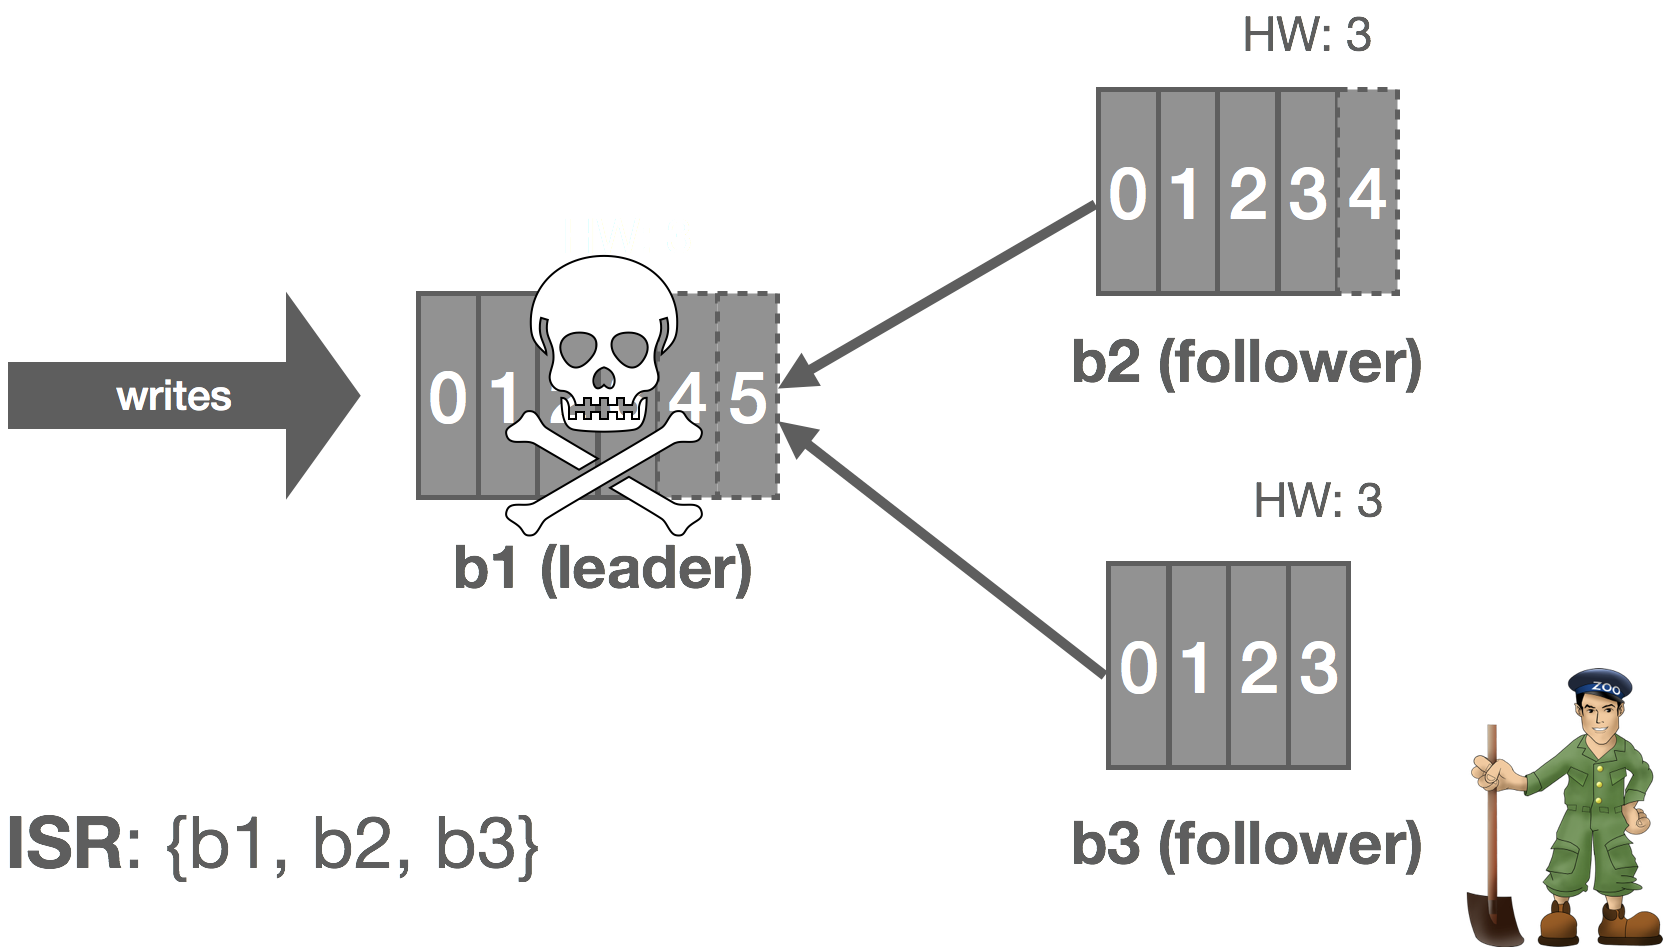
Kafka relies on Apache ZooKeeper for certain cluster coordination tasks, such as leader election, though this is not actually how the log leader is elected. A Kafka cluster has a single controller broker whose election is handled by ZooKeeper. This controller is responsible for performing administrative tasks on the cluster. One of these tasks is selecting a new log leader (actually partition leader, but this will be described later in the series) from the ISR when the current leader dies. ZooKeeper is also used to detect these broker failures and signal them to the controller.

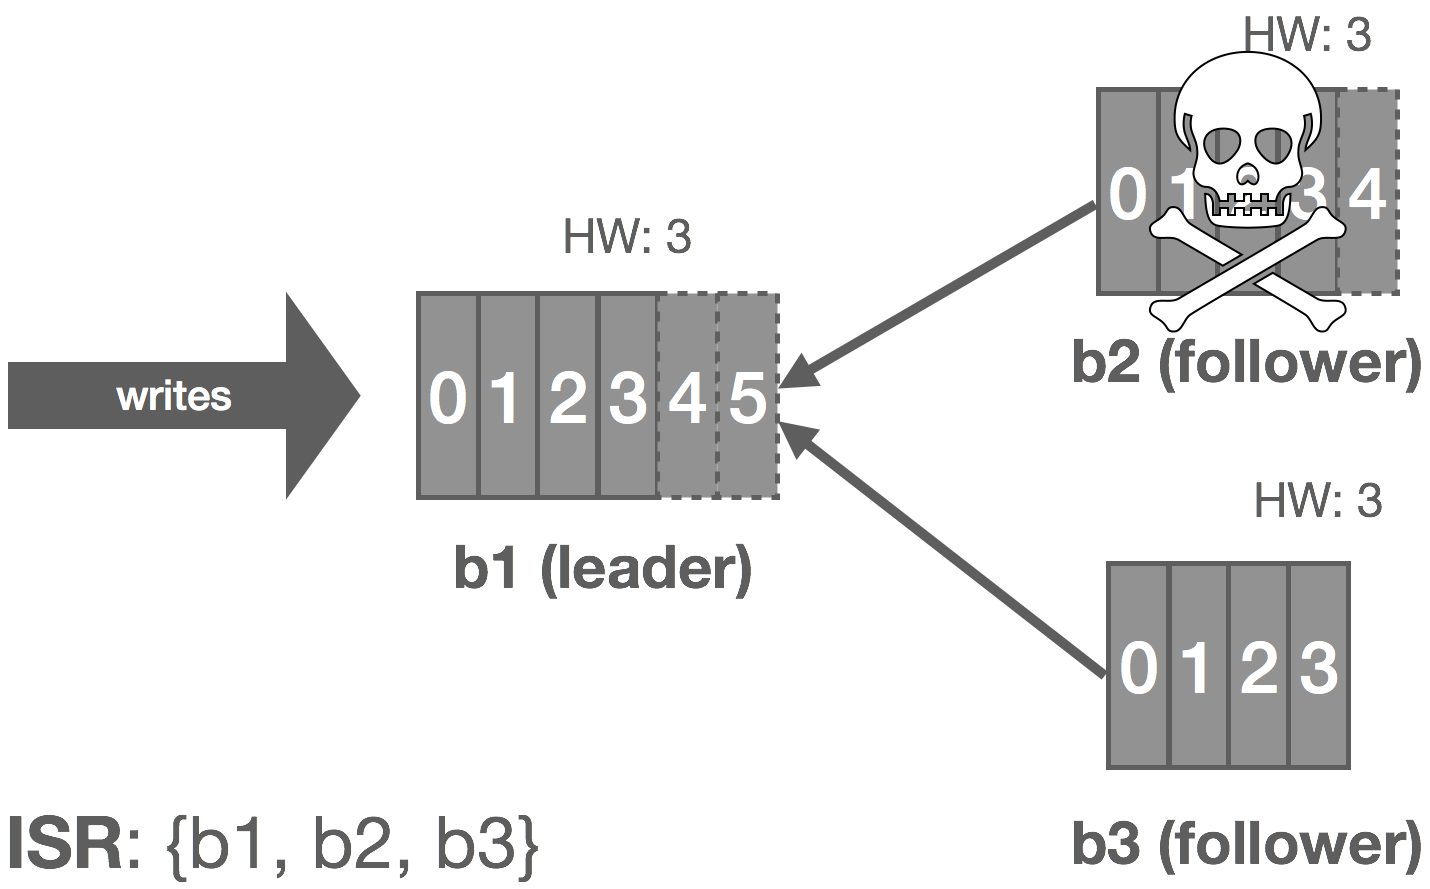
Thus, when the leader crashes, the cluster controller is notified by ZooKeeper and it selects a new leader from the ISR and announces this to the followers. This gives us automatic failover of the leader. All committed messages up to the HW are preserved and uncommitted messages may be lost during the failover. In this case, b1 fails and b2 steps up as leader.

Follower Fails

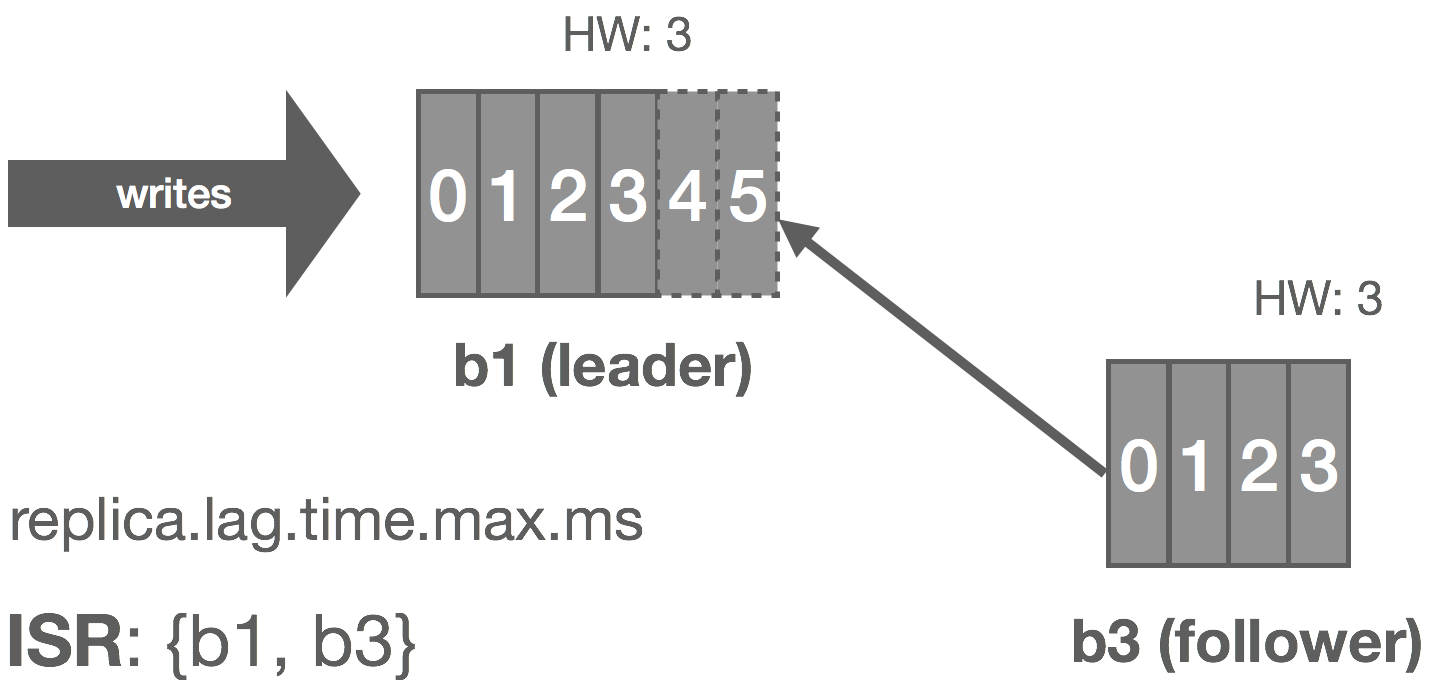
The leader tracks information on how “caught up” each replica is. Before Kafka 0.9, this included both how many messages a replica was behind, replica.lag.max.messages, and the amount of time since the replica last fetched messages from the leader, replica.lag.time.max.ms. Since 0.9, replica.lag.max.messages was removed and replica.lag.time.max.ms now refers to both the time since the last fetch request and the amount of time since the replica last caught up.

Thus, when a follower fails (or stops fetching messages for whatever reason), the leader will detect this based on replica.lag.time.max.ms. After that time expires, the leader will consider the replica out of sync and remove it from the ISR. In this scenario, the cluster enters an “under-replicated” state since the ISR has shrunk. Specifically, b2 fails and is removed from the ISR.

Follower Temporarily Partitioned

The case of a follower being temporarily partitioned, e.g. due to a transient network failure, is handled in a similar fashion to the follower itself failing. These two failure modes can really be combined since the latter is just the former with an arbitrarily long partition, i.e. it’s the difference between crash-stop and crash-recovery models.

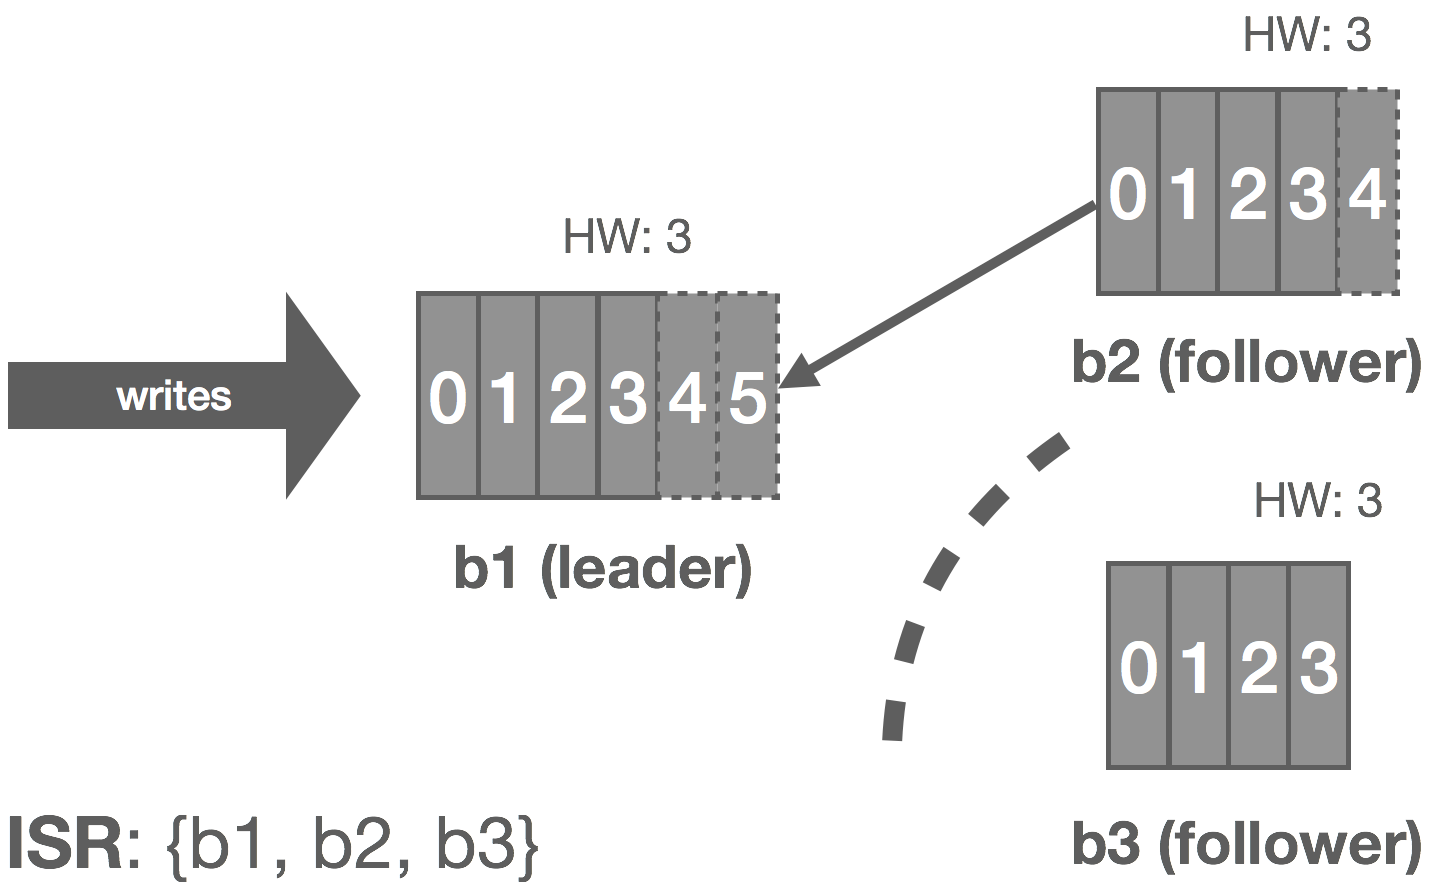
In this case, b3 is partitioned from the leader. As before, replica.lag.time.max.ms acts as our failure detector and causes b3 to be removed from the ISR. We enter an under-replicated state and the remaining two brokers continue committing messages 4 and 5. Accordingly, the HW is updated to 5 on these brokers.

When the partition heals, b3 continues reading from the leader and catching up. Once it is fully caught up with the leader, it’s added back into the ISR and the cluster resumes its fully replicated state.

We can generalize this to the crash-recovery model. For example, instead of a network partition, the follower could crash and be restarted later. When the failed replica is restarted, it recovers the HW from disk and truncates its log up to the HW. This preserves the invariant that messages after the HW are not guaranteed to be committed. At this point, it can begin catching up from the leader and will end up with a log consistent with the leader’s once fully caught up.

Replication in NATS Streaming

NATS Streaming relies on the Raft consensus algorithm for leader election and data replication. This sometimes comes as a surprise to some as Raft is largely seen as a protocol for replicated state machines. We’ll try to understand why Raft was chosen for this particular problem in the following sections. We won’t dive deep into Raft itself beyond what is needed for the purposes of this discussion.

While a log is a state machine, it’s a very simple one: a series of appends. Raft is frequently used as the replication mechanism for key-value stores which have a clearer notion of “state machine.” For example, with a key-value store, we have set and delete operations. If we set foo = bar and then later set foo = baz, the state gets rolled up. That is, we don’t necessarily care about the provenance of the key, only its current state.

However, NATS Streaming differs from Kafka in a number of key ways. One of these differences is that NATS Streaming attempts to provide a sort of unified API for streaming and queueing semantics not too dissimilar from Apache Pulsar. This means, while it has a notion of a log, it also has subscriptions on that log. Unlike Kafka, NATS Streaming tracks these subscriptions and metadata associated with them, such as where a client is in the log. These have definite “state machines” affiliated with them, like creating and deleting subscriptions, positions in the log, clients joining or leaving queue groups, and message-redelivery information.

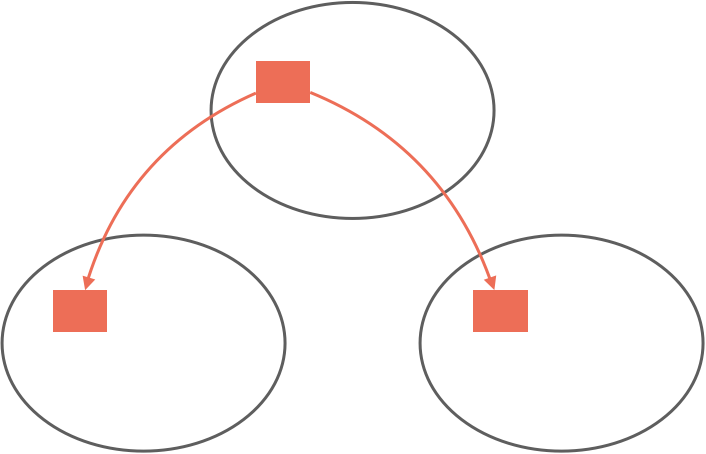
Currently, NATS Streaming uses multiple Raft groups for replication. There is a single metadata Raft group used for replicating client state and there is a separate Raft group per topic which replicates messages and subscriptions.

Raft solves both the problems of leader election and data replication in a single protocol. The Secret Lives of Data provides an excellent interactive illustration of how this works. As you step through that illustration, you’ll notice that the algorithm is actually quite similar to the Kafka replication protocol we walked through earlier. This is because although Raft is used to implement replicated state machines, it actually is a replicated WAL, which is exactly what Kafka is. One benefit of using Raft is we no longer have the need for ZooKeeper or some other coordination service.

Raft handles electing a leader. Heartbeats are used to maintain leadership. Writes flow through the leader to the followers. The leader appends writes to its WAL and they are subsequently piggybacked onto the heartbeats which get sent to the followers using AppendEntries messages. At this point, the followers append the write to their own WALs, assuming they don’t detect a gap, and send a response back to the leader. The leader commits the write once it receives a successful response from a quorum of followers.

Similar to Kafka, each replica in Raft maintains a high-water mark of sorts called the commit index, which is the index of the highest log entry known to be committed. This is piggybacked on the AppendEntries messages which the followers use to know when to commit entries in their WALs. If a follower detects that it missed an entry (i.e. there was a gap in the log), it rejects the AppendEntries and informs the leader to rewind the replication. The Raft paper details how it ensures correctness, even in the face of many failure modes such as the ones described earlier.

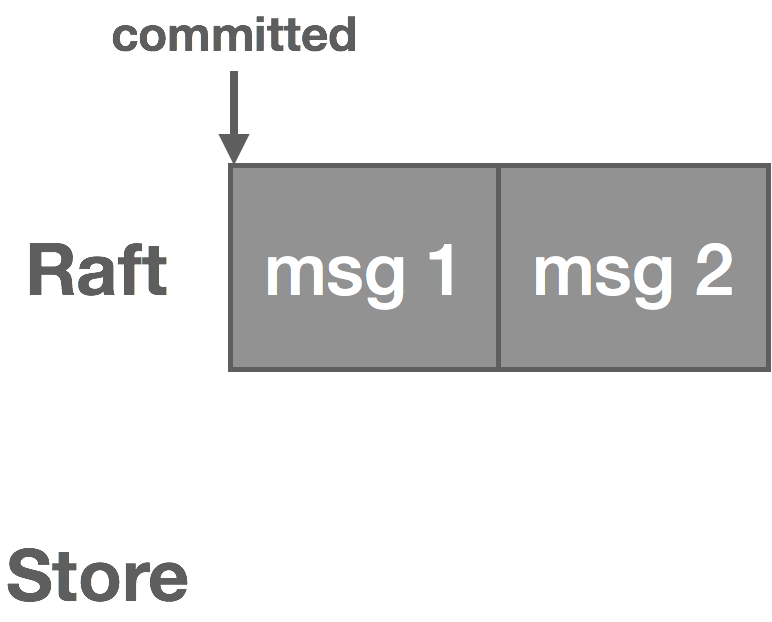
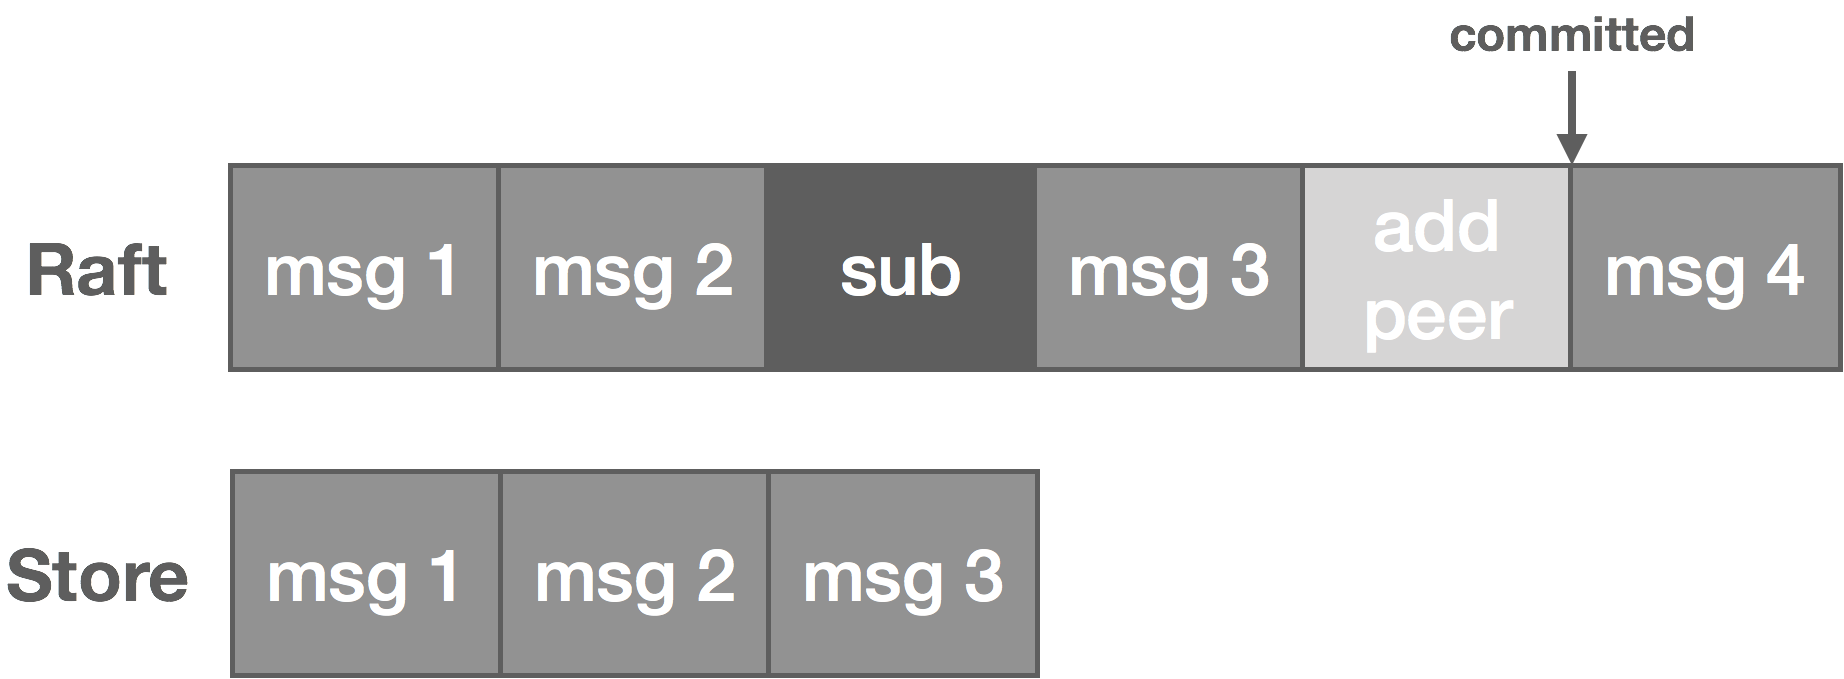
Conceptually, there are two logs: the Raft log and the NATS Streaming message log. The Raft log handles replicating messages and, once committed, they are appended to the NATS Streaming log. If it seems like there’s some redundancy here, that’s because there is, which we’ll get to soon. However, keep in mind we’re not just replicating the message log, but also the state machines associated with the log and any clients.

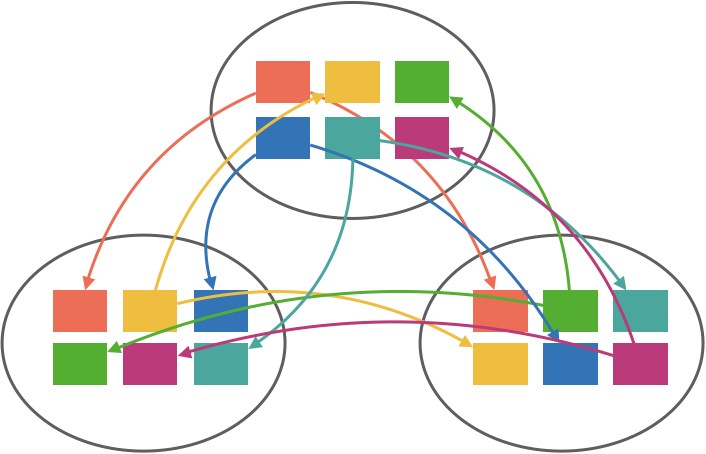
There are a few challenges with this replication technique, two of which we will talk about. The first is scaling Raft. With a single topic, there is one Raft group, which means one node is elected leader and it heartbeats messages to followers.

As the number of topics increases, so do the number of Raft groups, each with their own leaders and heartbeats. Unless we constrain the Raft group participants or the number of topics, this creates an explosion of network traffic between nodes.

There are a couple ways we can go about addressing this. One option is to run a fixed number of Raft groups and use a consistent hash to map a topic to a group. This can work well if we know roughly the number of topics beforehand since we can size the number of Raft groups accordingly. If you expect only 10 topics, running 10 Raft groups is probably reasonable. But if you expect 10,000 topics, you probably don’t want 10,000 Raft groups. If hashing is consistent, it would be feasible to dynamically add or remove Raft groups at runtime, but it would still require repartitioning a portion of topics which can be complicated.

Another option is to run an entire node’s worth of topics as a single group using a layer on top of Raft. This is what CockroachDB does to scale Raft in proportion to the number of key ranges using a layer on top of Raft they call MultiRaft. This requires some cooperation from the Raft implementation, so it’s a bit more involved than the partitioning technique but eschews the repartitioning problem and redundant heartbeating.

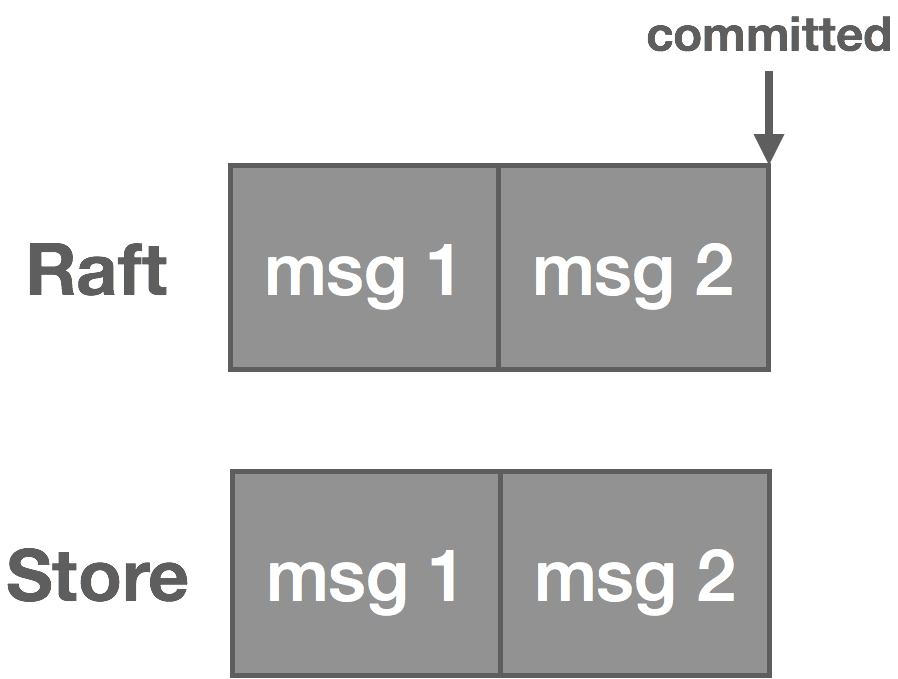
The second challenge with using Raft for this problem is the issue of “dual writes.” As mentioned before, there are really two logs: the Raft log and the NATS Streaming message log, which we’ll call the “store.” When a message is published, the leader writes it to its Raft log and it goes through the Raft replication process.

Once the message is committed in Raft, it’s written to the NATS Streaming log and the message is now visible to consumers.

Note, however, that not only messages are written to the Raft log. We also have subscriptions and cluster topology changes, for instance. These other items are not written to the NATS Streaming log but handled in other ways on commit. That said, messages tend to occur in much greater volume than these other entries.

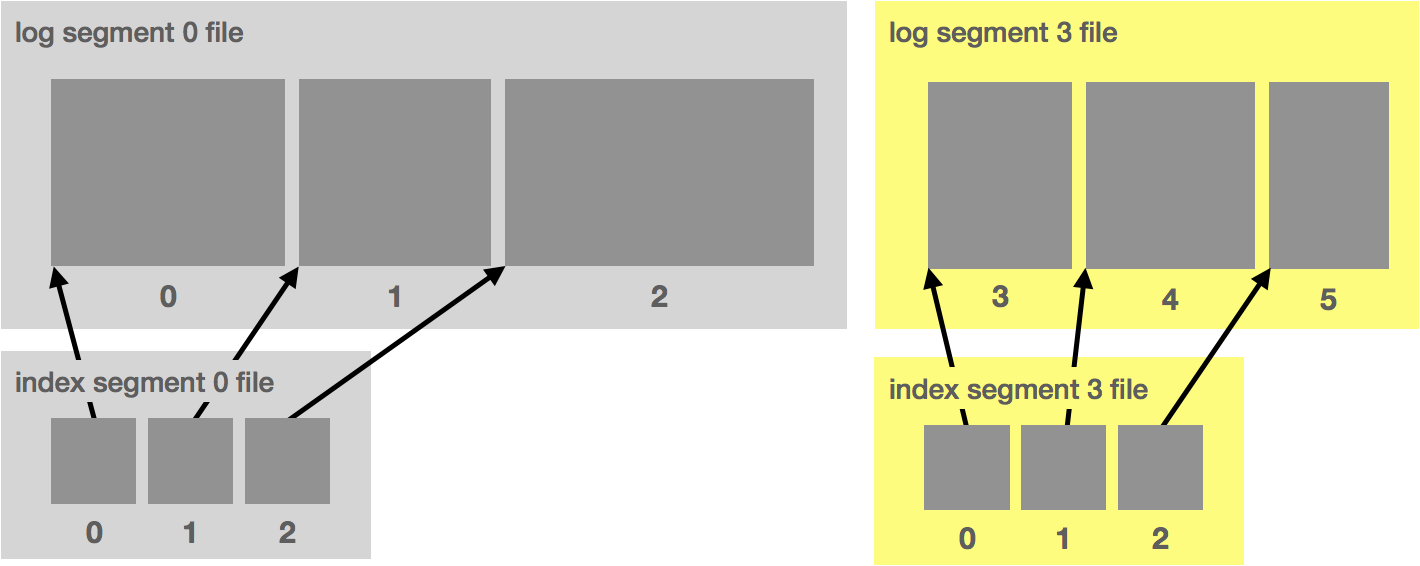
Messages end up getting stored redundantly, once in the Raft log and once in the NATS Streaming log. We can address this problem if we think about our logs a bit differently. If you recall from part one, our log storage consists of two parts: the log segment and the log index. The segment stores the actual log data, and the index stores a mapping from log offset to position in the segment.

Along these lines, we can think of the Raft log index as a “physical offset” and the NATS Streaming log index as a “logical offset.” Instead of maintaining two logs, we treat the Raft log as our message write-ahead log and treat the NATS Streaming log as an index into that WAL. Particularly, messages are written to the Raft log as usual. Once committed, we write an index entry for the message offset that points back into the log. As before, we use the index to do lookups into the log and can then read sequentially from the log itself.
Remaining Questions

We’ve answered the questions of how to ensure continuity of reads and writes, how to replicate data, and how to ensure replicas are consistent. The remaining two questions pertaining to replication are how do we keep things fast and how do we ensure data is durable?

There are several things we can do with respect to performance. The first is we can configure publisher acks depending on our application’s requirements. Specifically, we have three options. The first is the broker acks on commit. This is slow but safe as it guarantees the data is replicated. The second is the broker acks on appending to its local log. This is fast but unsafe since it doesn’t wait on any replica roundtrips but, by that very fact, means that the data is not replicated. If the leader crashes, the message could be lost. Lastly, the publisher can just not wait for an ack at all. This is the fastest but least safe option for obvious reasons. Tuning this all depends on what requirements and trade-offs make sense for your application.

The second thing we do is don’t explicitly fsync writes on the broker and instead rely on replication for durability. Both Kafka and NATS Streaming (when clustered) do this. With fsync enabled (in Kafka, this is configured with flush.messages and/or flush.ms and in NATS Streaming, with file_sync), every message that gets published results in a sync to disk. This ends up being very expensive. The thought here is if we are replicating to enough nodes, the replication itself is sufficient for HA of data since the likelihood of more than a quorum of nodes failing is low, especially if we are using rack-aware clustering. Note that data is still periodically flushed in the background by the kernel.

Batching aggressively is also a key part of ensuring good performance. Kafka supports end-to-end batching from the producer all the way to the consumer. NATS Streaming does not currently support batching at the API level, but it uses aggressive batching when replicating and persisting messages. In my experience, this makes about an order-of-magnitude improvement in throughput.

Finally, as already discussed earlier in the series, keeping disk access sequential and maximizing zero-copy reads makes a big difference as well.

There are a few things worth noting with respect to durability. Quorum is what guarantees durability of data. This comes “for free” with Raft due to the nature of that protocol. In Kafka, we need to do a bit of configuring to ensure this. Namely, we need to configure min.insync.replicas on the broker and acks on the producer. The former controls the minimum number of replicas that must acknowledge a write for it to be considered successful when a producer sets acks to “all.” The latter controls the number of acknowledgments the producer requires the leader to have received before considering a request complete. For example, with a topic that has a replication factor of three, min.insync.replicas needs to be set to two and acks set to “all.” This will, in effect, require a quorum of two replicas to process writes.

Another caveat with Kafka is unclean leader elections. That is, if all replicas become unavailable, there are two options: choose the first replica to come back to life (not necessarily in the ISR) and elect this replica as leader (which could result in data loss) or wait for a replica in the ISR to come back to life and elect it as leader (which could result in prolonged unavailability). Initially, Kafka favored availability by default by choosing the first strategy. If you preferred consistency, you needed to set unclean.leader.election.enable to false. However, as of 0.11, unclean.leader.election.enable now defaults to this.
Fundamentally, durability and consistency are at odds with availability. If there is no quorum, then no reads or writes can be accepted and the cluster is unavailable. This is the crux of the CAP theorem.

In part three of this series, we will discuss scaling message delivery in the distributed log.

Building a Distributed Log from Scratch, Part 1: Storage Mechanics

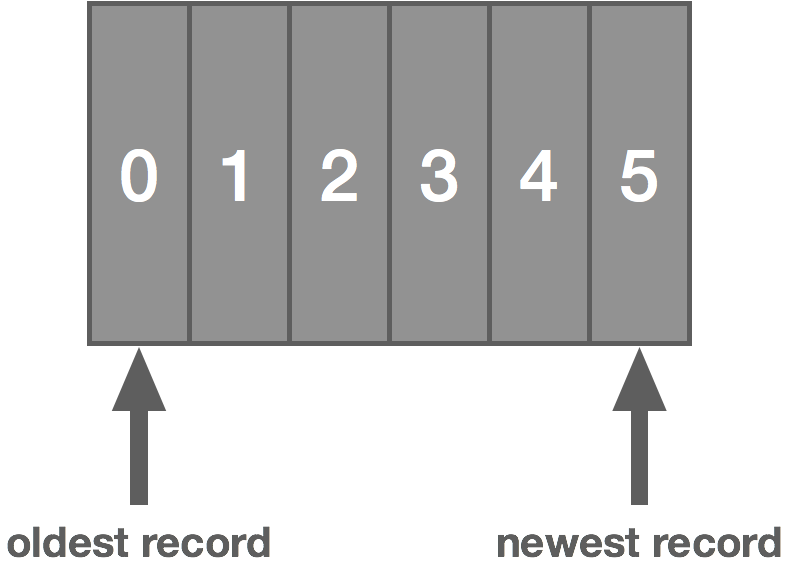
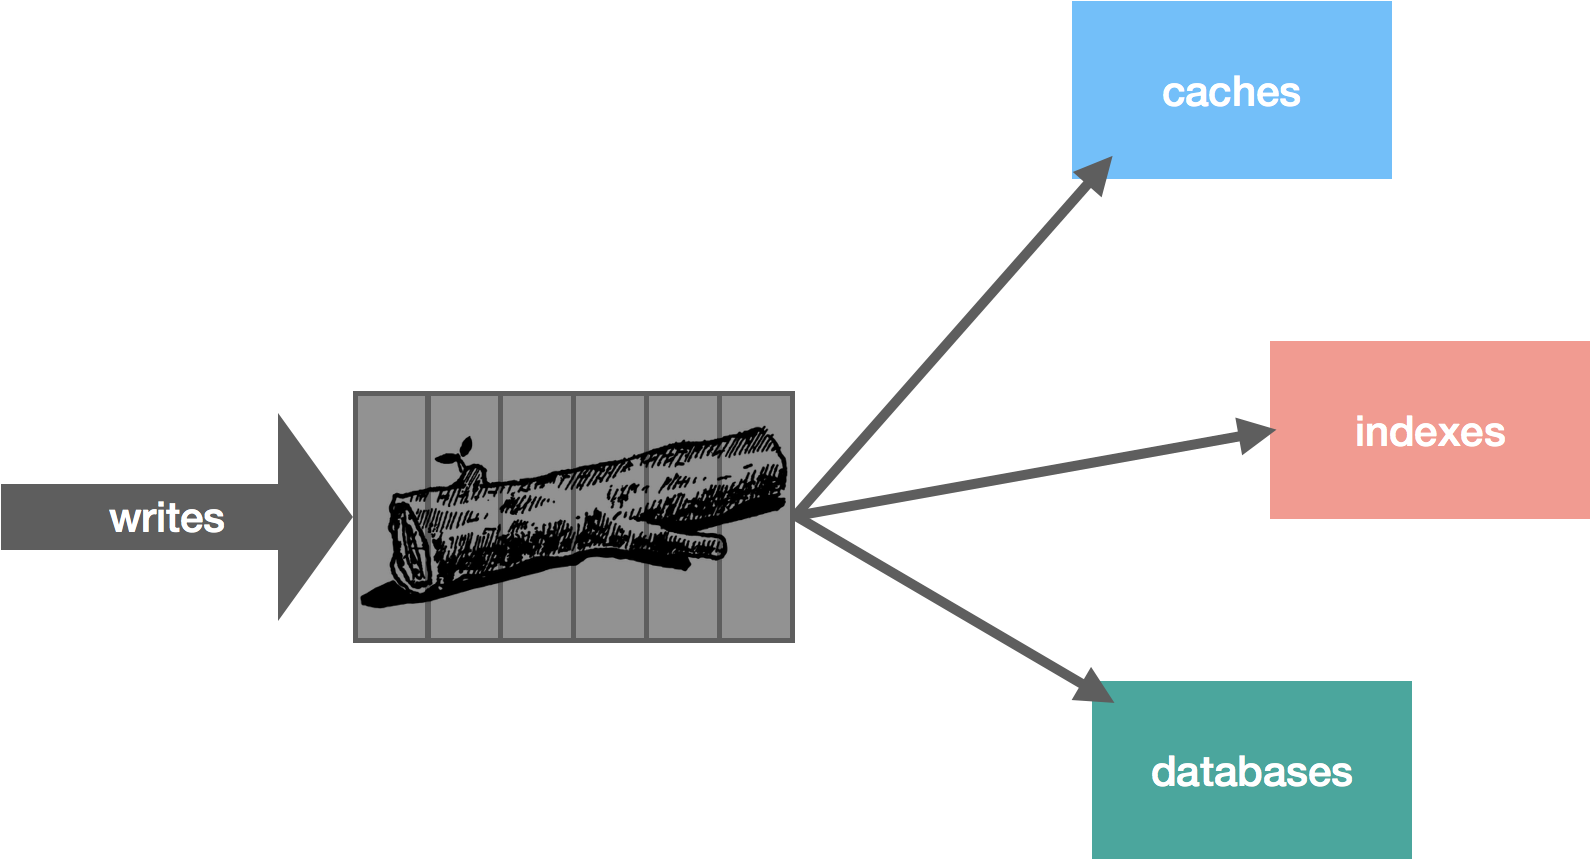
The log is a totally-ordered, append-only data structure. It’s a powerful yet simple abstraction—a sequence of immutable events. It’s something that programmers have been using for a very long time, perhaps without even realizing it because it’s so simple. Whether it’s application logs, system logs, or access logs, logging is something every developer uses on a daily basis. Essentially, it’s a timestamp and an event, a when and a what, and typically appended to the end of a file. But when we generalize that pattern, we end up with something much more useful for a broad range of problems. It becomes more interesting when we look at the log not just as a system of record but a central piece in managing data and distributing it across the enterprise efficiently.


There are a number of implementations of this idea: Apache Kafka, Amazon Kinesis, NATS Streaming, Tank, and Apache Pulsar to name a few. We can probably credit Kafka with popularizing the idea.

I think there are at least three key priorities for the effectiveness of one of these types of systems: performance, high availability, and scalability. If it’s not fast enough, the data becomes decreasingly useful. If it’s not highly available, it means we can’t reliably get our data in or out. And if it’s not scalable, it won’t be able to meet the needs of many enterprises.

When we apply the traditional pub/sub semantics to this idea of a log, it becomes a very useful abstraction that applies to a lot of different problems.

In this series, we’re not going to spend much time discussing why the log is useful. Jay Kreps has already done the legwork on that with The Log: What every software engineer should know about real-time data’s unifying abstraction. There’s even a book on it. Instead, we will focus on what it takes to build something like this using Kafka and NATS Streaming as case studies of sorts—Kafka because of its ubiquity, NATS Streaming because it’s something with which I have personal experience. We’ll look at a few core components like leader election, data replication, log persistence, and message delivery. Part one of this series starts with the storage mechanics. Along the way, we will also discuss some lessons learned while building NATS Streaming, which is a streaming data layer on top of the NATS messaging system. The intended outcome of this series is threefold: to learn a bit about the internals of a log abstraction, to learn how it can achieve the three goals described above, and to learn some applied distributed systems theory.

With that in mind, you will probably never need to build something like this yourself (nor should you), but it helps to know how it works. I also find that software engineering is all about pattern matching. Many types of problems look radically different but are surprisingly similar. Some of these ideas may apply to other things you come across. If nothing else, it’s just interesting.

Let’s start by looking at data storage since this is a critical part of the log and dictates some other aspects of it. Before we dive into that, though, let’s highlight some first principles we’ll use as a starting point for driving our design.

As we know, the log is an ordered, immutable sequence of messages. Messages are atomic, meaning they can’t be broken up. A message is either in the log or not, all or nothing. Although we only ever add messages to the log and never remove them (as with a message queue), the log has a notion of message retention based on some policies, which allows us to control how the log is truncated. This is a practical requirement since otherwise the log will grow endlessly. These policies might be based on time, number of messages, number of bytes, etc.

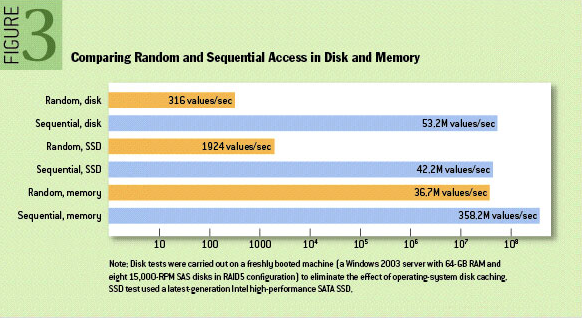
The log can be played back from any arbitrary position. With position, we normally refer to a logical message timestamp rather than a physical wall-clock time, such as an offset into the log. The log is stored on disk, and sequential disk access is actually relatively fast. The graphic below taken from the ACM Queue article The Pathologies of Big Data helps bear this out (this is helpfully pointed out by Kafka’s documentation).

That said, modern OS page caches mean that sequential access often avoids going to disk altogether. This is because the kernel keeps cached pages in otherwise unused portions of RAM. This means both reads and writes go to the in-memory page cache instead of disk. With Kafka, for example, we can verify this quite easily by running a simple test that writes some data and reads it back and looking at disk IO using iostat. After running such a test, you will likely see something resembling the following, which shows the number of blocks read and written is exactly zero.

avg-cpu:  %user   %nice %system %iowait  %steal   %idle
          13.53    0.00   11.28    0.00    0.00   75.19

Device:    tps   Blk_read/s   Blk_wrtn/s   Blk_read   Blk_wrtn
xvda      0.00         0.00         0.00          0          0

With the above in mind, our log starts to look an awful lot like an actual logging file, but instead of timestamps and log messages, we have offsets and opaque data messages. We simply add new messages to the end of the file with a monotonically increasing offset.

However, there are some problems with this approach. Namely, the file is going to get very, very large. Recall that we need to support a few different access patterns: looking up messages by offset and also truncating the log using a variety of different retention policies. Since the log is ordered, a lookup is simply a binary search for the offset, but this is expensive with a large log file. Similarly, aging out data by retention policy is harder.

To account for this, we break up the log file into chunks. In Kafka, these are called segments. In NATS Streaming, they are called slices. Each segment is a new file. At a given time, there is a single active segment, which is the segment messages are written to. Once the segment is full (based on some configuration), a new one is created and becomes active.

Segments are defined by their base offset, i.e. the offset of the first message stored in the segment. In Kafka, the files are also named with this offset. This allows us to quickly locate the segment in which a given message is contained by doing a binary search.

Alongside each segment file is an index file that maps message offsets to their respective positions in the log segment. In Kafka, the index uses 4 bytes for storing an offset relative to the base offset and 4 bytes for storing the log position. Using a relative offset is more efficient because it means we can avoid storing the actual offset as an int64. In NATS Streaming, the timestamp is also stored to do time-based lookups.

Ideally, the data written to the log segment is written in protocol format. That is, what gets written to disk is exactly what gets sent over the wire. This allows for zero-copy reads. Let’s take a look at how this otherwise works.

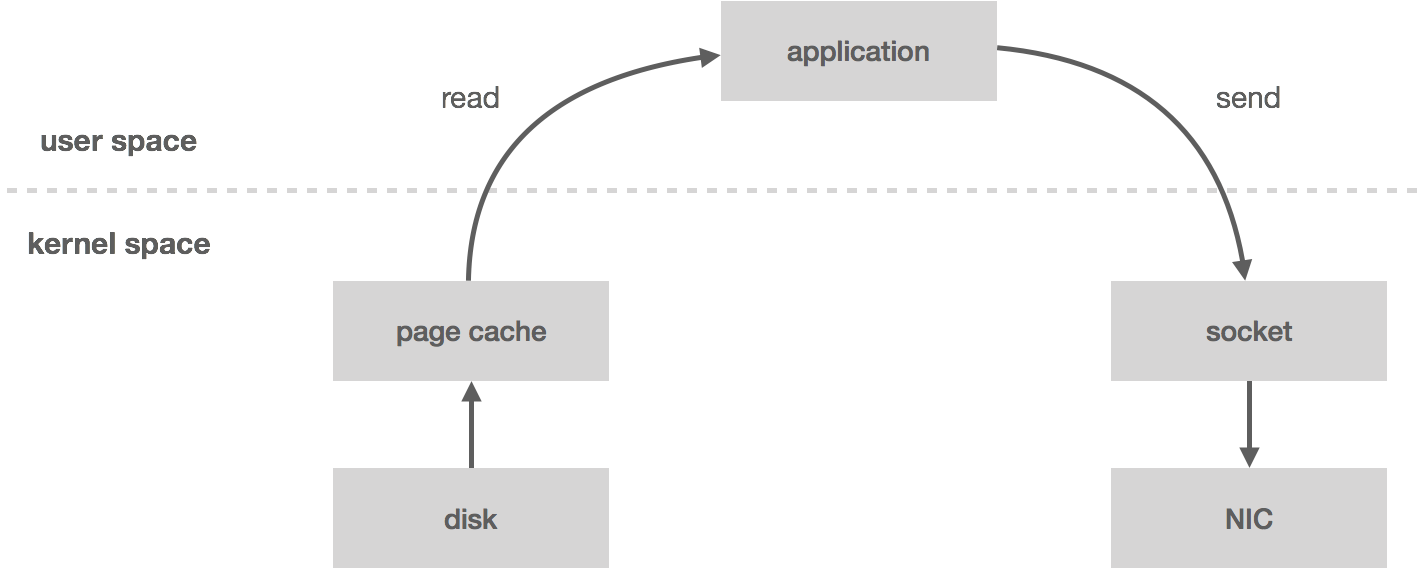
When you read messages from the log, the kernel will attempt to pull the data from the page cache. If it’s not there, it will be read from disk. The data is copied from disk to page cache, which all happens in kernel space. Next, the data is copied into the application (i.e. user space). This all happens with the read system call. Now the application writes the data out to a socket using send, which is going to copy it back into kernel space to a socket buffer before it’s copied one last time to the NIC. All in all, we have four copies (including one from page cache) and two system calls.

However, if the data is already in wire format, we can bypass user space entirely using the sendfile system call, which will copy the data directly from the page cache to the NIC buffer—two copies (including one from page cache) and one system call. This turns out to be an important optimization, especially in garbage-collected languages since we’re bringing less data into application memory. Zero-copy also reduces CPU cycles and memory bandwidth.

NATS Streaming does not currently make use of zero-copy for a number of reasons, some of which we will get into later in the series. In fact, the NATS Streaming storage layer is actually pluggable in that it can be backed by any number of mediums which implement the storage interface. Out of the box it includes the file-backed storage described above, in-memory, and SQL-backed.

There are a few other optimizations to make here such as message batching and compression, but we’ll leave those as an exercise for the reader.

In part two of this series, we will discuss how to make this log fault tolerant by diving into data-replication techniques.

Thrift on Steroids: A Tale of Scale and Abstraction

Apache Thrift is an RPC framework developed at Facebook for building “scalable cross-language services.” It consists of an interface definition language (IDL), communication protocol, API libraries, and a code generator that allows you to build and evolve services independently and in a polyglot fashion across a wide range of languages. This is nothing new and has been around for over a decade now.

There are a number of notable users of Thrift aside from Facebook, including Twitter (mainly by way of Finagle), Foursquare, Pinterest, Uber (via TChannel), and Evernote, among others—and for good reason, Thrift is mature and battle-tested.

The white paper explains the motivation behind Thrift in greater detail, though I think the following paragraph taken from the introduction does a pretty good job of summarizing it:

As Facebook’s traffic and network structure have scaled, the resource demands of many operations on the site (i.e. search, ad selection and delivery, event logging) have presented technical requirements drastically outside the scope of the LAMP framework. In our implementation of these services, various programming languages have been selected to optimize for the right combination of performance, ease and speed of development, availability of existing libraries, etc. By and large, Facebook’s engineering culture has tended towards choosing the best tools and implementations available over standardizing on any one programming language and begrudgingly accepting its inherent limitations.

Basically, as Facebook scaled, they moved more and more away from PHP and the LAMP stack and became increasingly polyglot. I think this same evolution is seen at most startups as they grow into themselves. We saw a similar transition in my time at Workiva, moving from our monolothic Python application on Google App Engine to a polyglot service-oriented architecture in AWS. It was an exciting but awkward time as we went through our adolescence as an engineering culture and teams started to find their identities. Teams learned what it meant to build backward-compatible APIs and loosely coupled services, how to deprecate APIs, how to build resilient and highly available systems, how to properly instrument services and diagnose issues, how to run and manage the underlying infrastructure, and—most importantly—how to collaborate with each other. There was lots of stumbling and mistakes along the way, lots of postmortems, lots of stress, but with that comes the learning and growing. The payoff is big but the process is painful. I don’t think it ever isn’t.

With one or two services written in the same language and relatively few developers, it was easy to just stick with “REST” (in quotes because it’s always a bastardized version of what REST ought to be), sling some JSON around, and call it a day. As the number of tech stacks and integration points increase, it becomes apparent that some standards are important. And once things are highly polyglot with lots of developers and lots of services running with lots of versions, strict service contracts become essential.

Uber has a blog post on building microservices that explains this and why they settled on Thrift to solve this problem.

Since the number of service calls grows rapidly, it is necessary to maintain a well-defined interface for every call. We knew we wanted to use an IDL for managing this interface, and we ultimately decided on Thrift. Thrift forces service owners to publish strict interface definitions, which streamlines the process of integrating with services. Calls that do not abide by the interface are rejected at the Thrift level instead of leaking into a service and failing deeper within the code. This strategy of publicly declaring your interface emphasizes the importance of backwards compatibility, since multiple versions of a service’s Thrift interface could be in use at any given time. The service author must not make breaking changes, and instead must only make non-breaking additions to the interface definition until all consumers are ready for deprecation.

Early on, I was tasked with building a unified messaging solution that would help with our integration challenges. The advantages of a unified solution should be obvious: reusability (before this, everyone was solving the problem in their own way), focus (allow developers to focus on their problem space, not the glue), acceleration (if the tools are already available, there’s less work to do), and shared pain points (it’s a lot easier to prioritize your work when everyone is complaining about the same thing). Also, a longer term benefit is developing the knowledge of this shared solution into an organizational competency which has a sort of “economy of scale” to it. Our job was not just to ship a messaging platform but evangelize it and help other teams to be successful with it. We did this through countless blog posts, training sessions, workshops, talks, and even a podcast.

Before we set out on building a common messaging solution, there were a few key principles we used to guide ourselves. We wanted to provide a core set of tools, libraries, and infrastructure for service integration. We wanted a solution that was rigid yet flexible. We provide only a minimal set of messaging patterns to act as generic building blocks with strict, strongly typed APIs, and promote design best practices and a service-oriented mindset. This meant supporting service evolution and API iteration through versioning and backward compatibility, allowing for resiliency patterns like timeouts, retries, circuit breakers, etc., and generally advocating asynchronous, loosely coupled communication. Lastly, we had to keep in mind that, at the end of the day, developers are just trying to ship stuff, so we had to balance these concerns out with ergonomics and developer experience so they could build, integrate, and ship quickly.

As much as I think RPC is a bad abstraction, it’s what developers want. If you don’t provide them with an RPC solution, they will build their own, so we had to provide first-class support for it. We evaluated solutions in the RPC space. We looked at GRPC extensively, which is the new RPC hotness from Google, but it had a few key drawbacks, namely its “newness” (it was still in early beta at the time and has since been almost entirely rewritten), it’s coupled to HTTP/2 as a transport (which at the time had fairly limited support), and it lacks support for JavaScript (let alone Dart, which is what most of our client applications were being written in). Avro was another we looked at.

Ultimately, we settled on Thrift due to its maturity and wide use in production, its performance, its architecture (it separates out the transports, protocols, and RPC layer with the first two being pluggable), its rich feature set, and its wide range of language support (checking off all the languages we standardized on as a company including Go, Java, Python, JavaScript, and Dart). Thrift is not without its problems though—more on this in a bit.

In addition to RPC, we wanted to promote a more asynchronous, message-passing style of communication with pub/sub. This would allow for greater flexibility in messaging patterns like fan-out and fan-in, interest-based messaging, and reduced coupling and fragility of services. This enables things like the worker pattern where we can distribute work to a pool of workers and scale that pool independently, whereas RPC tends to promote more stateful types of services. In my experience, developers tend to bias towards stateful services since this is how we’ve built things for a long time, but as we’ve entered the cloud-native era, things are running in containers which are autoscaled, more ephemeral, and more distributed. We have to grapple with the complexity imposed by distributed systems. This is why asynchronous messaging is important and why we wanted to support it from the onset.

We selected NATS as a messaging backplane because of its simplicity, performance, scalability, and adoption of the cloud-native mentality. When it comes to service integration, you need an always-on dial tone and NATS provides just that. Because of Thrift’s pluggable transport layer, we could build a NATS RPC transport while also providing HTTP and TCP transports.

Unfortunately, Thrift doesn’t provide any kind of support for pub/sub, and we wanted the same guarantees for it that we had with RPC, like type safety and versioning with code-generated APIs and service contracts. Aside from this, Thrift has a number of other, more glaring problems:

  • Head-of-line blocking: a single, slow request will block any subsequent requests for a client.
  • Out-of-order responses: an out-of-order response puts a Thrift transport in a bad state, requiring it to be torn down and reestablished, e.g. if a slow request times out at the client, the client issues a subsequent request, and a response comes back for the first request, the client blows up.
  • Concurrency: a Thrift client cannot be shared between multiple threads of execution, requiring each thread to have its own client issuing requests sequentially. This, combined with head-of-line blocking, is a major performance killer. This problem is compounded when each transport has its own resources, such as a socket.
  • RPC timeouts: Thrift does not provide good facilities for per-request timeouts, instead opting for a global transport read timeout.
  • Request headers: Thrift does not provide support for request metadata, making it difficult to implement things like authentication/authorization and distributed tracing. Instead, you are required to bake these things into your IDL or in a wrapped transport. The problem with this is it puts the onus on service providers rather than allowing an API gateway or middleware to perform these functions in a centralized way.
  • Middleware: Thrift does not have any support for client or server middleware. This means clients must be wrapped to implement interceptor logic and middleware code must be duplicated within handler functions. This makes it impossible to implement AOP-style logic in a clean, DRY way.

Twitter’s Finagle addresses many of these issues but is solely for the JVM, so we decided to address Thrift’s shortcomings in a cross-platform way without completely reinventing the wheel. That is, we took Thrift and extended it. What we ended up with was Frugal, a superset of Thrift recently open sourced that aims to solve the problems described above while also providing support for asynchronous pub/sub APIs—a sort of Thrift on steroids as I’ve come to call it. Its key features include:

  • Request multiplexing: client requests are fully multiplexed, allowing them to be issued concurrently while simultaneously avoiding the head-of-line blocking and out-of-order response problems. This also lays some groundwork for asynchronous messaging patterns.
  • Thread-safety: clients can be safely shared between multiple threads in which requests can be made in parallel.
  • Pub/sub: IDL and code-generation extensions for defining pub/sub APIs in a type-safe way.
  • Request context: a first-class request context object is added to every operation which allows defining request/response headers and per-request timeouts. By making the context part of the Frugal protocol, headers can be introspected or even injected by external middleware. This context could be used to send OAuth2 tokens and user-context information, avoiding the need to include it everywhere in your IDL and handler logic. Correlation IDs for distributed tracing purposes are also built into the request context.
  • Middleware: client- and server- side middleware is supported for RPC and pub/sub APIs. This allows you to implement interceptor logic around handler functions, e.g. for authentication, logging, or retry policies. One can easily integrate OpenTracing as a middleware, for example.
  • Cross-language: support for Go, Java, Dart, and Python (2.7 and 3.5).

Frugal adds a second kind of transport alongside Thrift’s RPC transport for pub/sub. With this, we provide a NATS transport for both pub/sub and RPC (internally, Workiva also has an at-least-once delivery pub/sub transport built around Amazon SQS for mission-critical data). In addition to this, we built a SDK which developers use to connect to the messaging infrastructure (such as NATS) with minimal ceremony. The messaging SDK played a vital role not just in making it easy for developers to adopt and integrate, but providing us a shim where we could introduce sweeping changes across the organization in one place, such as adding instrumentation, tracing, and authentication. This enabled us to roll critical integration components out to every service by making a change in one place.

To support pub/sub, we extended the Thrift IDL with an additional top-level construct called a scope, which is effectively a pub/sub namespace (basically what a service is to RPC). We wrote the IDL using a parsing expression grammar which allows us to generate a parser. We then implemented a code generator for the various language targets. The Frugal compiler is written in Go and is, at least in my opinion, much more maintainable than Thrift’s C++ codebase. However, the language libraries make use of the existing Thrift APIs, such as protocols, transports, etc. This means we didn’t need to implement any of the low-level mechanics like serialization.

I’ve since left Workiva (and am now actually working on NATS), but as far as I know, Frugal helps power nearly every production service at the company. It was an interesting experience from which I learned a lot. I was happy to see some of that work open sourced so others could use it and learn from it.

Of course, if I were starting over today, things would probably look different. GRPC is much more mature and the notion of a “service mesh” has taken the container world by storm with things like Istio, Linkerd, and Envoy. What we built was Workiva’s service mesh, we just didn’t have a name for it, so we called it a “Messaging SDK.” The corollary to this is you don’t need to adopt bleeding-edge tech to be successful. The concepts are what’s important, and if enough people are working on the same types of problems in parallel, they will likely converge on solutions that look very similar to each other given enough time and enough people working on them.

I think there’s a delicate balance between providing solutions that are “easy” from a developer point of view but may provide longer term drawbacks when it comes to building complex systems the “right” way. I see RPC as an example of this. It’s an “easy” abstraction but it hides a lot of complexity. Service meshes might even be in this category, but they have obvious upsides when it comes to building software in a way that is scalable. Peter Alvaro’s Strange Loop talk “I See What You Mean” does a great job of articulating this dilemma, which I’ve also written about myself. In the end, we decided to optimize for shipping, but we took a principled approach: provide the tools developers need (or want) but help educate them to utilize those tools in a way that allows them to ship products that are reliable and maintainable. Throwing tools or code over the wall is not enough.

Smart Endpoints, Dumb Pipes

I read an interesting article recently called How do you cut a monolith in half? There are a lot of thoughts in the article that resonate with me and some that I disagree with, prompting this response.

The overall message of the article is don’t use a message broker to break apart a monolith because it’s like a cross between a load balancer and a database, with the disadvantages of both and the advantages of neither. The author argues that message brokers are a popular way to pull apart components over a network because they have low setup cost and provide easy service discovery, but they come at a high operational cost. My response to that is the same advice the author puts forward: it depends.

I think it’s important not to conflate “message broker” and “message queue.” The article uses them interchangeably, but it’s really talking about the latter, which I see as a subset of the former. Queues provide, well, queuing semantics. They try to ensure delivery of a message or, more generally, distribution of work. As the author puts it: “In practice, a message broker is a service that transforms network errors and machine failures into filled disks.” Replace “broker” with “queue” and I agree with this statement. This is really describing systems like RabbitMQ, Amazon SQS, TIBCO EMS, IronMQ, and maybe even Kafka fits into that category.

People are easily seduced by “fat” middleware—systems with more features, more capabilities, more responsibilities—because they think it makes their lives easier, and it might at first. Pushing off more responsibility onto the infrastructure makes the application simpler, but it also makes the infrastructure more complex, more fragile, and more slow. Take exactly-once message delivery, for example. Lots of people want it, but the pursuit of it introduces a host of complexity, overhead (in terms of development, operations, and performance), and risk. The end result is something that, in addition to these things, requires all downstream systems to not introduce duplicates and be mindful about their side effects. That is, everything in the processing pipeline must be exactly-once or nothing is. So typically what you end up with is an approximation of exactly-once delivery. You make big investments to lower the likelihood of duplicates, but you still have to deal with the problem. This might make sense if the cost of having duplicates is high, but that doesn’t seem like the common case. My advice is to always opt for the simple solution. We tend to think of engineering challenges as technical problems when, in reality, they’re often just mindset problems. Usually the technical problems have already been solved if we can just adjust our mindset.

There are a couple things to keep in mind here. The first thing to consider is simply capability lock-in. As you push more and more logic off onto more and more specialized middleware, you make it harder to move off it or change things. The second is what we already hinted at. Even with smart middleware, problems still leak out and you have to handle them at the edge—you’re now being taxed twice. This is essentially the end-to-end argument. Push responsibility to the edges, smart endpoints, dumb pipes, etc. It’s the idea that if you need business-level guarantees, build them into the business layer because the infrastructure doesn’t care about them.

The article suggests for short-lived tasks, use a load balancer because with a queue, you’ll end up building a load balancer along with an ad-hoc RPC system, with extra latency. For long-lived tasks, use a database because with a queue, you’ll be building a lock manager, a database, and a scheduler.

A persistent message queue is not bad in itself, but relying on it for recovery, and by extension, correct behaviour, is fraught with peril.

So why the distinction between message brokers and message queues? The point is not all message brokers need to be large, complicated pieces of infrastructure like most message queues tend to be. This was the reason I gravitated towards NATS while architecting Workiva’s messaging platform and why last month I joined Apcera to work on NATS full time.

When Derek Collison originally wrote NATS it was largely for the reasons stated in the article and for the reasonstalk about frequently. It was out of frustration with the current state of the art. In my opinion, NATS was the first system in the space that really turned the way we did messaging on its head (outside of maybe ZeroMQ). It didn’t provide any strong delivery guarantees, transactions, message persistence, or other responsibilities usually assumed by message brokers (there is a layer that provides some of these things, but it’s not baked into the core technology). Instead, NATS prioritized availability, simplicity, and performance over everything else. A simple technology in a vast sea of complexity (my marketing game is strong).

NATS is no-frills pub/sub. It solves the problem of service discovery and work assignment, assumes no other responsibilities, and gets out of your way. It’s designed to be easy to use, easy to operate, and add minimal latency even at scale so that, unlike many other brokers, it is a good way to integrate your microservices. What makes NATS interesting is what it doesn’t do and what it gains by not doing them. Simplicity is a feature—the ultimate sophistication, according to da Vinci. I call it looking at the negative space.

The article reads:

A protocol is the rules and expectations of participants in a system, and how they are beholden to each other. A protocol defines who takes responsibility for failure.

The problem with message brokers, and queues, is that no-one does.

NATS plays to the strengths of the end-to-end principle. It’s a dumb pipe. Handle failures and retries at the client and NATS will do everything it can to remain available and fast. Don’t rely on fragile guarantees or semantics. Instead, face complexity head-on. The author states what you really want is request/reply, which is one point I disagree on. RPC is a bad abstraction for building distributed systems. Use simple, versatile primitives and embrace asynchrony and messaging.

So yes, be careful about relying on message brokers. How smart should the pipes really be? More to the point, be careful about relying on strong semantics because experience shows few things are guaranteed when working with distributed systems at scale. Err to the side of simple. Make few assumptions of your middleware. Push work out of your infrastructure and to the edges if you care about performance and scalability because nothing is harder to scale (or operate) than slow infrastructure that tries to do too much.

Benchmarking Commit Logs

In this article, we look at Apache Kafka and NATS Streaming, two messaging systems based on the idea of a commit log. We’ll compare some of the features of both but spend less time talking about Kafka since by now it’s quite well known. Similar to previous studies, we’ll attempt to quantify their general performance characteristics through careful benchmarking.

The purpose of this benchmark is to test drive the newly released NATS Streaming system, which was made generally available just in the last few months. NATS Streaming doesn’t yet support clustering, so we try to put its performance into context by looking at a similar configuration of Kafka.

Unlike conventional message queues, commit logs are an append-only data structure. This results in several nice properties like total ordering of messages, at-least-once delivery, and message-replay semantics. Jay Kreps’ blog post The Log is a great introduction to the concept and particularly why it’s so useful in the context of distributed systems and stream processing (his book I Heart Logs is an extended version of the blog post and is a quick read).

Kafka, which originated at LinkedIn, is by far the most popular and most mature implementation of the commit log (AWS offers their own flavor of it called Kinesis, and imitation is the sincerest form of flattery). It’s billed as a “distributed streaming platform for building real-time data pipelines and streaming apps.” The much newer NATS Streaming is actually a data-streaming layer built on top of Apcera’s high-performance publish-subscribe system NATS. It’s billed as “real-time streaming for Big Data, IoT, Mobile, and Cloud Native Applications.” Both have some similarities as well as some key differences.

Fundamental to the notion of a log is a way to globally order events. Neither NATS Streaming nor Kafka are actually a single log but many logs, each totally ordered using a sequence number or offset, respectively.

In Kafka, topics are partitioned into multiple logs which are then replicated across a number of servers for fault tolerance, making it a distributed commit log. Each partition has a server that acts as the leader. Cluster membership and leader election is managed by ZooKeeper.

NATS Streaming’s topics are called “channels” which are globally ordered. Unlike Kafka, NATS Streaming does not support replication or partitioning of channels, though my understanding is clustering support is slated for Q1 2017. Its message store is pluggable, so it can provide durability using a file-backed implementation, like Kafka, or simply an in-memory store.

NATS Streaming is closer to a hybrid of traditional message queues and the commit log. Like Kafka, it allows replaying the log from a specific offset, the beginning of time, or the newest offset, but it also exposes an API for reading from the log at a specific physical time offset, e.g. all messages from the last 30 seconds. Kafka, on the other hand, only has a notion of logical offsets (correction: Kafka added support for offset lookup by timestamp in 0.10.1.0) . Generally, relying on physical time is an anti-pattern in distributed systems due to clock drift and the fact that clocks are not always monotonic. For example, imagine a situation where a NATS Streaming server is restarted and the clock is changed. Messages are still ordered by their sequence numbers but their timestamps might not reflect that. Developers would need to be aware of this while implementing their business logic.

With Kafka, it’s strictly on consumers to track their offset into the log (or the high-level consumer which stores offsets in ZooKeeper (correction: Kafka itself can now store offsets which is used by the new Consumer API, meaning clients do not have to manage offsets directly or rely on ZooKeeper)). NATS Streaming allows clients to either track their sequence number or use a durable subscription, which causes the server to track the last acknowledged message for a client. If the client restarts, the server will resume delivery starting at the earliest unacknowledged message. This is closer to what you would expect from a traditional message-oriented middleware like RabbitMQ.

Lastly, NATS Streaming supports publisher and subscriber rate limiting. This works by configuring the maximum number of in-flight (unacknowledged) messages either from the publisher to the server or from the server to the subscriber. Starting in version 0.9, Kafka supports a similar rate limiting feature that allows producer and consumer byte-rate thresholds to be defined for groups of clients with its Quotas protocol.

Kafka was designed to avoid tracking any client state on the server for performance and scalability reasons. Throughput and storage capacity scale linearly with the number of nodes. NATS Streaming provides some additional features over Kafka at the cost of some added state on the server. Since clustering isn’t supported, there isn’t really any scale or HA story yet, so it’s unclear how that will play out. That said, once replication is supported, there’s a lot of work going into verifying its correctness (which is a major advantage Kafka has).

Benchmarks

Since NATS Streaming does not support replication at this time (0.3.1), we’ll compare running a single instance of it with file-backed persistence to running a single instance of Kafka (0.10.1.0). We’ll look at both latency and throughput running on commodity hardware (m4.xlarge EC2 instances) with load generation and consumption each running on separate instances. In all of these benchmarks, the systems under test have not been tuned at all and are essentially in their “off-the-shelf” configurations.

We’ll first look at latency by publishing messages of various sizes, ranging from 256 bytes to 1MB, at a fixed rate of 50 messages/second for 30 seconds. Message contents are randomized to account for compression. We then plot the latency distribution by percentile on a logarithmic scale from the 0th percentile to the 99.9999th percentile. Benchmarks are run several times in an attempt to produce a “normalized” result. The benchmark code used is open source.

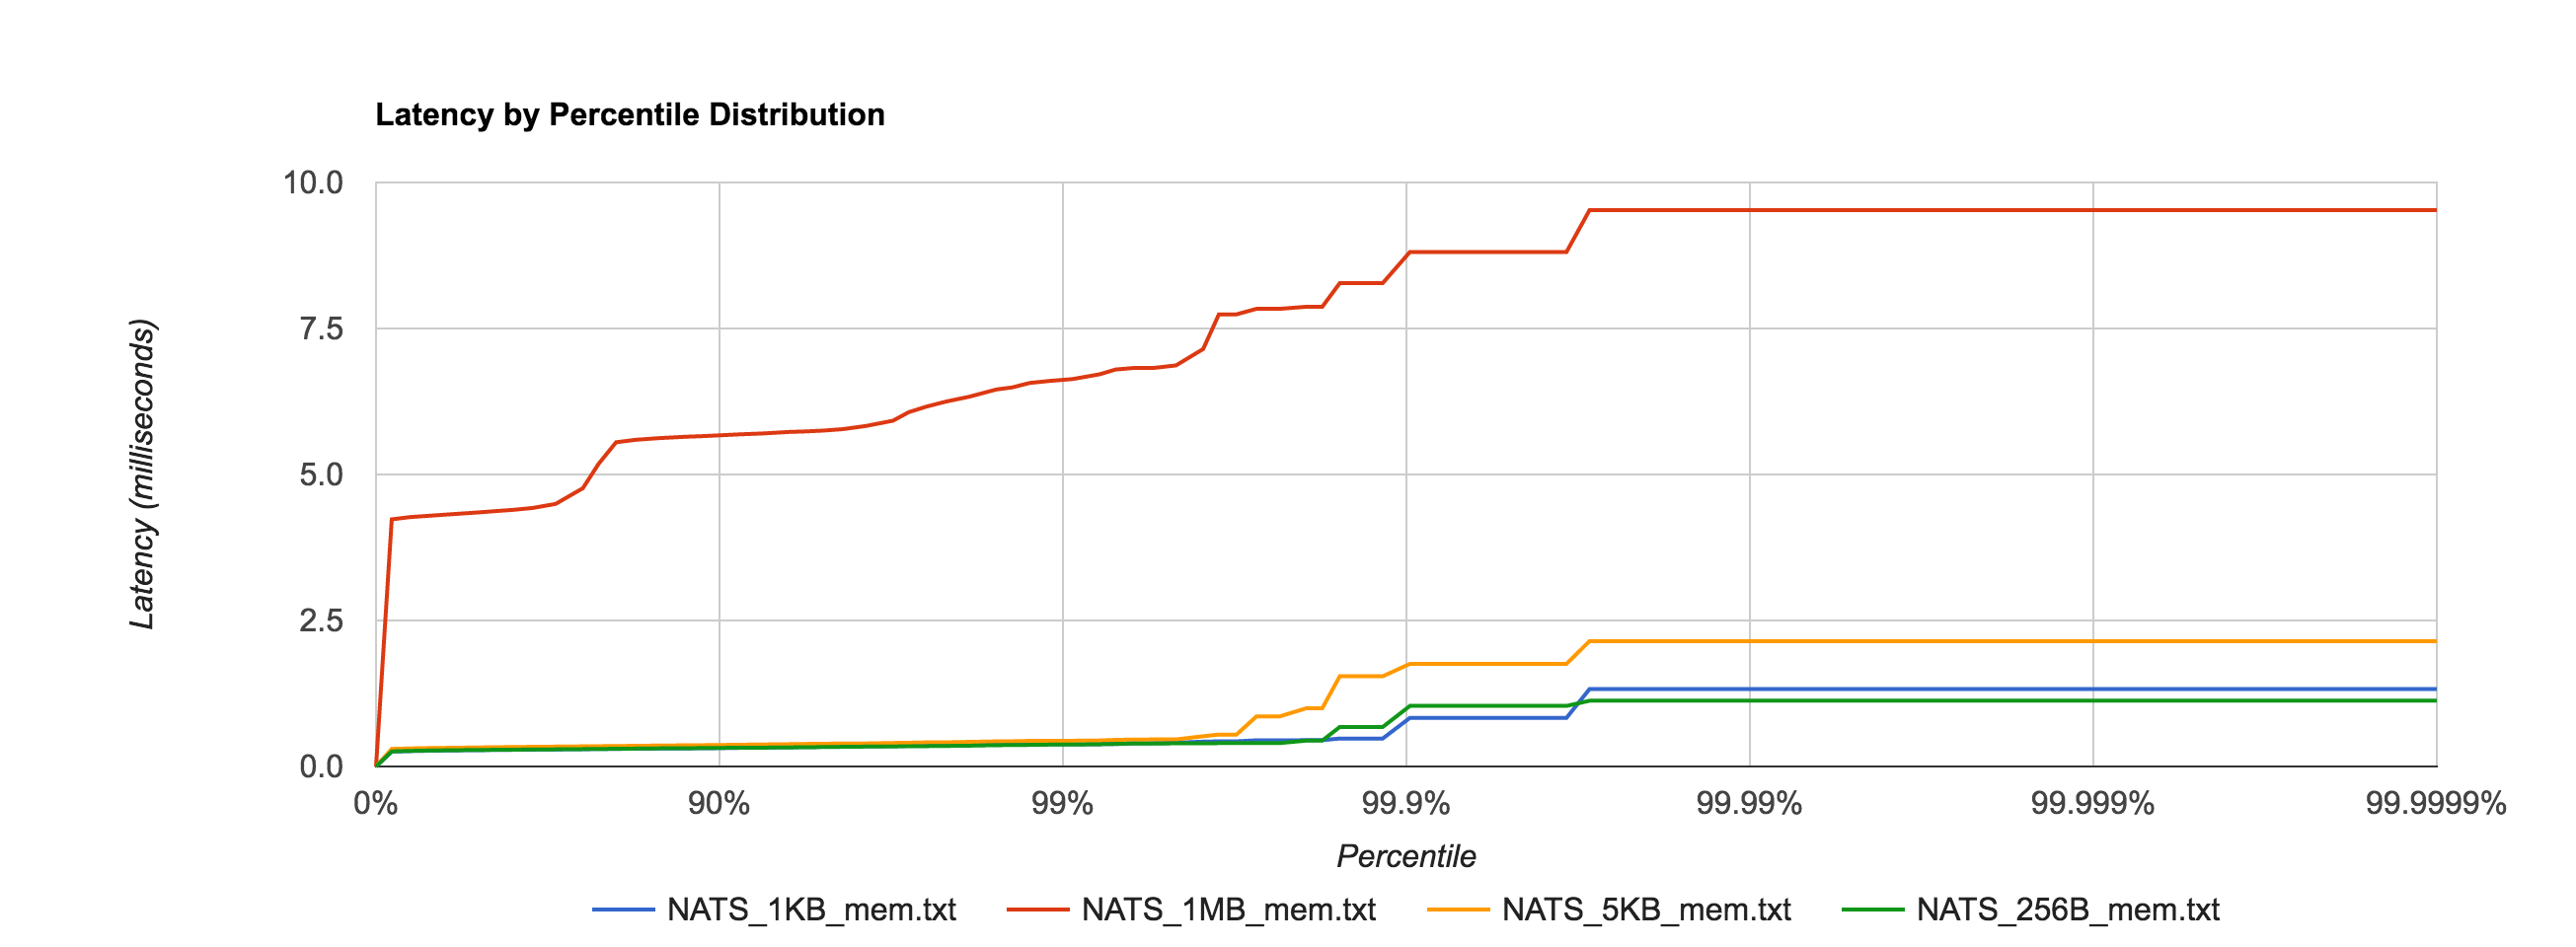
First, to establish a baseline and later get a feel for the overhead added by the file system, we’ll benchmark NATS Streaming with in-memory storage, meaning messages are not written to disk.

Unsurprisingly, the 1MB configuration has much higher latencies than the other configurations, but everything falls within single-digit-millisecond latencies.nats_mem

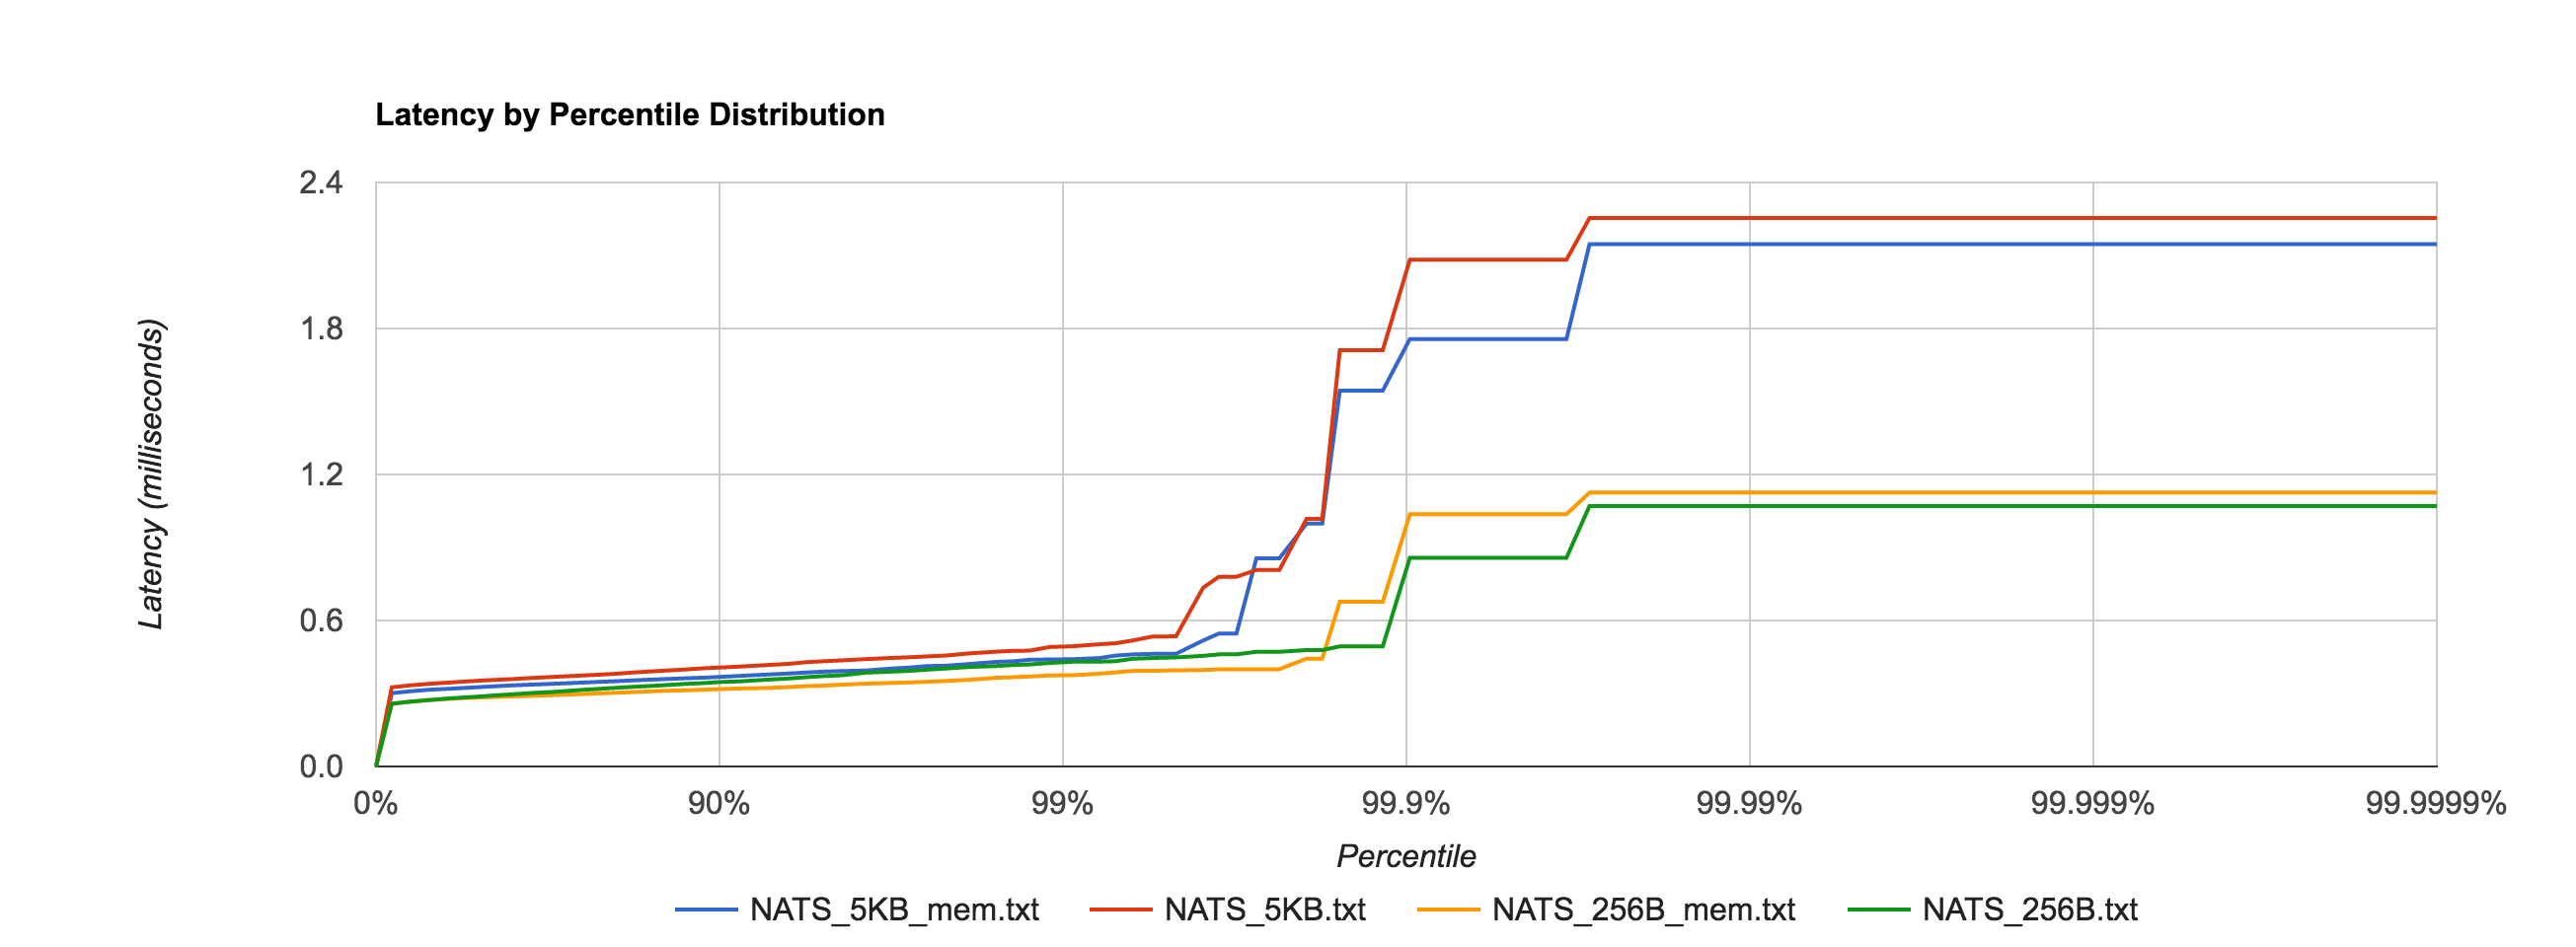
NATS Streaming 0.3.1 (in-memory persistence)

 Size 99% 99.9% 99.99% 99.999% 99.9999% 
256B 0.3750ms 1.0367ms 1.1257ms 1.1257ms 1.1257ms
1KB 0.38064ms 0.8321ms 1.3260ms 1.3260ms 1.3260ms
5KB 0.4408ms 1.7569ms 2.1465ms 2.1465ms 2.1465ms
1MB 6.6337ms 8.8097ms 9.5263ms 9.5263ms 9.5263ms

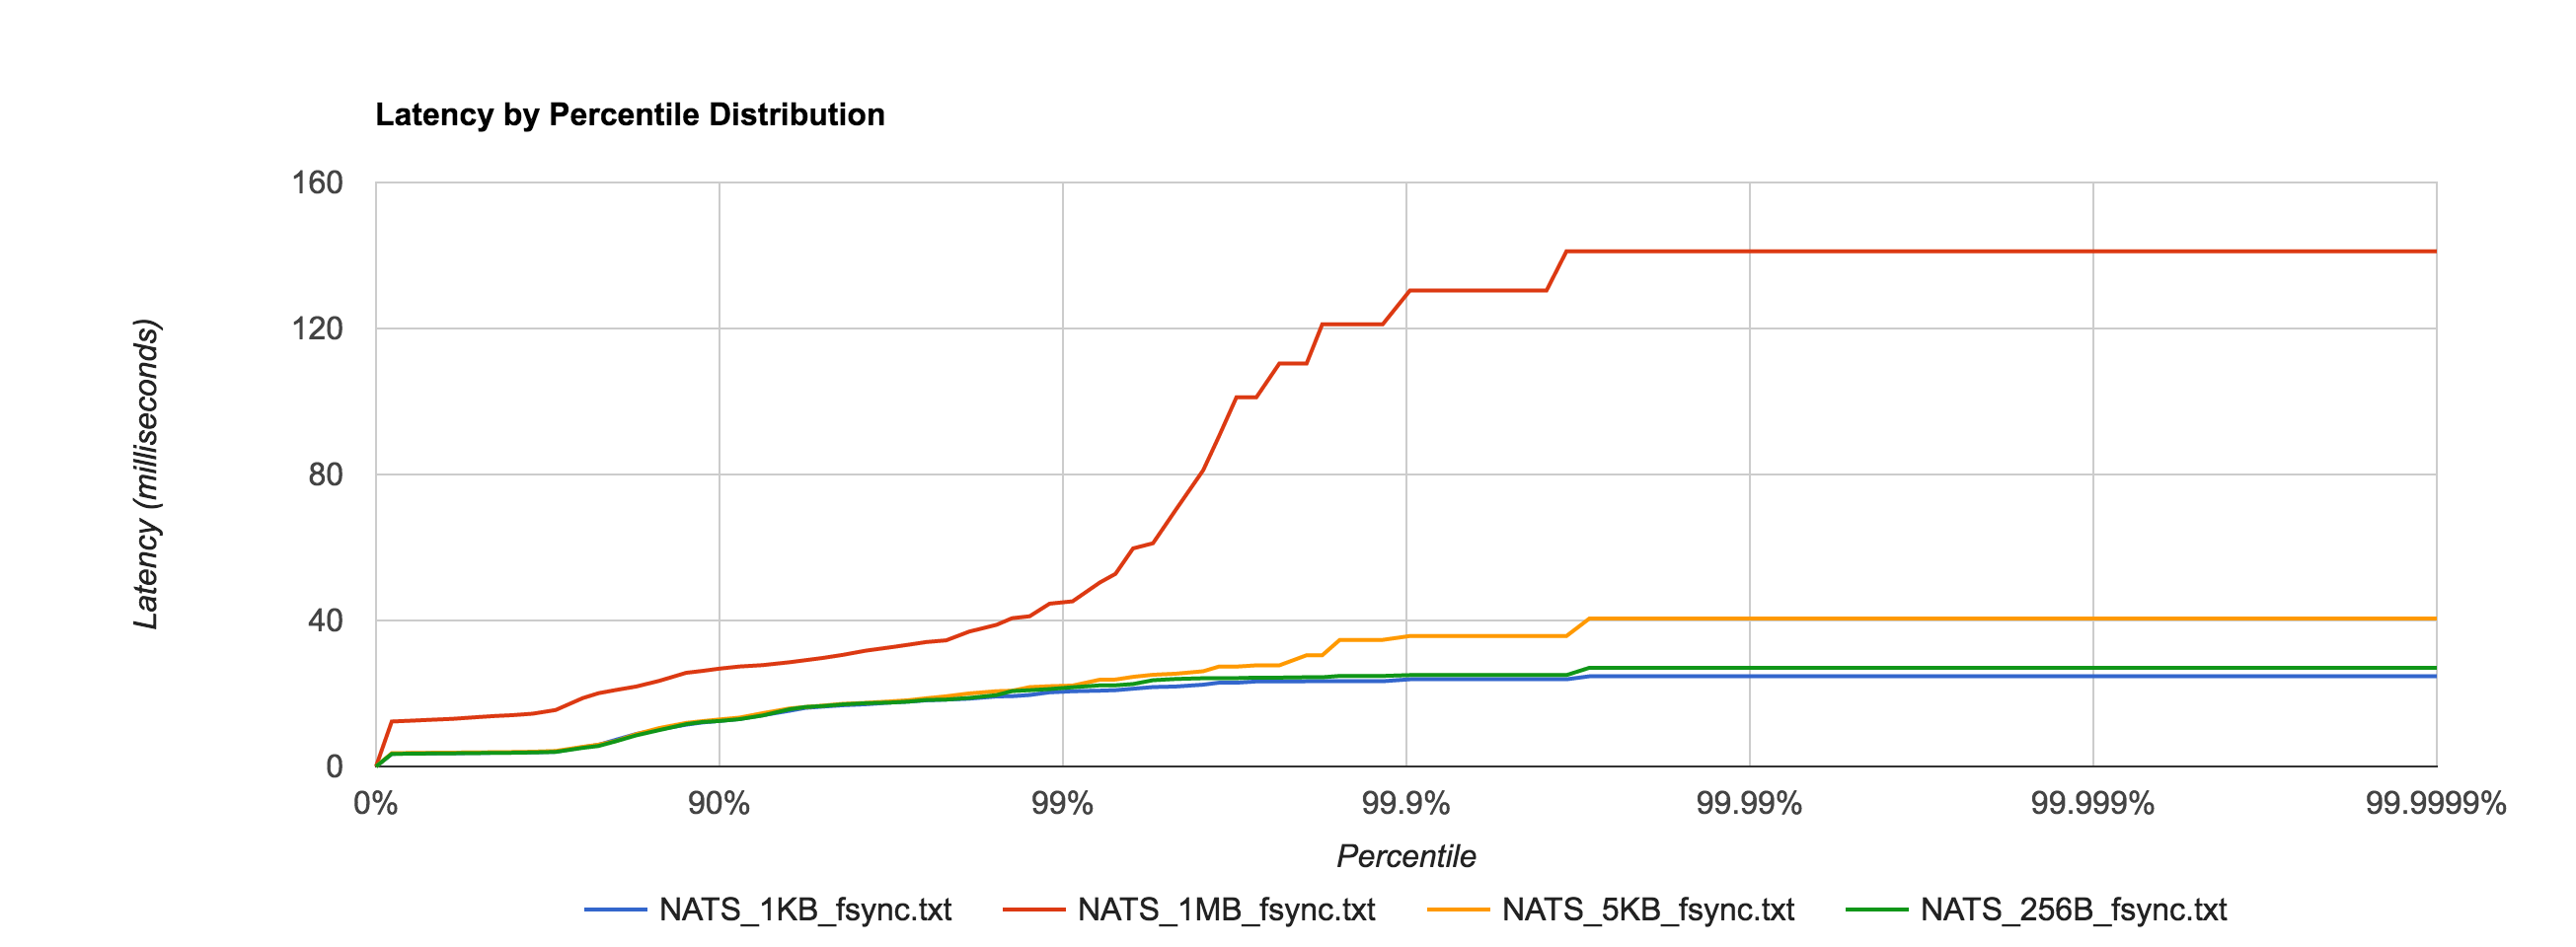
Next, we look at NATS Streaming with file-backed persistence. This provides the same durability guarantees as Kafka running with a replication factor of 1. By default, Kafka stores logs under /tmp. Many Unix distributions mount /tmp to tmpfs which appears as a mounted file system but is actually stored in volatile memory. To account for this and provide as level a playing field as possible, we configure NATS Streaming to also store its logs in /tmp.

As expected, latencies increase by about an order of magnitude once we start going to disk.

nats_file_fsync

NATS Streaming 0.3.1 (file-backed persistence)

 Size 99% 99.9% 99.99% 99.999% 99.9999% 
256B 21.7051ms 25.0369ms 27.0524ms 27.0524ms 27.0524ms
1KB 20.6090ms 23.8858ms 24.7124ms 24.7124ms 24.7124ms
5KB 22.1692ms 35.7394ms 40.5612ms 40.5612ms 40.5612ms
1MB 45.2490ms 130.3972ms 141.1564ms 141.1564ms 141.1564ms

Since we will be looking at Kafka, there is an important thing to consider relating to fsync behavior. As of version 0.8, Kafka does not call fsync directly and instead relies entirely on the background flush performed by the OS. This is clearly indicated by their documentation:

We recommend using the default flush settings which disable application fsync entirely. This means relying on the background flush done by the OS and Kafka’s own background flush. This provides the best of all worlds for most uses: no knobs to tune, great throughput and latency, and full recovery guarantees. We generally feel that the guarantees provided by replication are stronger than sync to local disk, however the paranoid still may prefer having both and application level fsync policies are still supported.

However, NATS Streaming calls fsync every time a batch is written to disk by default. This can be disabled through the use of the –file_sync flag. By setting this flag to false, we put NATS Streaming’s persistence behavior closer in line with Kafka’s (again assuming a replication factor of 1).

As an aside, the comparison between NATS Streaming and Kafka still isn’t completely “fair”. Jay Kreps points out that Kafka relies on replication as the primary means of durability.

Kafka leaves [fsync] off by default because it relies on replication not fsync for durability, which is generally faster. If you don’t have replication I think you probably need fsync and maybe some kind of high integrity file system.

I don’t think we can provide a truly fair comparison until NATS Streaming supports replication, at which point we will revisit this.

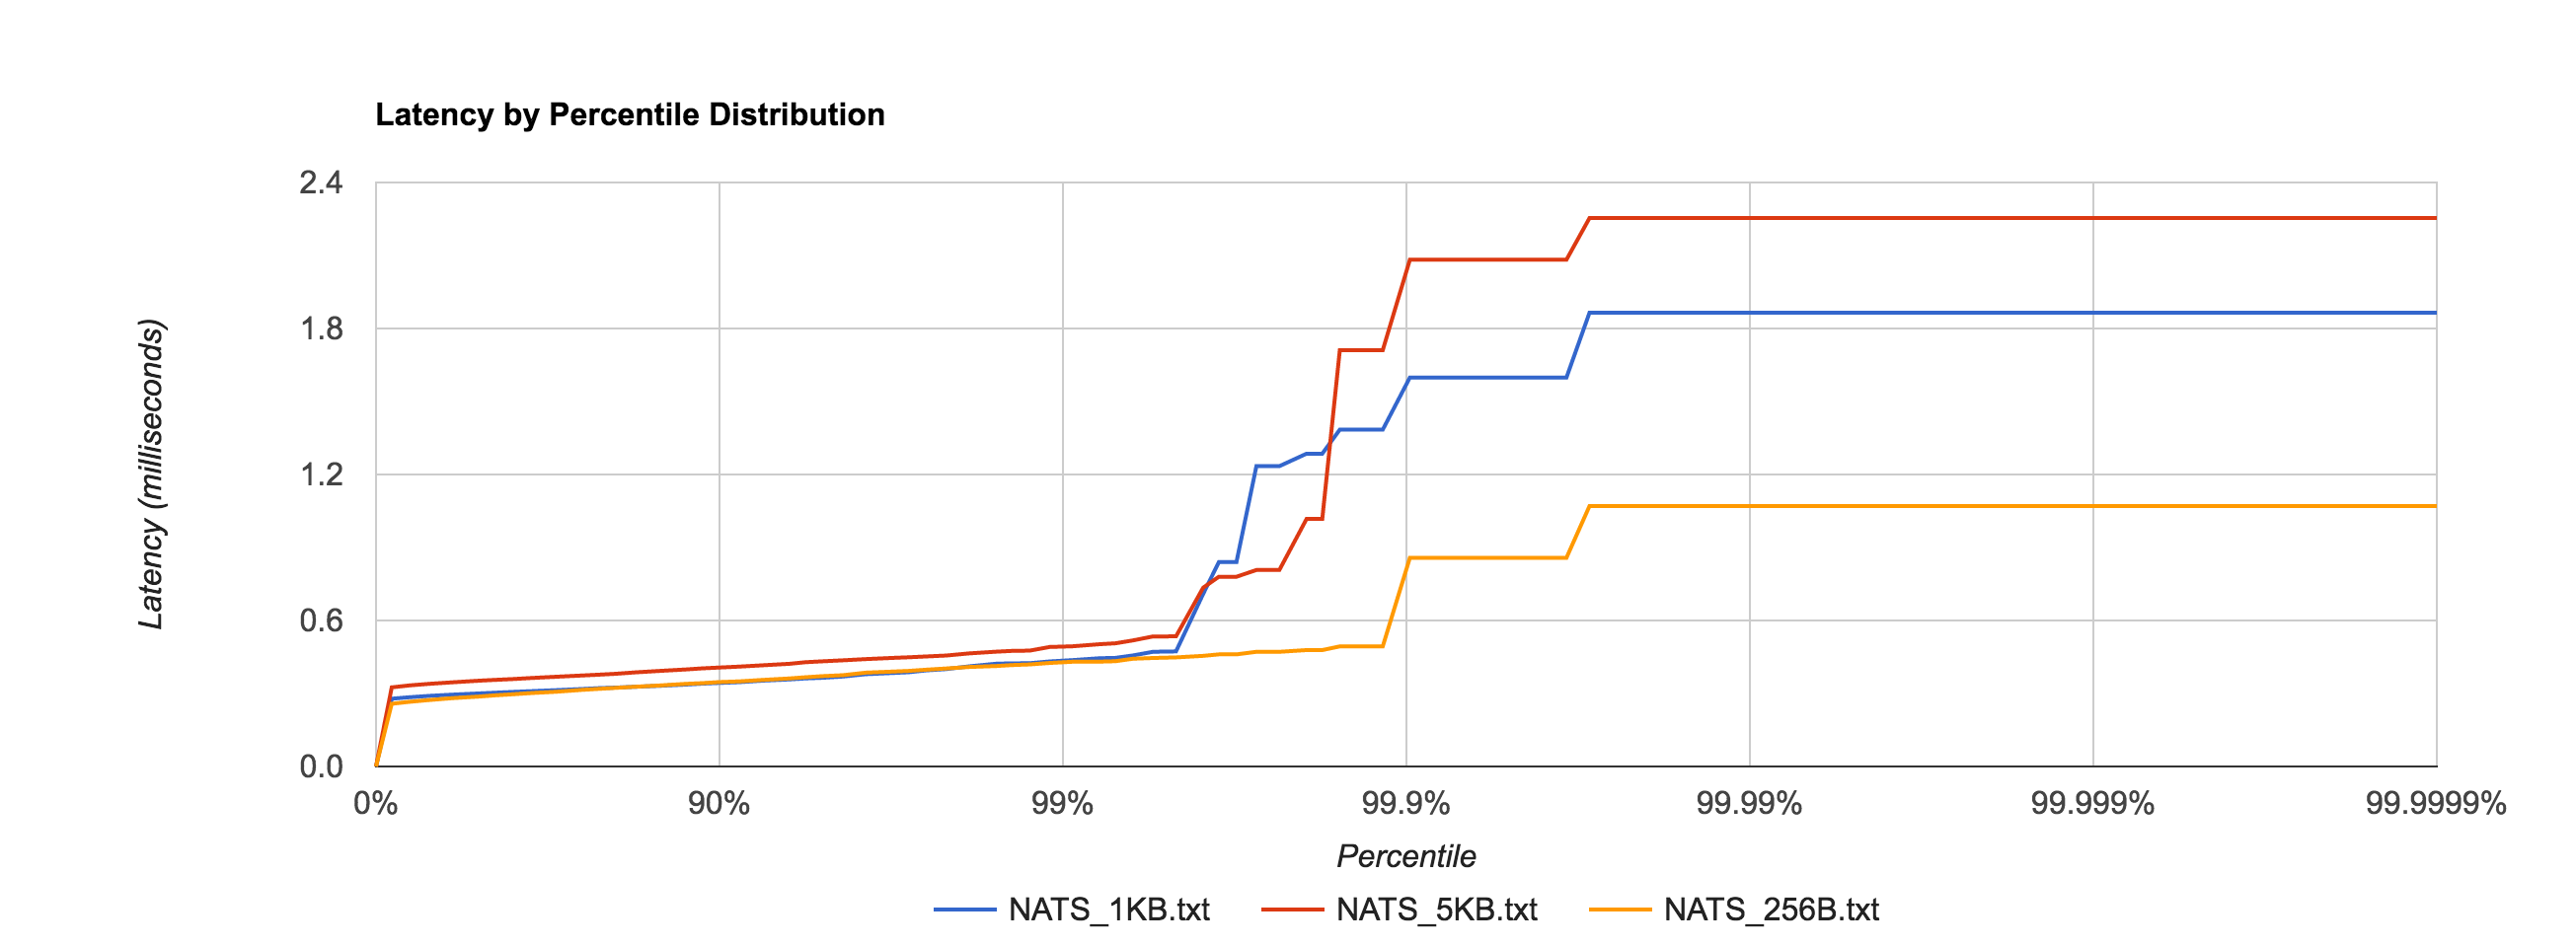
To no one’s surprise, setting –file_sync=false has a significant impact on latency, shown in the distribution below.

nats_file_no_fsync

In fact, it’s now in line with the in-memory performance as before for 256B, 1KB, and 5KB messages, shown in the comparison below.

nats_file_mem

For a reason I have yet to figure out, the latency for 1MB messages is roughly an order of magnitude faster when fsync is enabled after the 95th percentile, which seems counterintuitive. If anyone has an explanation, I would love to hear it. I’m sure there’s a good debug story there. The distribution below shows the 1MB configuration for NATS Streaming with and without fsync enabled and just how big the difference is at the 95th percentile and beyond.

nats_file_mem_1mb

NATS Streaming 0.3.1 (file-backed persistence, –file_sync=false)

 Size 99% 99.9% 99.99% 99.999% 99.9999% 
256B 0.4304ms 0.8577ms 1.0706ms 1.0706ms 1.0706ms
1KB 0.4372ms 1.5987ms 1.8651ms 1.8651ms 1.8651ms
5KB 0.4939ms 2.0828ms 2.2540ms 2.2540ms 2.2540ms
1MB 1296.1464ms 1556.1441ms 1596.1457ms 1596.1457ms 1596.1457ms

Kafka with replication factor 1 tends to have higher latencies than NATS Streaming with –file_sync=false. There was one potential caveat here Ivan Kozlovic pointed out to me in that NATS Streaming uses a caching optimization for reads that may put it at an advantage.

Now, there is one side where NATS Streaming *may* be looking better and not fair to Kafka. By default, the file store keeps everything in memory once stored. This means look-ups will be fast. There is only a all-or-nothing mode right now, which means either cache everything or nothing. With caching disabled (–file_cache=false), every lookup will result in disk access (which when you have 1 to many subscribers will be bad). I am working on changing that. But if you do notice that in Kafka, consuming results in a disk read (given the other default behavior described above, they actually may not ;-)., then you could disable NATS Streaming file caching.

Fortunately, we can verify if Kafka is actually going to disk to read messages back from the log during the benchmark using iostat. We see something like this for the majority of the benchmark duration:

avg-cpu:  %user   %nice %system %iowait  %steal   %idle
          13.53    0.00   11.28    0.00    0.00   75.19

Device:    tps   Blk_read/s   Blk_wrtn/s   Blk_read   Blk_wrtn
xvda      0.00         0.00         0.00          0          0

Specifically, we’re interested in Blk_read, which indicates the total number of blocks read. It appears that Kafka does indeed make heavy use of the operating system’s page cache as Blk_wrtn and Blk_read rarely show any activity throughout the entire benchmark. As such, it seems fair to leave NATS Streaming’s –file_cache=true, which is the default.

One interesting point is Kafka offloads much of its caching to the page cache and outside of the JVM heap, clearly in an effort to minimize GC pauses. I’m not clear if the cache Ivan refers to in NATS Streaming is off-heap or not (NATS Streaming is written in Go which, like Java, is a garbage-collected language).

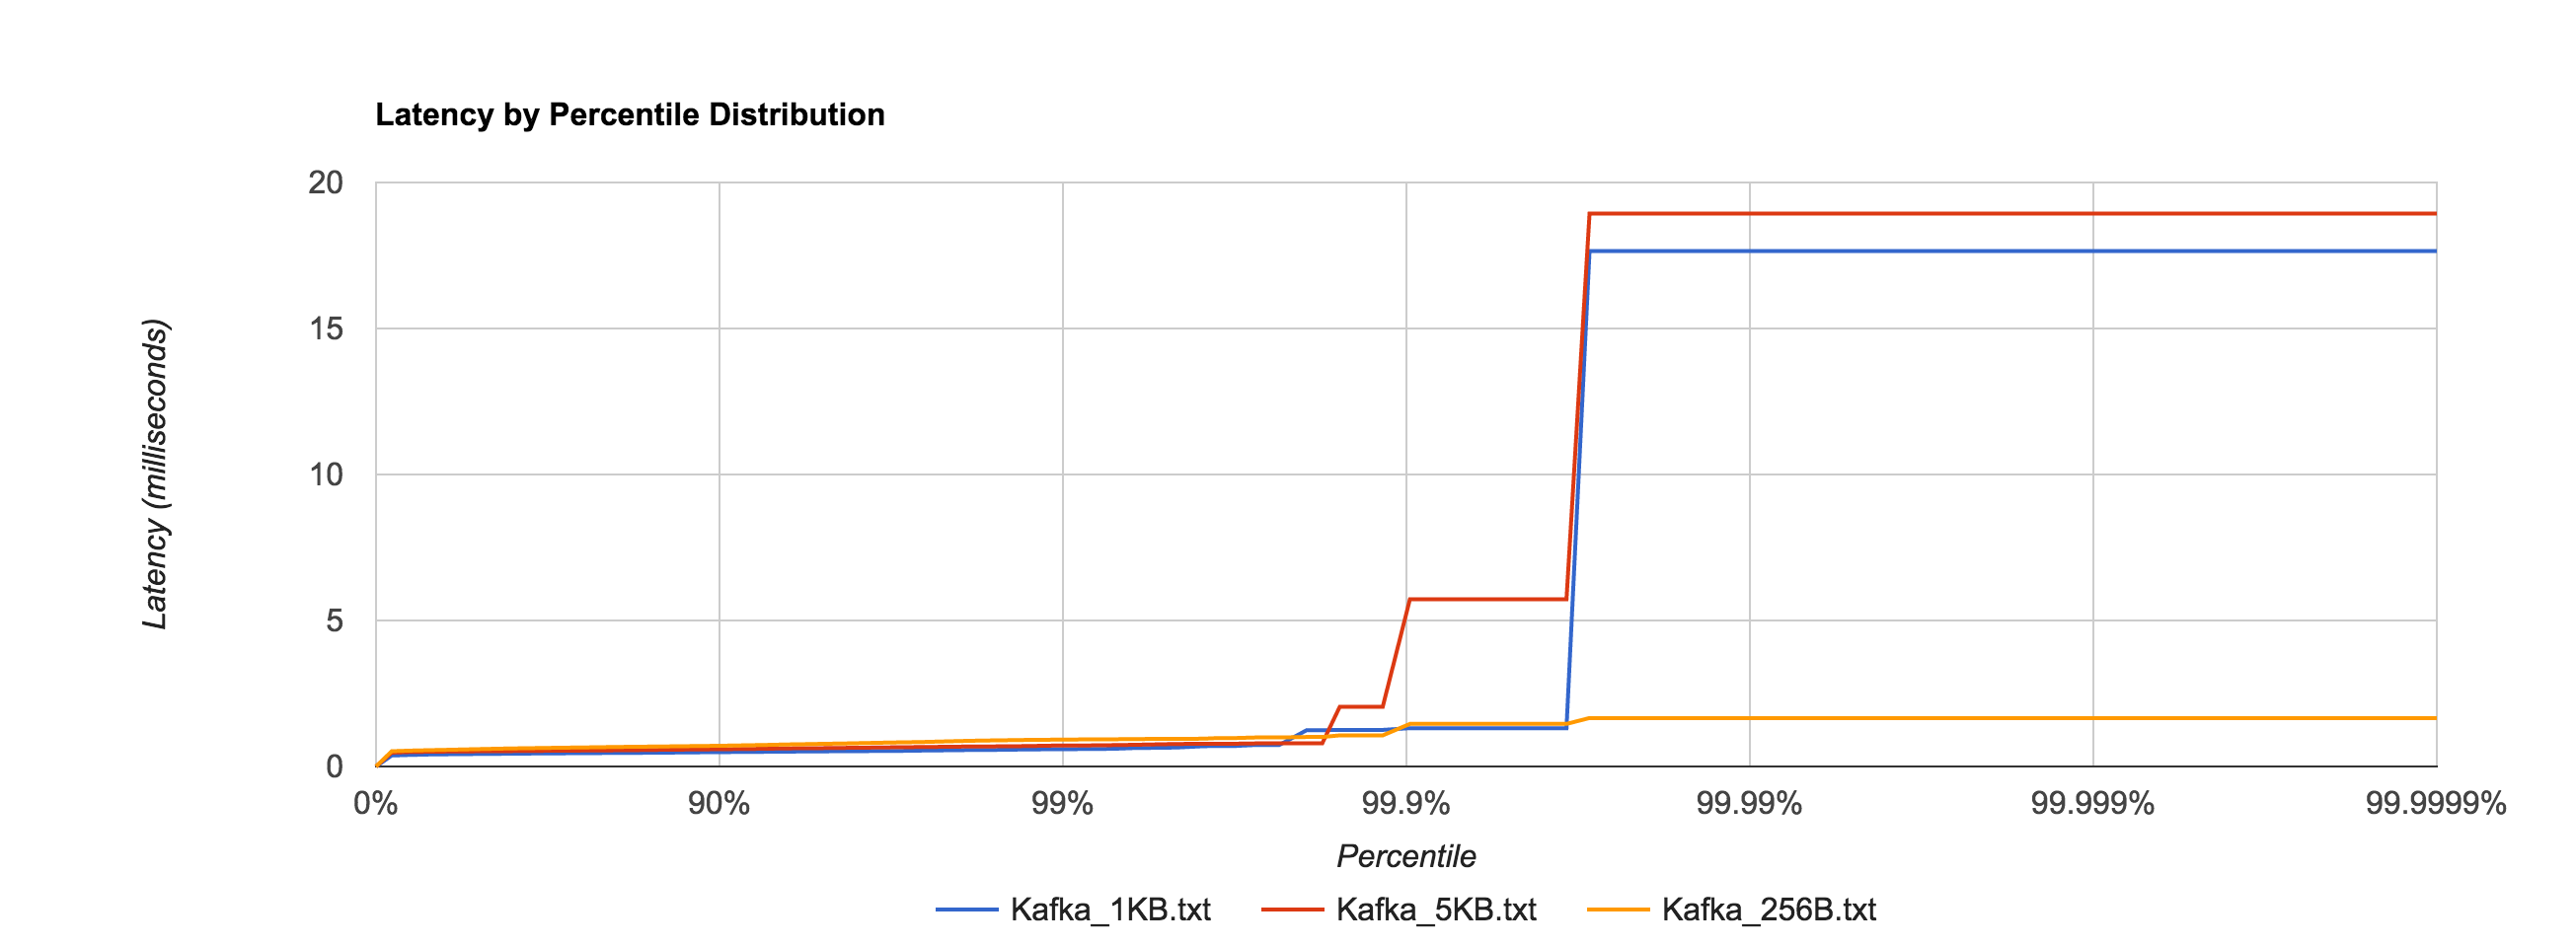
Below is the distribution of latencies for 256B, 1KB, and 5KB configurations in Kafka.

kafka

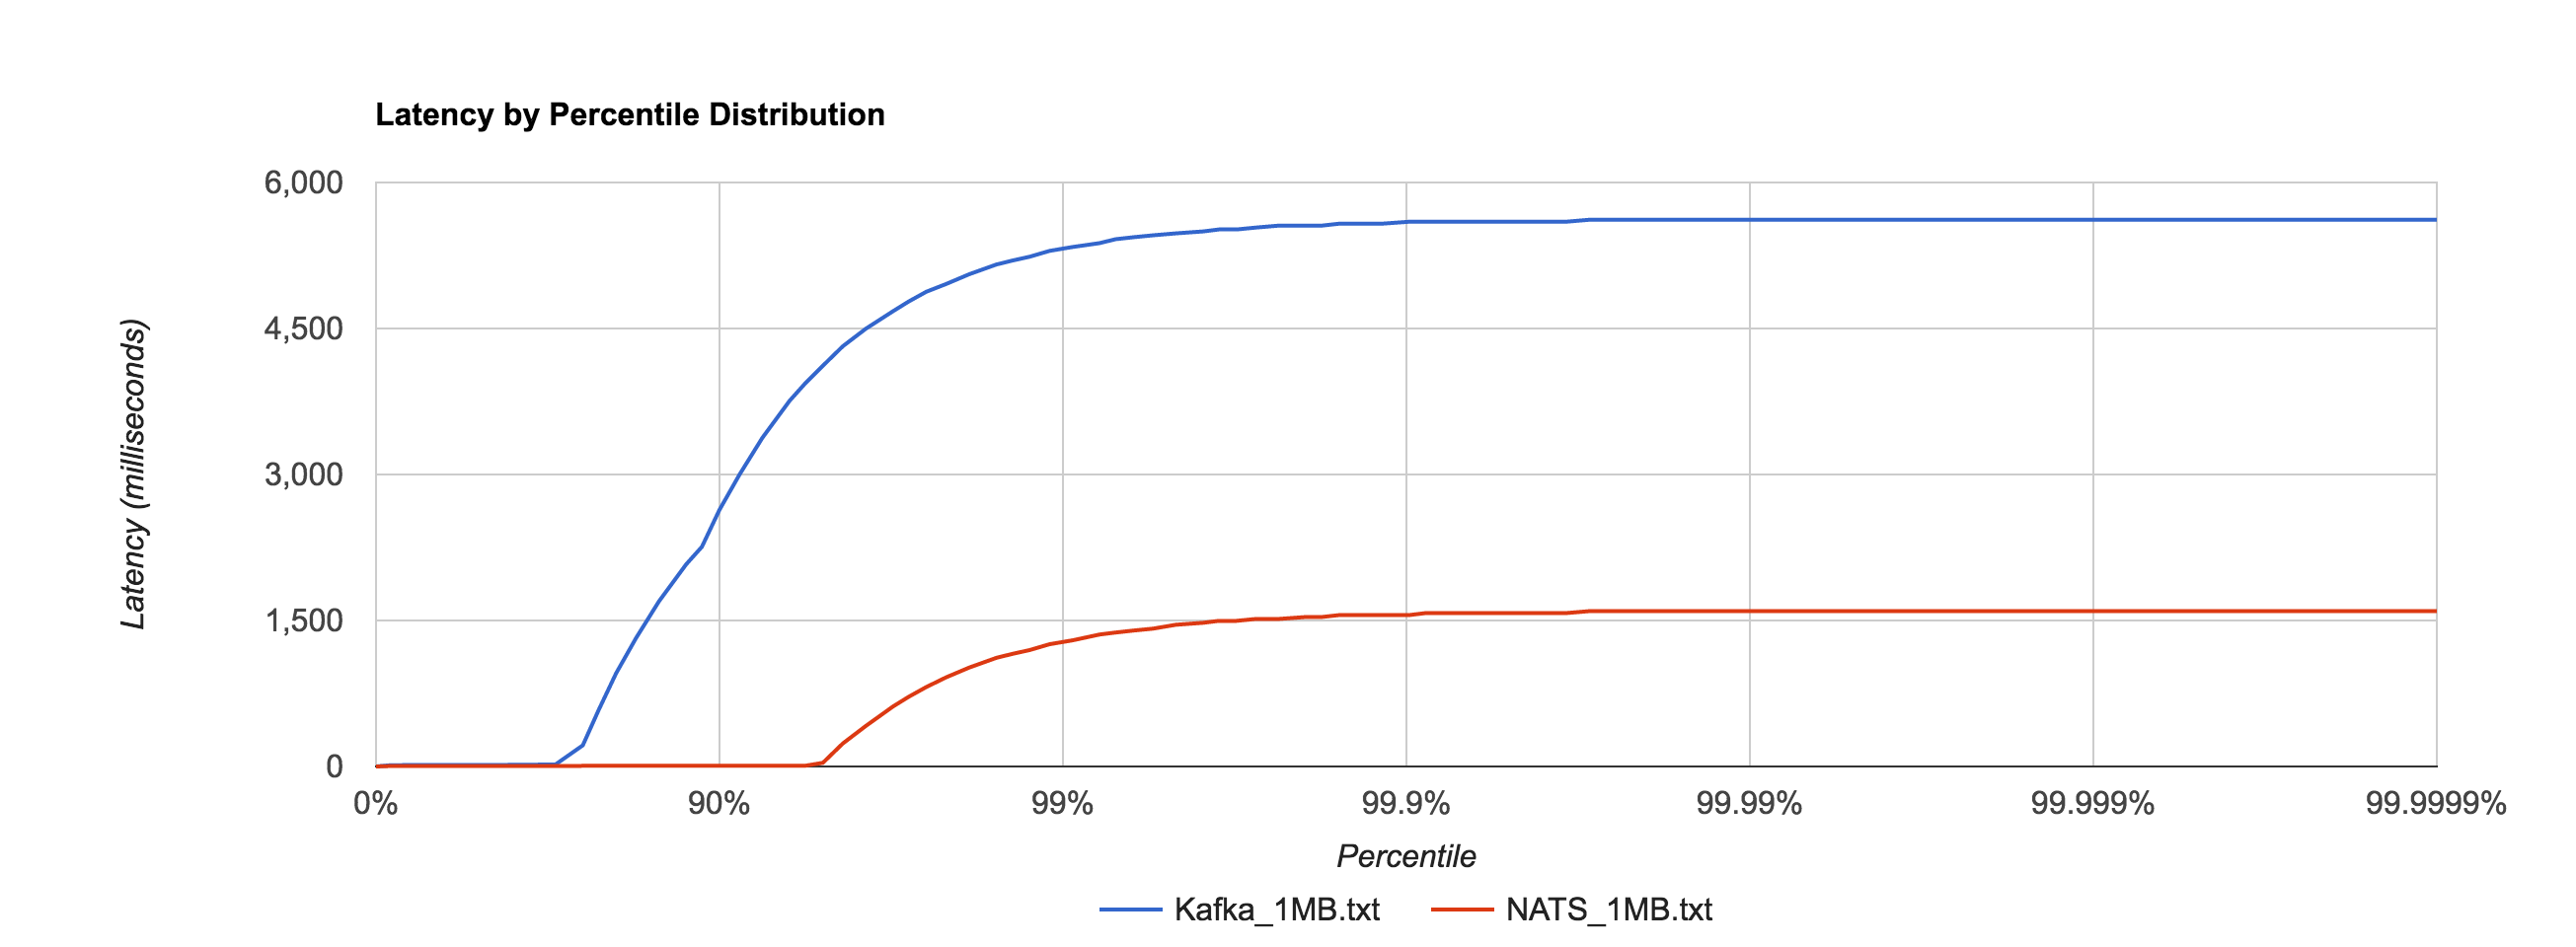
Similar to NATS Streaming, 1MB message latencies tend to be orders of magnitude worse after about the 80th percentile. The distribution below compares the 1MB configuration for NATS Streaming and Kafka.

nats_kafka_1mb

Kafka 0.10.1.0 (replication factor 1)

 Size 99% 99.9% 99.99% 99.999% 99.9999% 
256B 0.9230ms 1.4575ms 1.6596ms 1.6596ms 1.6596ms
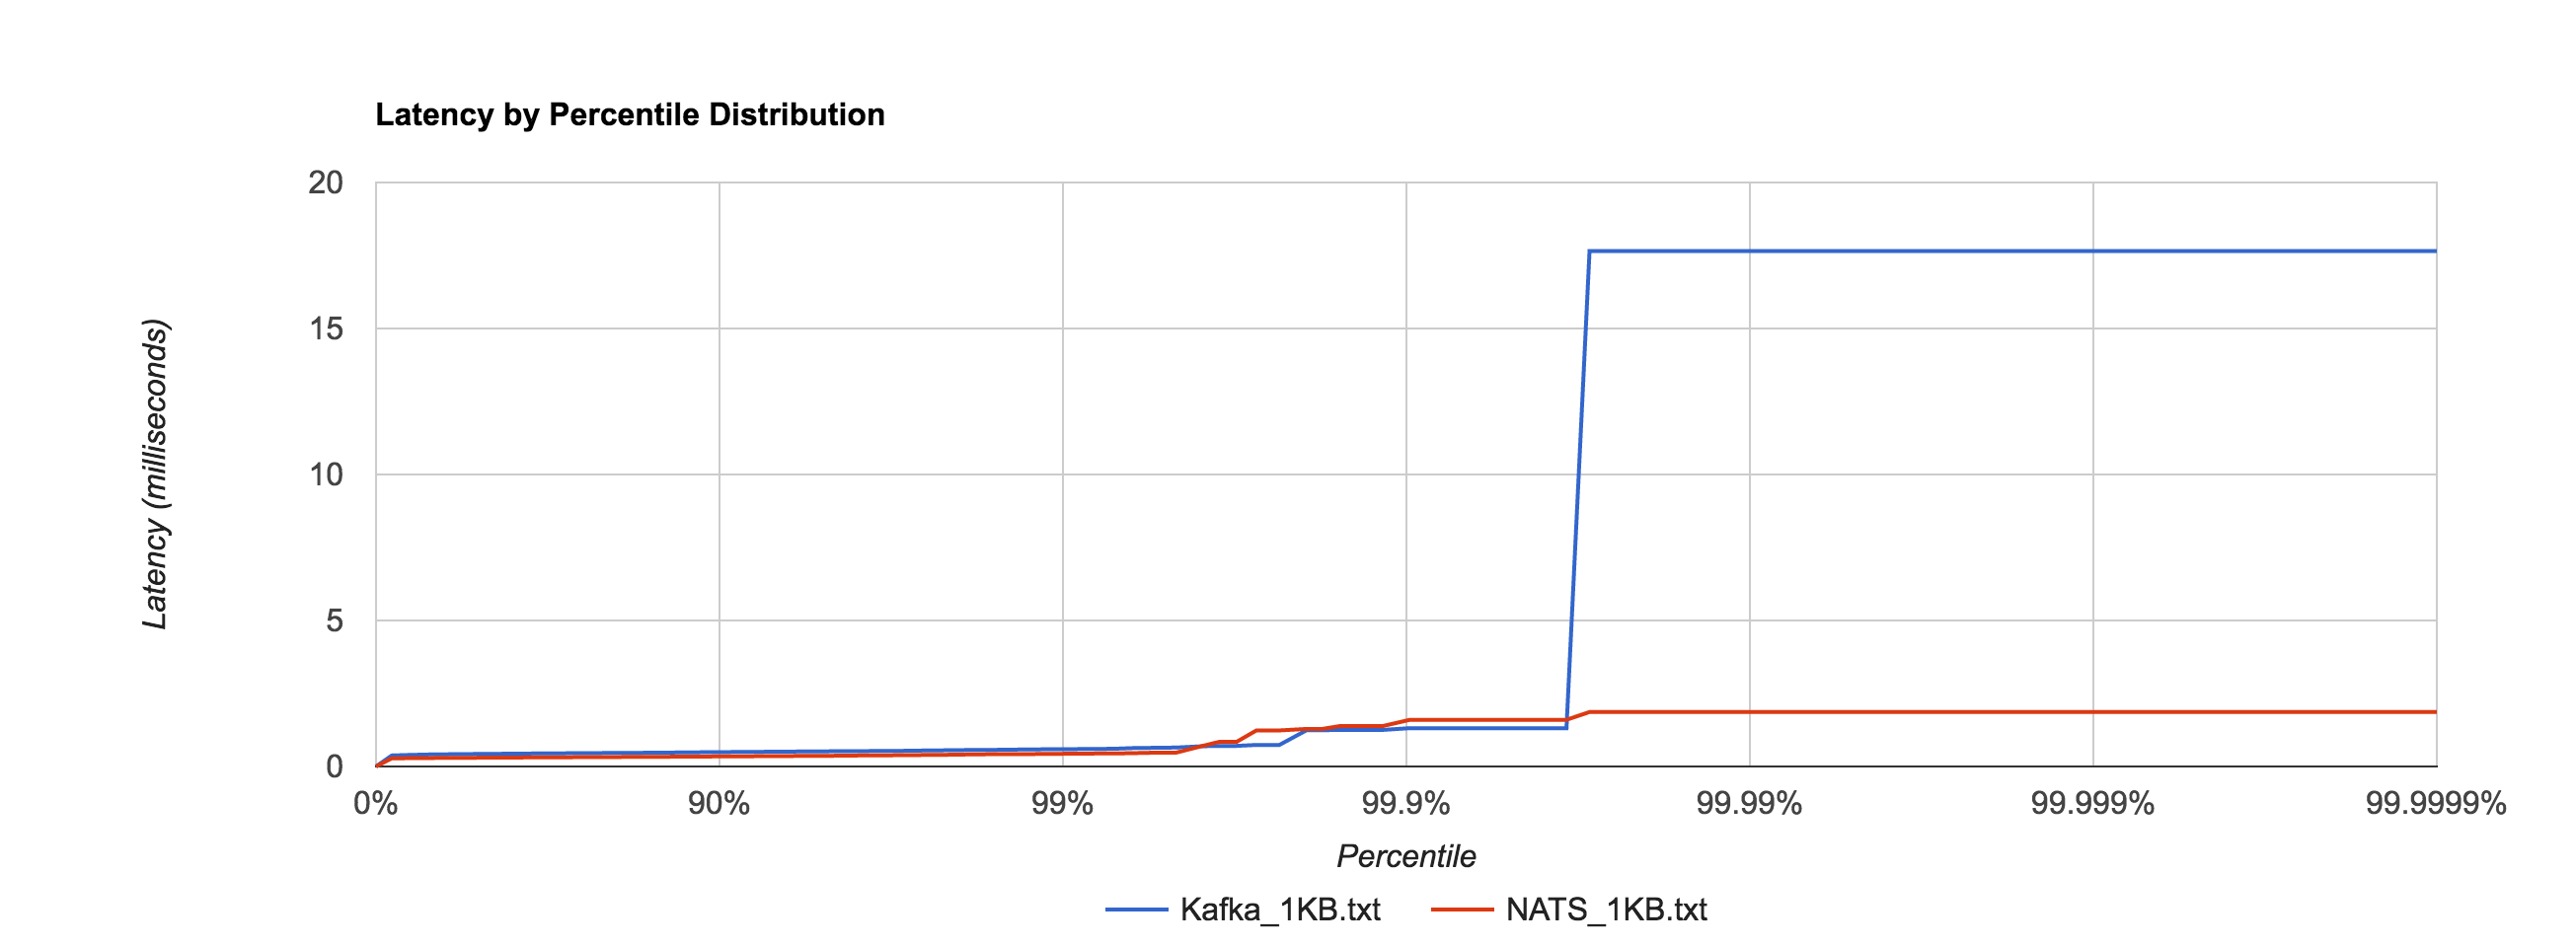
1KB 0.5942ms 1.3123ms 17.6556ms 17.6556ms 17.6556ms
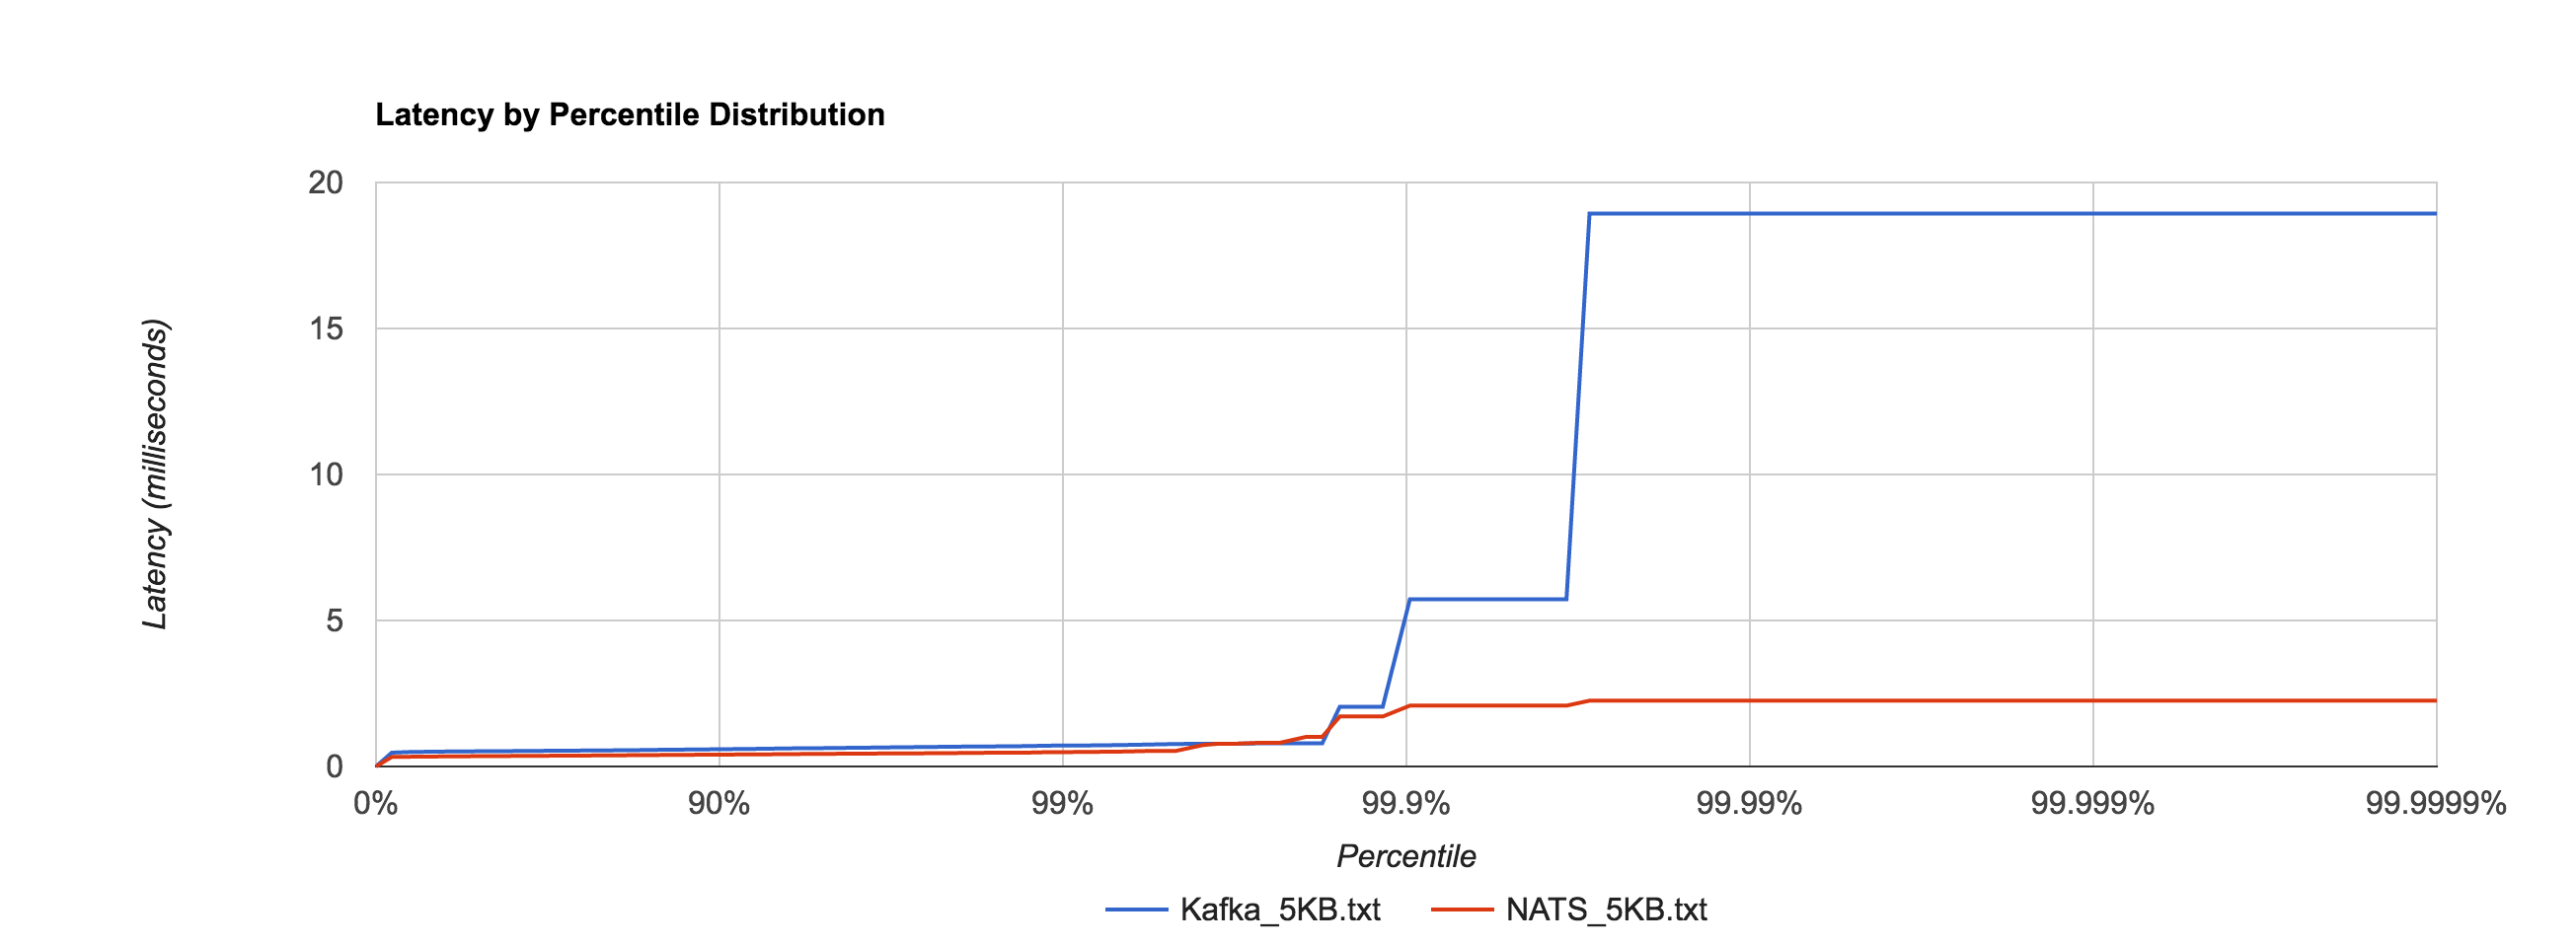
5KB 0.7203ms 5.7236ms 18.9334ms 18.9334ms 18.9334ms
1MB 5337.3174ms 5597.3315ms 5617.3199ms 5617.3199ms 5617.3199ms

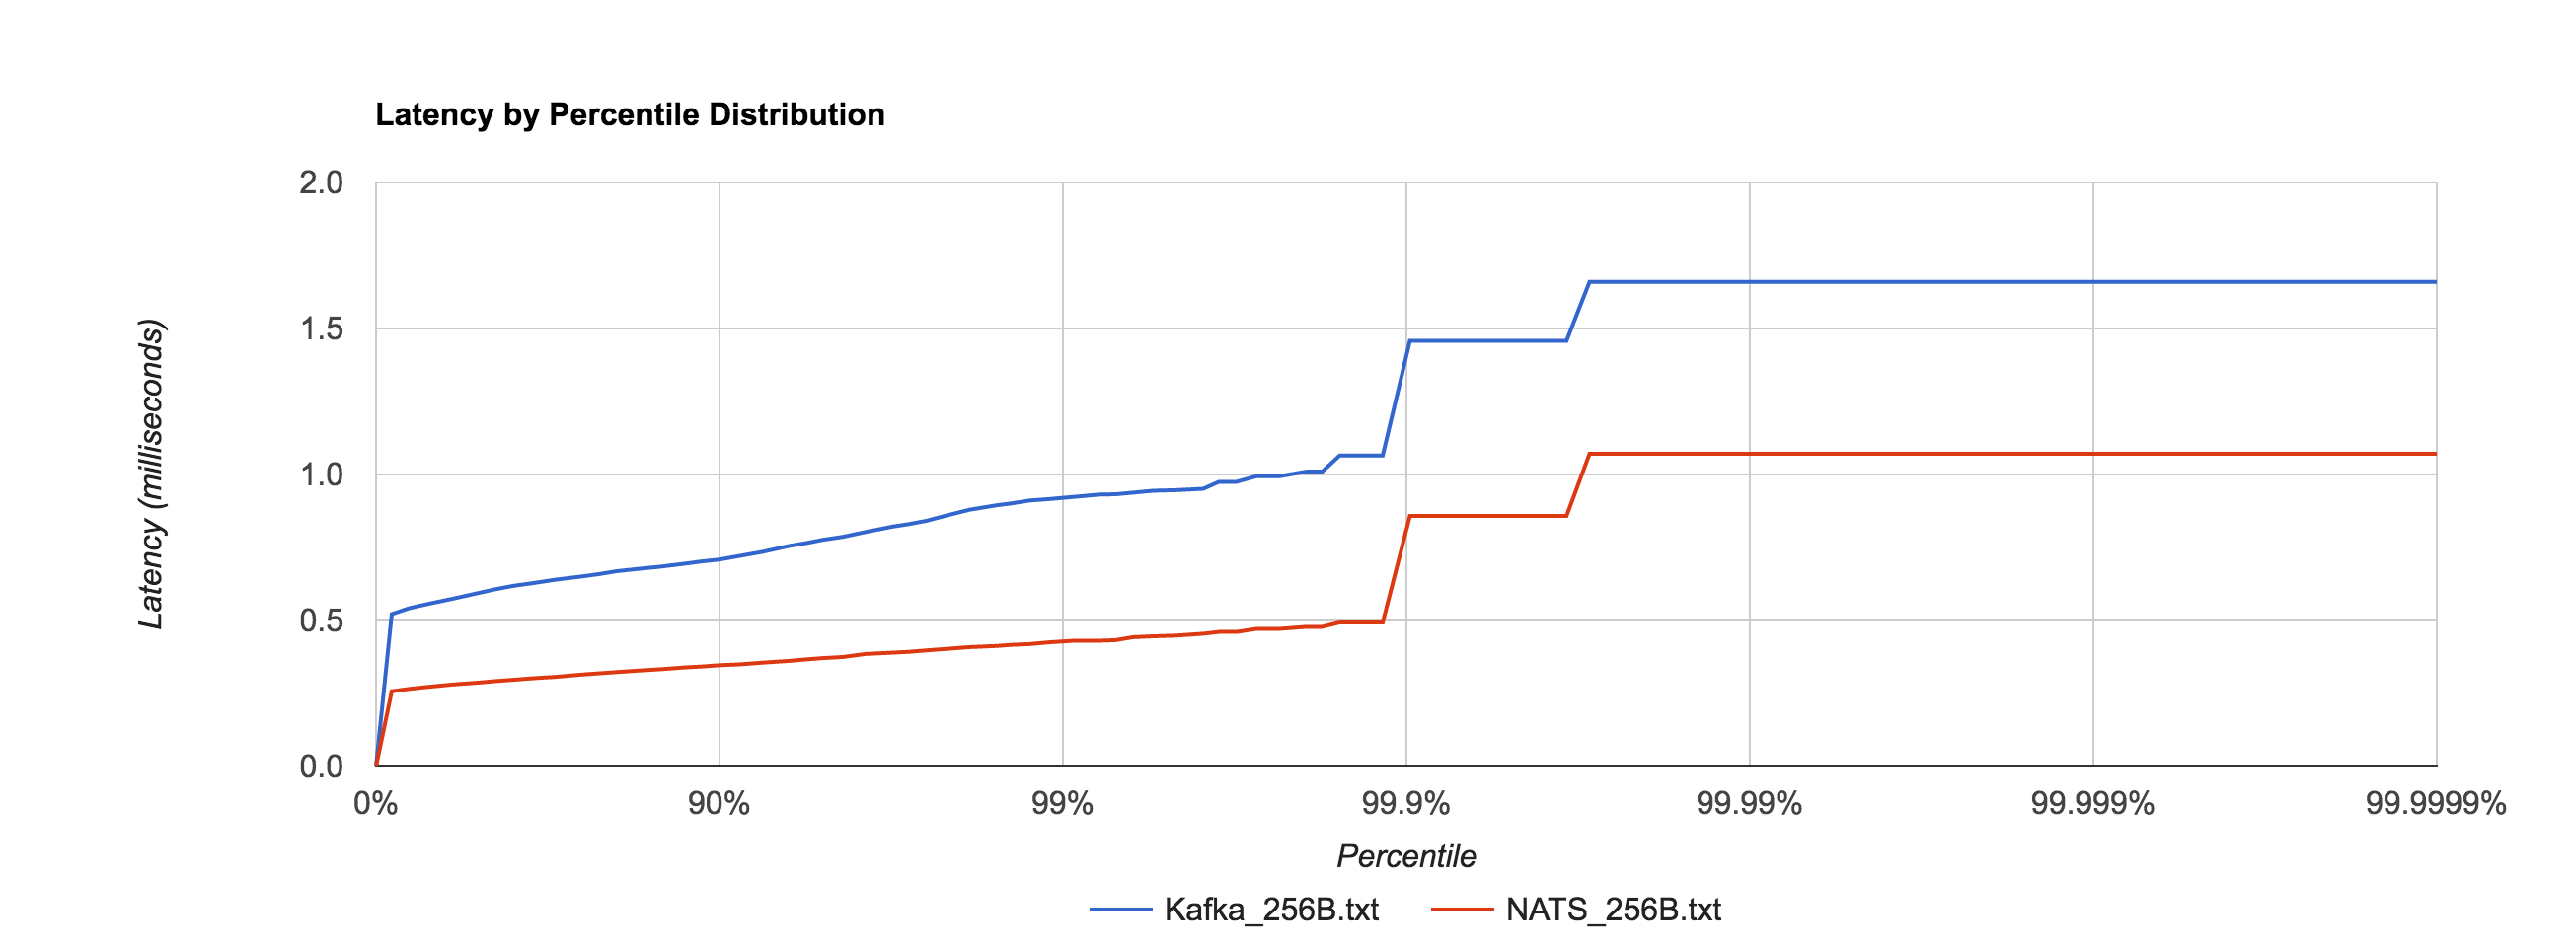
The percentile distributions below compare NATS Streaming and Kafka for the 256B, 1KB, and 5KB configurations, respectively.

nats_kafka_256b

nats_kafka_1kb

nats_kafka_5kb

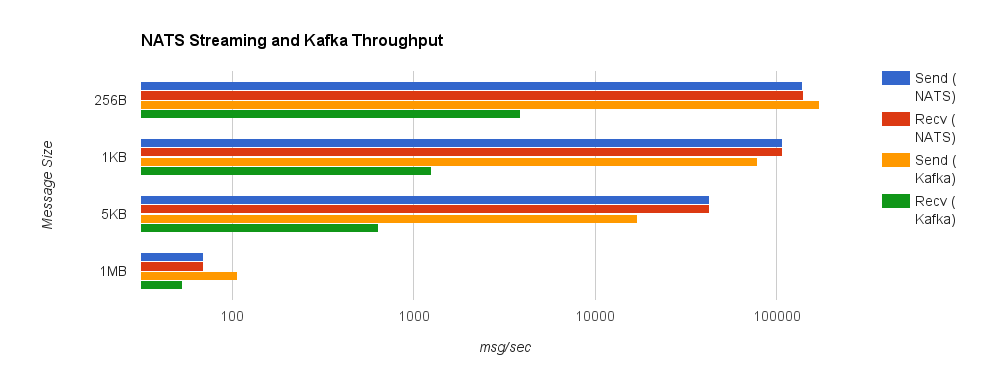
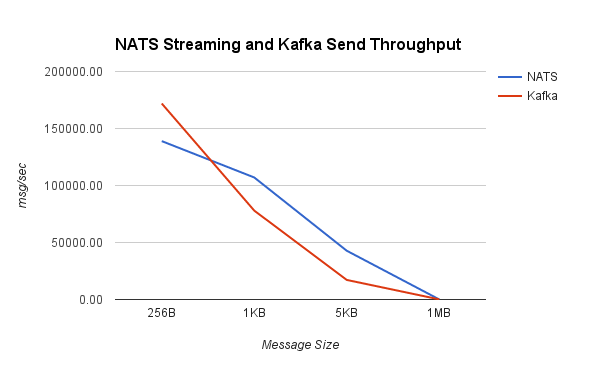
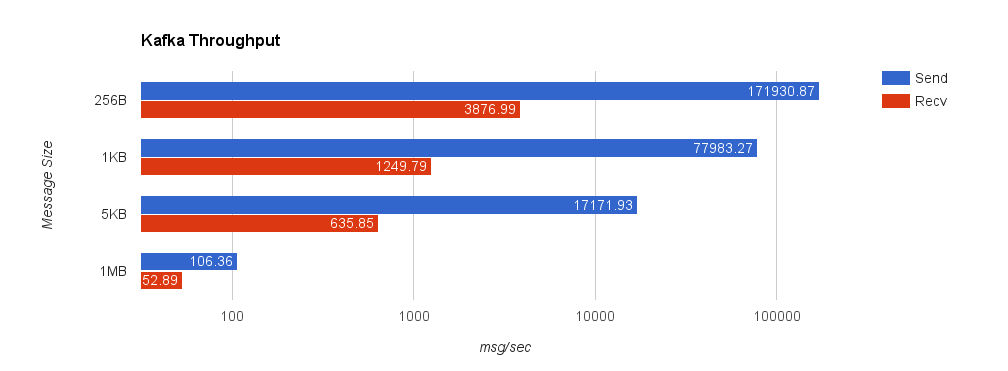
Next, we’ll look at overall throughput for the two systems. This is done by publishing 100,000 messages using the same range of sizes as before and measuring the elapsed time. Specifically, we measure throughput at the publisher and the subscriber.

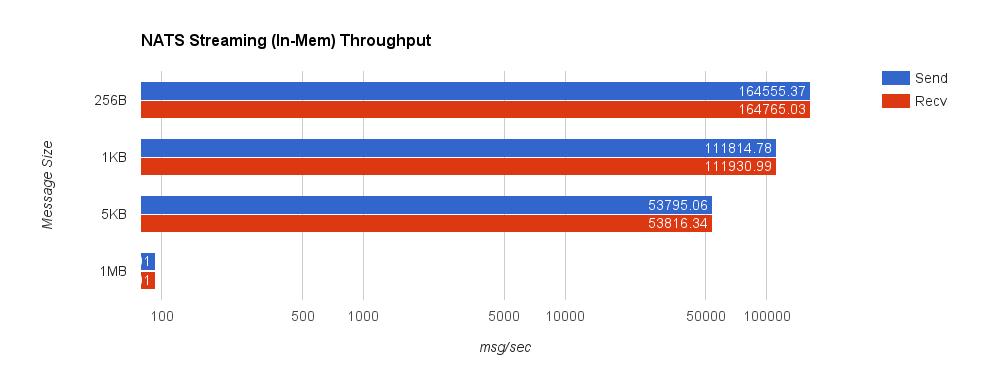
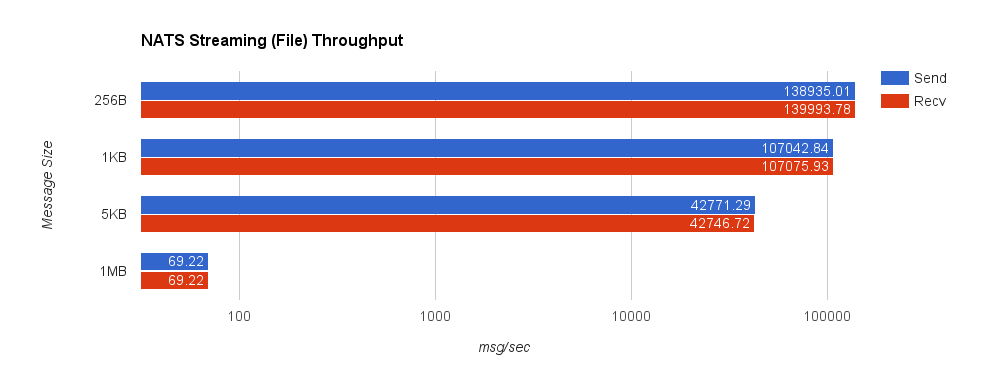
Despite using an asynchronous publisher in both the NATS Streaming and Kafka benchmarks, we do not consider the publisher “complete” until it has received acks for all published messages from the server. In Kafka, we do this by setting request.required.acks to 1, which means the leader replica has received the data, and consuming the received acks. This is important because the default value is 0, which means the producer never waits for an ack from the broker. In NATS Streaming, we provide an ack callback on every publish. We use the same benchmark configuration as the latency tests, separating load generation and consumption on different EC2 instances. Note the log scale in the following charts.

Once again, we’ll start by looking at NATS Streaming using in-memory persistence. The truncated 1MB send and receive throughputs are 93.01 messages/second.

nats_mem_throughput

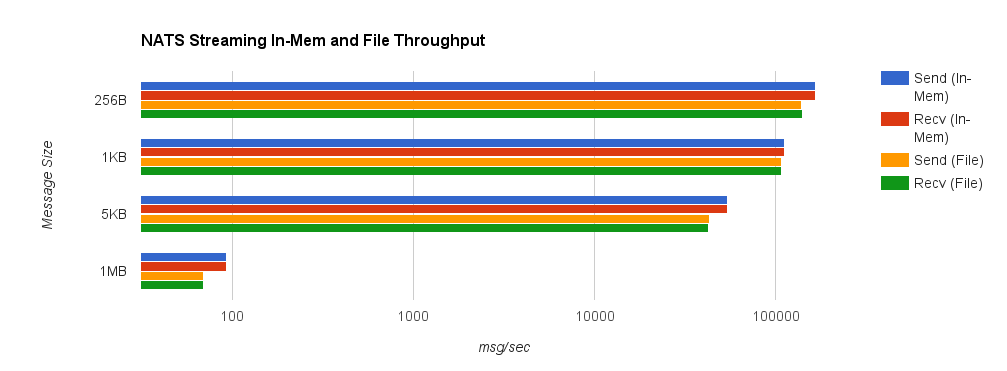
For comparison, we now look at NATS Streaming with file persistence and –file_sync=false. As before, this provides the closest behavior to Kafka’s default flush behavior. The second chart shows a side-by-side comparison between NATS Streaming with in-memory and file persistence.

nats_file_throughput

nats_compare_throughput

Lastly, we look at Kafka with replication factor 1. Throughput significantly deteriorates when we set request.required.acks = 1 since the producer must wait for all acks from the server. This is important though because, by default, the client does not require an ack from the server. If this were the case, the producer would have no idea how much data actually reached the server once it finished—it could simply be buffered in the client, in flight over the wire, or in the server but not yet on disk. Running the benchmark with request.required.acks = 0 yields much higher throughput on the sender but is basically an exercise in how fast you can write to a channel using the Sarama Go client—slightly misleading.

kafka_throughput

Looking at some comparisons of Kafka and NATS Streaming, we can see that NATS Streaming has higher throughput in all but a few cases.

nats_kafka_throughput

nats_kafka_send_throughput

I want to repeat the disclaimer from before: the purpose of this benchmark is to test drive the newly released NATS Streaming system (which as mentioned earlier, doesn’t yet support clustering), and put its performance into context by looking at a similar configuration of Kafka.

Kafka generally scales very well, so measuring the throughput of a single broker with a single producer and single consumer isn’t particularly meaningful. In reality, we’d be running a cluster with several brokers and partitioning our topics across them.

For as young as it is, NATS Streaming has solid performance (which shouldn’t come as much of a surprise considering the history of NATS itself), and I imagine it will only get better with time as the NATS team continues to optimize. In some ways, NATS Streaming bridges the gap between the commit log as made popular by Kafka and the conventional message queue as made popular by protocols like JMS, AMQP, STOMP, and the like.

The bigger question at this point is how NATS Streaming will tackle scaling and replication (a requirement for true production-readiness in my opinion). Kafka was designed from the ground up for high scalability and availability through the use of external coordination (read ZooKeeper). Naturally, there is a lot of complexity and cost that comes with that. NATS Streaming attempts to keep NATS’ spirit of simplicity, but it’s yet to be seen how it will reconcile that with the complex nature of distributed systems. I’m excited to see where Apcera takes NATS Streaming and generally the NATS ecosystem in the future since the team has a lot of experience in this area.