This article originally appeared on Workiva’s engineering blog as a two-part series.
Providing robust message routing was a priority for us at Workiva when building our distributed messaging infrastructure. This encompassed directed messaging, which allows us to route messages to specific endpoints based on service or client identifiers, but also topic fan-out with support for wildcards and pattern matching.
Existing message-oriented middleware, such as RabbitMQ, provide varying levels of support for these but don’t offer the rich features needed to power Wdesk. This includes transport fallback with graceful degradation, tunable qualities of service, support for client-side messaging, and pluggable authentication middleware. As such, we set out to build a new system, not by reinventing the wheel, but by repurposing it.
Eventually, we settled on Apache Kafka as our wheel, or perhaps more accurately, our log. Kafka demonstrates a telling story of speed, scalability, and fault tolerance—each a requisite component of any reliable messaging system—but it’s only half the story. Pub/sub is a critical messaging pattern for us and underpins a wide range of use cases, but Kafka’s topic model isn’t designed for this purpose. One of the key engineering challenges we faced was building a practical routing mechanism by which messages are matched to interested subscribers. On the surface, this problem appears fairly trivial and is far from novel, but it becomes quite interesting as we dig deeper.
Back to Basics
Topic routing works by matching a published message with interested subscribers. A consumer might subscribe to the topic “foo.bar.baz,” in which any message published to this topic would be delivered to them. We also must support * and # wildcards, which match exactly one word and zero or more words, respectively. In this sense, we follow the AMQP spec:
The routing key used for a topic exchange MUST consist of zero or more words delimited by dots. Each word may contain the letters A–Z and a–z and digits 0–9. The routing pattern follows the same rules as the routing key with the addition that * matches a single word, and # matches zero or more words. Thus the routing pattern *.stock.# matches the routing keys usd.stock and eur.stock.db but not stock.nasdaq.
This problem can be modeled using a trie structure. RabbitMQ went with this approach after exploring other options, like caching topics and indexing the patterns or using a deterministic finite automaton. The latter options have greater time and space complexities. The former requires backtracking the tree for wildcard lookups.
The subscription trie looks something like this:
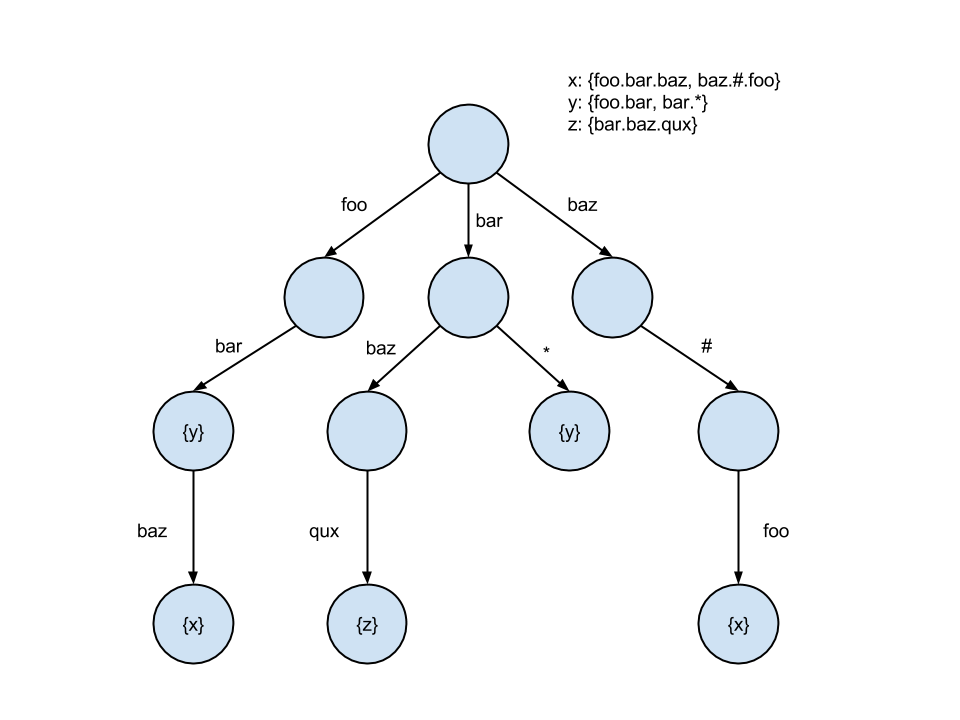
Even in spite of the backtracking required for wildcards, the trie ends up being a more performant solution due to its logarithmic complexity and tendency to fit CPU cache lines. Most tries have hot paths, particularly closer to the root, so caching becomes indispensable. The trie approach is also vastly easier to implement.
In almost all cases, this subscription trie needs to be thread-safe as clients are concurrently subscribing, unsubscribing, and publishing. We could serialize access to it with a reader-writer lock. For some, this would be the end of the story, but for high-throughput systems, locking is a major bottleneck. We can do better.
Breaking the Lock
We considered lock-free techniques that could be applied. Lock-free concurrency means that while a particular thread of execution may be blocked, all CPUs are able to continue processing other work. For example, imagine a program that protects access to some resource using a mutex. If a thread acquires this mutex and is subsequently preempted, no other thread can proceed until this thread is rescheduled by the OS. If the scheduler is adversarial, it may never resume execution of the thread, and the program would be effectively deadlocked. A key point, however, is that the mere lack of a lock does not guarantee a program is lock-free. In this context, “lock” really refers to deadlock, livelock, or the misdeeds of a malevolent scheduler.
In practice, what lock-free concurrency buys us is increased system throughput at the expense of increased tail latencies. Looking at a transactional system, lock-freedom allows us to process many concurrent transactions, any of which may block, while guaranteeing systemwide progress. Depending on the access patterns, when a transaction does block, there are always other transactions which can be processed—a CPU never idles. For high-throughput databases, this is essential.
Concurrent Timelines and Linearizability
Lock-freedom can be achieved using a number of techniques, but it ultimately reduces to a small handful of fundamental patterns. In order to fully comprehend these patterns, it’s important to grasp the concept of linearizability.
It takes approximately 100 nanoseconds for data to move from the CPU to main memory. This means that the laws of physics govern the unavoidable discrepancy between when you perceive an operation to have occurred and when it actually occurred. There is the time from when an operation is invoked to when some state change physically occurs (call it tinv), and there is the time from when that state change occurs to when we actually observe the operation as completed (call it tcom). Operations are not instantaneous, which means the wall-clock history of operations is uncertain. tinv and tcom vary for every operation. This is more easily visualized using a timeline diagram like the one below:

This timeline shows several reads and writes happening concurrently on some state. Physical time moves from left to right. This illustrates that even if a write is invoked before another concurrent write in real time, the later write could be applied first. If there are multiple threads performing operations on shared state, the notion of physical time is meaningless.
We use a linearizable consistency model to allow some semblance of a timeline by providing a total order of all state updates. Linearizability requires that each operation appears to occur atomically at some point between its invocation and completion. This point is called the linearization point. When an operation completes, it’s guaranteed to be observable by all threads because, by definition, the operation occurred before its completion time. After this point, reads will only see this value or a later one—never anything before. This gives us a proper sequencing of operations which can be reasoned about. Linearizability is a correctness condition for concurrent objects.
Of course, linearizability comes at a cost. This is why most memory models aren’t linearizable by default. Going back to our subscription trie, we could make operations on it appear atomic by applying a global lock. This kills throughput, but it ensures linearization.
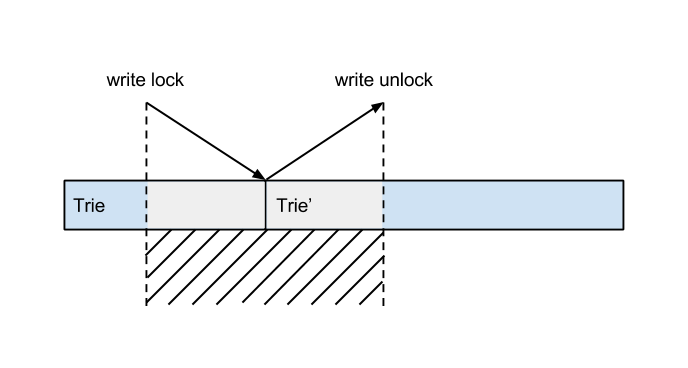
In reality, the trie operations do not occur at a specific instant in time as the illustration above depicts. However, mutual exclusion gives it the appearance and, as a result, linearizability holds at the expense of systemwide progress. Acquiring and releasing the lock appear instantaneous in the timeline because they are backed by atomic hardware operations like test-and-set. Linearizability is a composable property, meaning if an object is composed of linearizable objects, it is also linearizable. This allows us to construct abstractions from linearizable hardware instructions to data structures, all the way up to linearizable distributed systems.
Read-Modify-Write and CAS
Locks are expensive, not just due to contention but because they completely preclude parallelism. As we saw, if a thread which acquires a lock is preempted, any other threads waiting for the lock will continue to block.
Read-modify-write operations like compare-and-swap offer a lock-free approach to ensuring linearizable consistency. Such techniques loosen the bottleneck by guaranteeing systemwide throughput even if one or more threads are blocked. The typical pattern is to perform some speculative work then attempt to publish the changes with a CAS. If the CAS fails, then another thread performed a concurrent operation, and the transaction needs to be retried. If it succeeds, the operation was committed and is now visible, preserving linearizability. The CAS loop is a pattern used in many lock-free data structures and proves to be a useful primitive for our subscription trie.
CAS is susceptible to the ABA problem. These operations work by comparing values at a memory address. If the value is the same, it’s assumed that nothing has changed. However, this can be problematic if another thread modifies the shared memory and changes it back before the first thread resumes execution. The ABA problem is represented by the following sequence of events:
- Thread T1 reads shared-memory value A
- T1 is preempted, and T2 is scheduled
- T2 changes A to B then back to A
- T2 is preempted, and T1 is scheduled
- T1 sees the shared-memory value is A and continues
In this situation, T1 assumes nothing has changed when, in fact, an invariant may have been violated. We’ll see how this problem is addressed later.
At this point, we’ve explored the subscription-matching problem space, demonstrated why it’s an area of high contention, and examined why locks pose a serious problem to throughput. Linearizability provides an important foundation of understanding for lock-freedom, and we’ve looked at the most fundamental pattern for building lock-free data structures, compare-and-swap. Next, we will take a deep dive on applying lock-free techniques in practice by building on this knowledge. We’ll continue our narrative of how we applied these same techniques to our subscription engine and provide some further motivation for them.
Lock-Free Applied
Let’s revisit our subscription trie from earlier. Our naive approach to making it linearizable was to protect it with a lock. This proved easy, but as we observed, severely limited throughput. For a message broker, access to this trie is a critical path, and we usually have multiple threads performing inserts, removals, and lookups on it concurrently. Intuition tells us we can implement these operations without coarse-grained locking by relying on a CAS to perform mutations on the trie.
If we recall, read-modify-write is typically applied by copying a shared variable to a local variable, performing some speculative work on it, and attempting to publish the changes with a CAS. When inserting into the trie, our speculative work is creating an updated copy of a node. We commit the new node by updating the parent’s reference with a CAS. For example, if we want to add a subscriber to a node, we would copy the node, add the new subscriber, and CAS the pointer to it in the parent.
This approach is broken, however. To see why, imagine if a thread inserts a subscription on a node while another thread concurrently inserts a subscription as a child of that node. The second insert could be lost due to the sequencing of the reference updates. The diagram below illustrates this problem. Dotted lines represent a reference updated with a CAS.
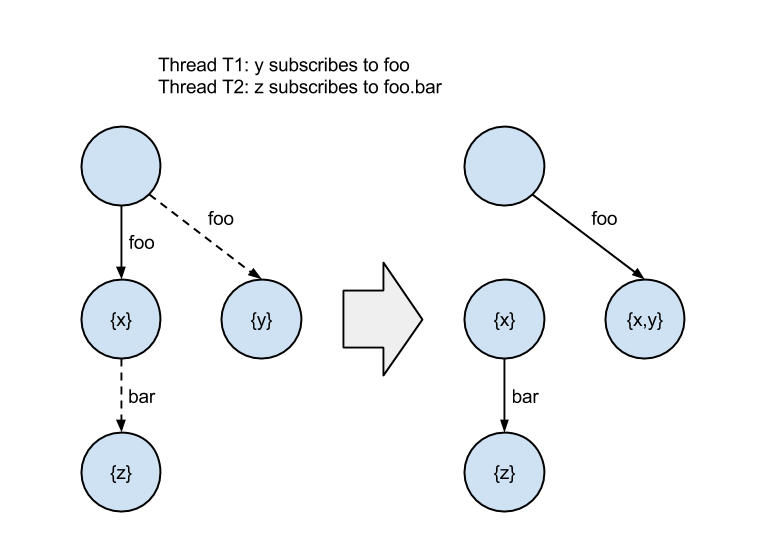
The orphaned nodes containing “x” and “z” mean the subscription to “foo.bar” was lost. The trie is in an inconsistent state.
We looked to existing research in the field of non-blocking data structures to help illuminate a path. “Concurrent Tries with Efficient Non-Blocking Snapshots” by Prokopec et al. introduces the Ctrie, a non-blocking, concurrent hash trie based on shared-memory, single-word CAS instructions.
A hash array mapped trie (HAMT) is an implementation of an associative array which, unlike a hashmap, is dynamically allocated. Memory consumption is always proportional to the number of keys in the trie. A HAMT works by hashing keys and using the resulting bits in the hash code to determine which branches to follow down the trie. Each node contains a table with a fixed number of branch slots. Typically, the number of branch slots is 32. On a 64-bit machine, this would mean it takes 256 bytes (32 branches x 8-byte pointers) to store the branch table of a node.
The size of L1-L3 cache lines is 64 bytes on most modern processors. We can’t fit the branch table in a CPU cache line, let alone the entire node. Instead of allocating space for all branches, we use a bitmap to indicate the presence of a branch at a particular slot. This reduces the size of an empty node from roughly 264 bytes to 12 bytes. We can safely fit a node with up to six branches in a single cache line.
The Ctrie is a concurrent, lock-free version of the HAMT which ensures progress and linearizability. It solves the CAS problem described above by introducing indirection nodes, or I-nodes, which remain present in the trie even as nodes above and below change. This invariant ensures correctness on inserts by applying the CAS operation on the I-node instead of the internal node array.
An I-node may point to a Ctrie node, or C-node, which is an internal node containing a bitmap and array of references to branches. A branch is either an I-node or a singleton node (S-node) containing a key-value pair. The S-node is a leaf in the Ctrie. A newly initialized Ctrie starts with a root pointer to an I-node which points to an empty C-node. The diagram below illustrates a sequence of inserts on a Ctrie.
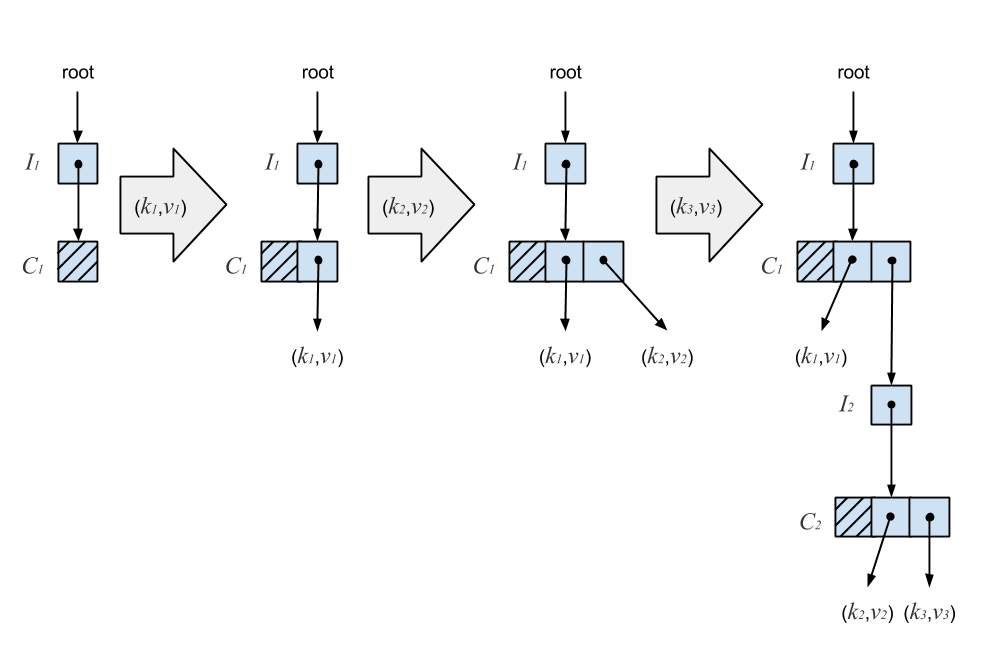
An insert starts by atomically reading the I-node’s reference. Next, we copy the C-node and add the new key, recursively insert on an I-node, or extend the Ctrie with a new I-node. The new C-node is then published by performing a CAS on the parent I-node. A failed CAS indicates another thread has mutated the I-node. We re-linearize by atomically reading the I-node’s reference again, which gives us the current state of the Ctrie according to its linearizable history. We then retry the operation until the CAS succeeds. In this case, the linearization point is a successful CAS. The following figure shows why the presence of I-nodes ensures consistency.
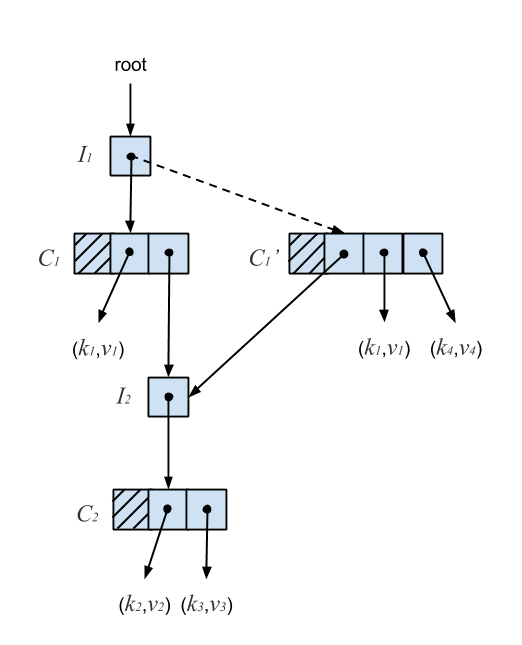
In the above diagram, (k4,v4) is inserted into a Ctrie containing (k1,v1), (k2,v2), and (k3,v3). The new key-value pair is added to node C1 by creating a copy, C1‘, with the new entry. A CAS is then performed on the pointer at I1, indicated by the dotted line. Since C1‘ continues pointing to I2, any concurrent updates which occur below it will remain present in the trie. C1 is then garbage collected once no more threads are accessing it. Because of this, Ctries are much easier to implement in a garbage-collected language. It turns out that this deferred reclamation also solves the ABA problem described earlier by ensuring memory addresses are recycled only when it’s safe to do so.
The I-node invariant is enough to guarantee correctness for inserts and lookups, but removals require some additional invariants in order to avoid update loss. Insertions extend the Ctrie with additional levels, while removals eliminate the need for some of these levels. This is because we want to keep the Ctrie as compact as possible while still remaining correct. For example, a remove operation could result in a C-node with a single S-node below it. This state is valid, but the Ctrie could be made more compact and lookups on the lone S-node more efficient if it were moved up into the C-node above. This would allow the I-node and C-node to be removed.
The problem with this approach is it will cause insertions to be lost. If we move the S-node up and replace the dangling I-node reference with it, another thread could perform a concurrent insert on that I-node just before the compression occurs. The insert would be lost because the pointer to the I-node would be removed.
This issue is solved by introducing a new type of node called the tomb node (T-node) and an associated invariant. The T-node is used to ensure proper ordering during removals. The invariant is as follows: if an I-node points to a T-node at some time t0, then for all times greater than t0, the I-node points to the same T-node. More concisely, a T-node is the last value assigned to an I-node. This ensures that no insertions occur at an I-node if it is being compressed. We call such an I-node a tombed I-node.
If a removal results in a non-root-level C-node with a single S-node below it, the C-node is replaced with a T-node wrapping the S-node. This guarantees that every I-node except the root points to a C-node with at least one branch. This diagram depicts the result of removing (k2,v2) from a Ctrie:
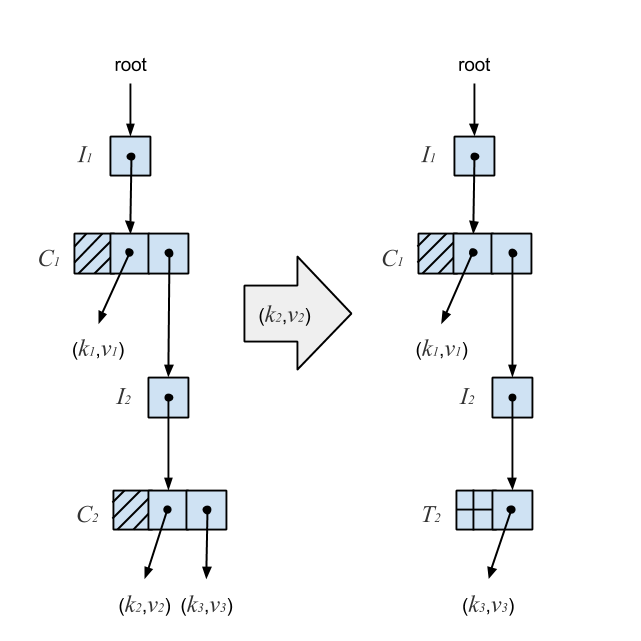
Removing (k2,v2) results in a C-node with a single branch, so it’s subsequently replaced with a T-node. The T-node provides a sequencing mechanism by effectively acting as a marker. While it solves the problem of lost updates, it doesn’t give us a compacted trie. If two keys have long matching hash code prefixes, removing one of the keys would result in a long chain of C-nodes followed by a single T-node at the end.
An invariant was introduced which says once an I-node points to a T-node, it will always point to that T-node. This means we can’t change a tombed I-node’s pointer, so instead we replace the I-node with its resurrection. The resurrection of a tombed I-node is the S-node wrapped in its T-node. When a T-node is produced during a removal, we ensure that it’s still reachable, and if it is, resurrect its tombed I-node in the C-node above. If it’s not reachable, another thread has already performed the compression. To ensure lock-freedom, all operations which read a T-node must help compress it instead of waiting for the removing thread to complete. Compression on the Ctrie from the previous diagram is illustrated below.
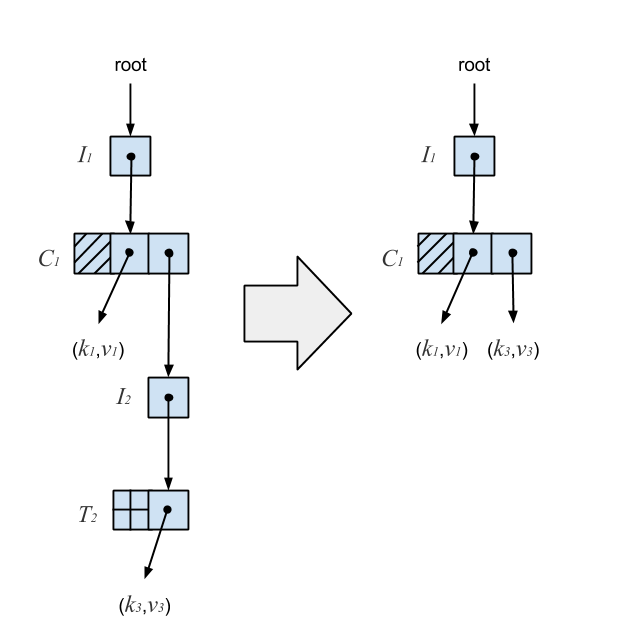
The resurrection of the tombed I-node ensures the Ctrie is optimally compressed for arbitrarily long chains while maintaining integrity.
With a 32-bit hash code space, collisions are rare but still nontrivial. To deal with this, we introduce one final node, the list node (L-node). An L-node is essentially a persistent linked list. If there is a collision between the hash codes of two different keys, they are placed in an L-node. This is analogous to a hash table using separate chaining to resolve collisions.
One interesting property of the Ctrie is support for lock-free, linearizable, constant-time snapshots. Most concurrent data structures do not support snapshots, instead opting for locks or requiring a quiescent state. This allows Ctries to have O(1) iterator creation, clear, and size retrieval (amortized).
Constant-time snapshots are implemented by writing the Ctrie as a persistent data structure and assigning a generation count to each I-node. A persistent hash trie is updated by rewriting the path from the root of the trie down to the leaf the key belongs to while leaving the rest of the trie intact. The generation demarcates Ctrie snapshots. To create a new snapshot, we copy the root I-node and assign it a new generation. When an operation detects that an I-node’s generation is older than the root’s generation, it copies the I-node to the new generation and updates the parent. The path from the root to some node is only updated the first time it’s accessed, making the snapshot a O(1) operation.
The final piece needed for snapshots is a special type of CAS operation. There is a race condition between the thread creating a snapshot and the threads which have already read the root I-node with the previous generation. The linearization point for an insert is a successful CAS on an I-node, but we need to ensure that both the I-node has not been modified and its generation matches that of the root. This could be accomplished with a double compare-and-swap, but most architectures do not support such an operation.
The alternative is to use a RDCSS double-compare-single-swap originally described by Harris et al. We implement an operation with similar semantics to RDCSS called GCAS, or generation compare-and-swap. The GCAS allows us to atomically compare both the I-node pointer and its generation to the expected values before committing an update.
After researching the Ctrie, we wrote a Go implementation in order to gain a deeper understanding of the applied techniques. These same ideas would hopefully be adaptable to our problem domain.
Generalizing the Ctrie
The subscription trie shares some similarities to the hash array mapped trie but there are some key differences. First, values are not strictly stored at the leaves but can be on internal nodes as well. Second, the decomposed topic is used to determine how the trie is descended rather than a hash code. Wildcards complicate lookups further by requiring backtracking. Lastly, the number of branches on a node is not a fixed size. Applying the Ctrie techniques to the subscription trie, we end up with something like this:
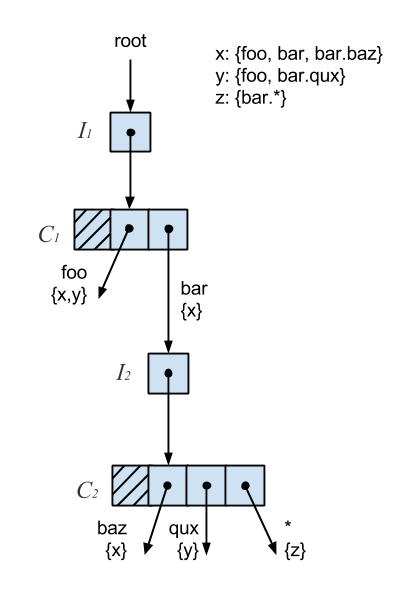
Much of the same logic applies. The main distinctions are the branch traversal based on topic words and rules around wildcards. Each branch is associated with a word and set of subscribers and may or may not point to an I-node. The I-nodes still ensure correctness on inserts. The behavior of T-nodes changes slightly. With the Ctrie, a T-node is created from a C-node with a single branch and then compressed. With the subscription trie, we don’t introduce a T-node until all branches are removed. A branch is pruned if it has no subscribers and points to nowhere or it has no subscribers and points to a tombed I-node. The GCAS and snapshotting remain unchanged.
We implemented this Ctrie derivative in order to build our concurrent pattern-matching engine, matchbox. This library provides an exceptionally simple API which allows a client to subscribe to a topic, unsubscribe from a topic, and lookup a topic’s subscribers. Snapshotting is also leveraged to retrieve the global subscription tree and the topics to which clients are currently subscribed. These are useful to see who currently has subscriptions and for what.
In Practice
Matchbox has been pretty extensively benchmarked, but to see how it behaves, it’s critical to observe its performance under contention. Many messaging systems opt for a mutex which tends to result in a lot of lock contention. It’s important to know what the access patterns look like in practice, but for our purposes, it’s heavily parallel. We don’t want to waste CPU cycles if we can help it.
To see how matchbox compares to lock-based subscription structures, I benchmarked it against gnatsd, a popular high-performance messaging system also written in Go. Gnatsd uses a tree-like structure protected by a mutex to manage subscriptions and offers similar wildcard semantics.
The benchmarks consist of one or more insertion goroutines and one or more lookup goroutines. Each insertion goroutine inserts 1000 subscriptions, and each lookup goroutine looks up 1000 subscriptions. We scale these goroutines up to see how the systems behave under contention.
The first benchmark is a 1:1 concurrent insert-to-lookup workload. A lookup corresponds to a message being published and matched to interested subscribers, while an insert occurs when a client subscribes to a topic. In practice, lookups are much more frequent than inserts, so the second benchmark is a 1:3 concurrent insert-to-lookup workload to help simulate this. The timings correspond to the complete insert and lookup workload. GOMAXPROCS was set to 8, which controls the number of operating system threads that can execute simultaneously. The benchmarks were run on a machine with a 2.6 GHz Intel Core i7 processor.
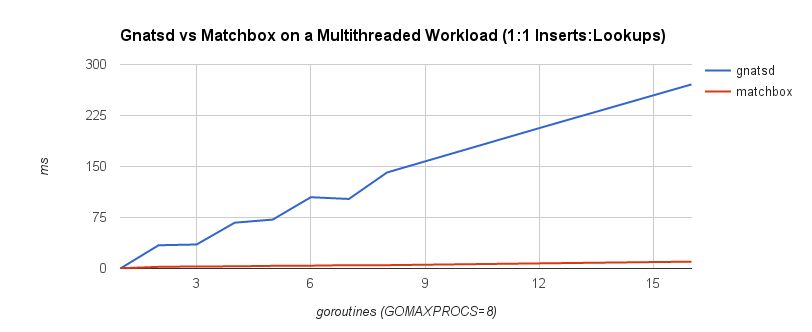
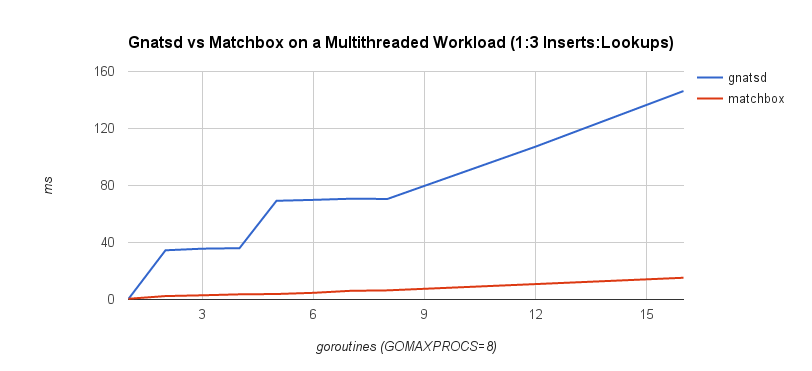
It’s quite clear that the lock-free approach scales a lot better under contention. This follows our intuition because lock-freedom allows system-wide progress even when a thread is blocked. If one goroutine is blocked on an insert or lookup operation, other operations may proceed. With a mutex, this isn’t possible.
Matchbox performs well, particularly in multithreaded environments, but there are still more optimizations to be made. This includes improvements both in memory consumption and runtime performance. Applying the Ctrie techniques to this type of trie results in a fairly non-compact structure. There may be ways to roll up branches—either eagerly or after removals—and expand them lazily as necessary. Other optimizations might include placing a cache or Bloom filter in front of the trie to avoid descending it. The main difficulty with these will be managing support for wildcards.
Conclusion
To summarize, we’ve seen why subscription matching is often a major concern for message-oriented middleware and why it’s frequently a bottleneck. Concurrency is crucial for high-performance systems, and we’ve looked at how we can achieve concurrency without relying on locks while framing it within the context of linearizability. Compare-and-swap is a fundamental tool used to implement lock-free data structures, but it’s important to be conscious of the pitfalls. We introduce invariants to protect data consistency. The Ctrie is a great example of how to do this and was foundational in our lock-free subscription-matching implementation. Finally, we validated our work by showing that lock-free data structures scale dramatically better with multithreaded workloads under contention.
My thanks to Steven Osborne and Dustin Hiatt for reviewing this article.
Follow @tyler_treat