Choosing Good SLIs

Transitioning from an on-prem environment to a cloud environment involves a lot of major shifts for organizations. One of those shifts is often around how we monitor the overall health of systems. The typical way to measure things like the availability, reliability, and performance of systems is with SLIs or Service Level Indicators. SLIs are a valuable tool both on-prem and in the cloud, but when it comes to the latter, I often see organizations carrying over some operational anti-patterns from their data center environment.

Unlike public clouds, data centers are often resource-constrained. Services run on dedicated sets of VMs and it can take days or weeks for new physical servers to be provisioned. Consequently, it’s common for organizations to closely monitor metrics such as CPU utilization, memory consumption, disk space, and so forth since these are all precious resources within a data center.

Often what happens is that ops teams get really good at identifying and pattern-matching the common issues that arise in their on-prem environment. For instance, certain applications may be prone to latency issues. Each time we dig into a latency issue we find that the problem is due to excessive garbage collection pauses. As a result, we define a metric around garbage collection because it is often an indicator of performance problems in the application. In practice, this becomes an SLI, whether it’s explicitly defined as such or not, because there is some sort of threshold beyond which garbage collection is considered “excessive.” We begin watching this metric closely to gauge whether the service is healthy or not and alerting on it.

The cloud is a very different environment than on-prem. Whether we’re using an orchestrator such as Kubernetes or a serverless platform, containers are usually ephemeral and instances autoscale up and down. If an instance runs out of memory, it will just get recycled. This is why we sometimes say you can “pay your way out” of a problem in these environments because autoscaling and autohealing can hide a lot of application issues such as a slow memory leak. In an on-prem environment, these can be significantly more impactful. The performance profile of applications often looks quite differently in the cloud than on-prem as well. Underlying hardware, tenancy, and networking characteristics differ considerably. All this is to say, things look and behave quite differently between the two environments, so it’s important to reevaluate operational practices as well. With SLIs and monitoring, it’s easy to bias toward specific indicators from on-prem, but they might not translate to more cloud-native environments.

User-centric monitoring

So how do we choose good SLIs? The key question to ask is: what is the customer’s experience like? Everything should be driven from this. Is the application responding slowly? Is it returning errors to the user? Is it returning bad or incorrect results? These are all things that directly impact the customer’s experience. Conversely, things that do not directly impact the customer’s experience are questions such as what is the CPU utilization of the service? The memory consumption? The rate of garbage collection cycles? These are all things that could impact the customer’s experience, but without actually looking from the user’s perspective, we simply don’t know whether they are or not. Rather, they are diagnostic tools that—once an issue is identified—can help us to better understand the underlying cause.

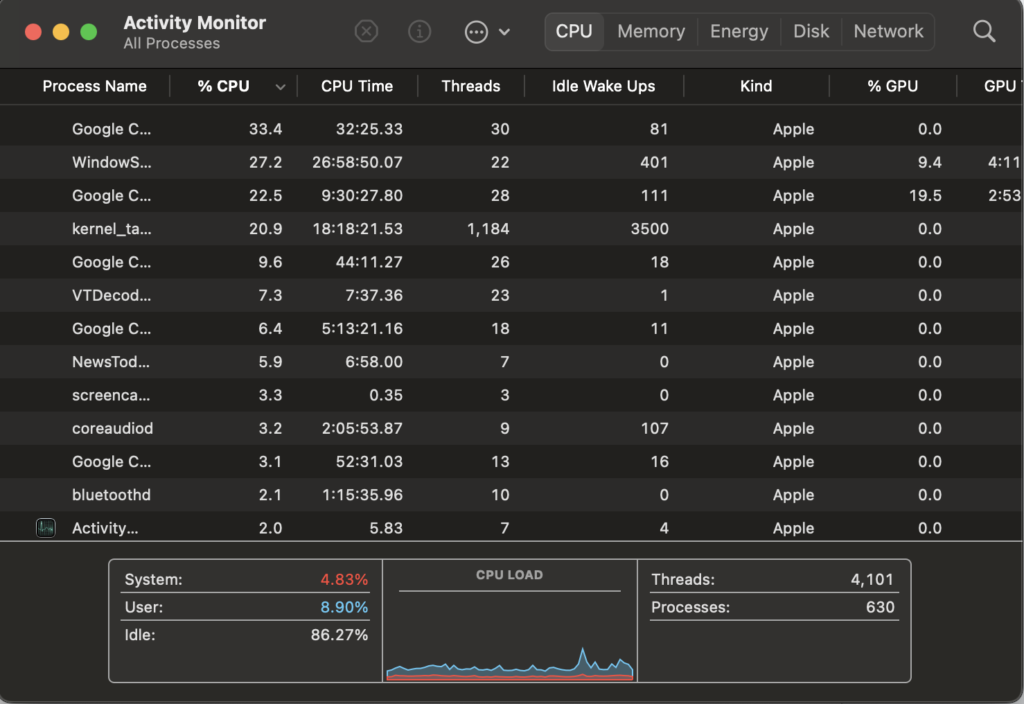
Take, for example, the CPU and memory utilization of processes on your computer. Most people probably are not constantly watching the Activity Monitor on their MacBook. Instead, they might open it up when they notice their machine is responding slowly to see what might be causing the slowness.

Three key metrics

When it comes to monitoring services, there are really three key metrics that matter: traffic rate, error rate, and latency. These three things all directly impact the user’s experience.

Traffic Rate

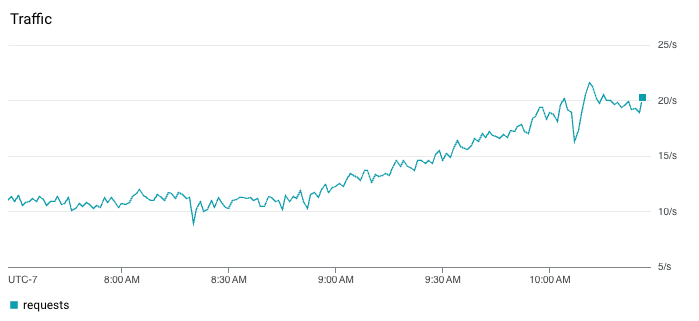
Traffic rate, which is usually measured in requests or queries per second (qps), is important because it tells us if something is wrong upstream of us. For instance, our service might not be throwing any errors, but if it’s suddenly handling 0 qps when it ordinarily is handling 80-100 qps, then something happened upstream that we should know about. Perhaps there is a misconfiguration that is preventing traffic from reaching our service, which almost certainly impacts the user experience.

Traffic rate or qps for a service

Error Rate

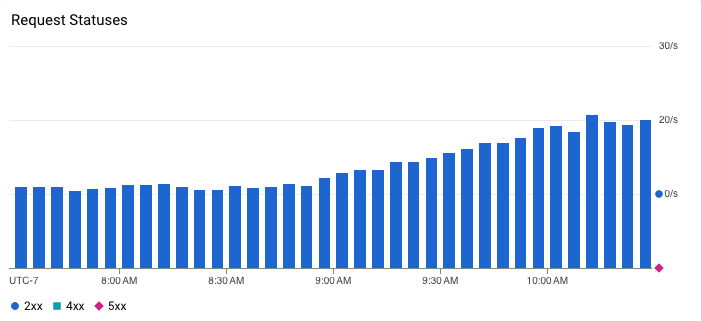
Error rate simply tells us the rate in which the service is returning errors to the client. If our service normally returns 200 responses but suddenly starts returning 500 errors, we know something is wrong. This requires good status code hygiene to be effective. I’ve encountered codebases where various types of error codes are used to indicate non-error conditions which can add a lot of noise to this type of SLI. Additionally, this metric might be more fine-grained than just “error” or “not error”, since—depending on the application—we might care about the rate of specific 2xx, 4xx, or 5xx responses, for example.

It’s common for teams to rely on certain error logs rather than response status codes for monitoring. This can provide even more granularity around types of error conditions, but in my experience, it usually works better to rely on fairly coarse-grained signals such as HTTP status codes for the purposes of aggregate monitoring and SLIs. Instead, use this logging for diagnostics and troubleshooting once you have identified there is a problem (I am, however, a fan of structured logging and log-based metrics for instrumentation but this is for another blog post).

Response codes for a service

Latency

Combined with error rate, latency tells us what the customer’s experience is really like. This is an important metric for synchronous, user-facing APIs but might be less critical for asynchronous processes such as services that consume events from a message queue. It’s important to point out that when looking at latency, you cannot use averages. This is a common trap I see ops teams and engineers fall into. Latency rarely follows a normal distribution, so relying on averages or medians to provide a summarized view of how a system is performing is folly.

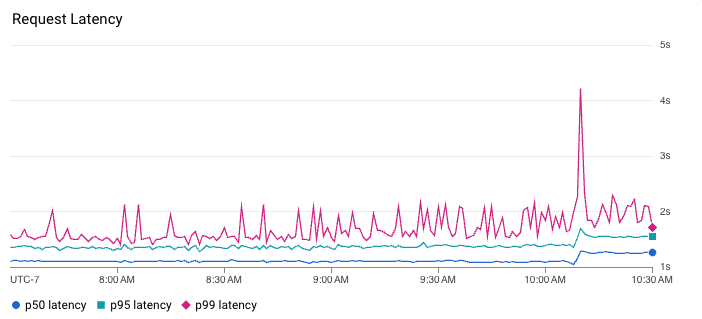
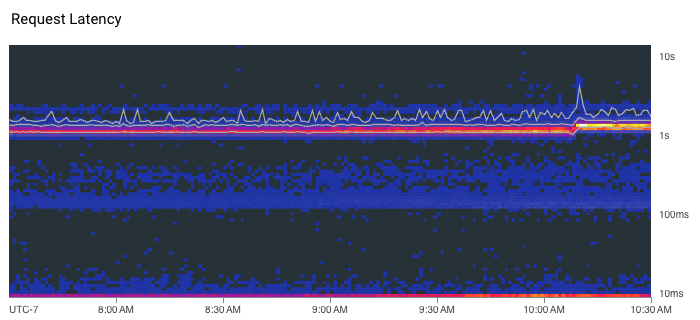
Instead, we have to look at percentiles to get a better understanding of what the latency distribution looks like. Similarly, you cannot average percentiles either. It mathematically makes no sense, meaning you can’t, for instance, look at the average 90th percentile over some period of time. To summarize latency, we can plot multiple percentiles on a graph. Alternatively, heatmaps can be an effective way to visualize latency because they can reveal useful details like distribution modes and outliers. For example, the heatmap below shows that the latency for this service is actually bimodal. Requests usually either respond in approximately 10 milliseconds or 1 second. This modality is not apparent in the line chart above the heatmap where we are only plotting the 50th, 95th, and 99th percentiles. The line chart does, however, show that latency ticked up a tiny bit around 10:10 AM following a severe spike in tail latency where the 99th percentile momentarily jumped over 4 seconds…curious.

Latency distribution for a service as percentiles
Latency distribution for a service as a heatmap

Identifying other SLIs

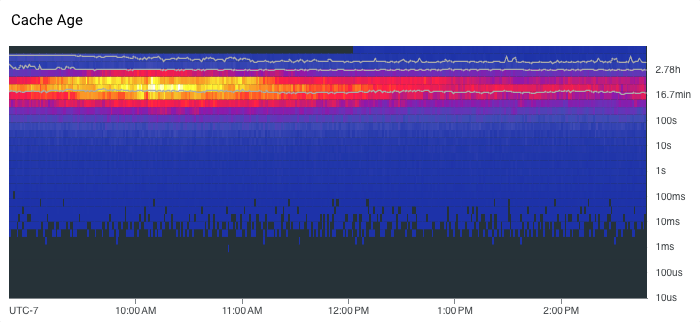
While these three metrics are what I consider the critical baseline metrics, there may be other SLIs that are important to a service. For example, if our service is a cache, we might care about the freshness of data we’re serving as something that impacts the customer experience. If our service is queue-based, we might care about the time messages spend sitting in the queue.

Heatmap showing the age distribution of data retrieved from a cache

Whatever the SLIs are, they should be things that directly matter to the user’s experience. If they aren’t, then at best they are a useful diagnostic or debugging tool and at worst they are just dashboard window dressing. Usually, though, they’re no use for proactive monitoring because it’s too much noise, and they’re no use for reactive debugging because it’s typically pre-aggregated data.

What’s worse is that when we focus on the wrong SLIs, it can lead us to take steps that actively harm the customer’s experience or simply waste our own time. A real-world example of this is when I saw a team that was actively monitoring garbage collection time for a service. They noticed one instance in particular appeared to be running more garbage collections than the others. While it appeared there were no obvious indicators of latency issues, timeouts, or out-of-memory errors that would actually impact the client, the team decided to redeploy the service in order to force instances to be recycled. This redeploy ended up having a much greater impact on the user experience than any of the garbage collection behavior ever did. The team also spent a considerable amount of time tuning various JVM parameters and other runtime settings, which ultimately had minimal impact.

Where lower-level metrics can provide value is with optimizing resource utilization and cloud spend. While the elastic nature of cloud may allow us to pay our way out of certain types of problems such as a memory leak, this can lead to inefficiency and waste long term. If we see that our service only utilizes 20% of its allocated CPU, we are likely overprovisioned and could save money. If we notice memory consumption consistently creeping up and up before hitting an out-of-memory error, we likely have a memory leak. However, it’s important to understand this distinction in use cases: SLIs are about gauging customer experience while these system metrics are for identifying optimizations and understanding long-term resource characteristics of your system. At any rate, I think it’s preferable to get a system to production with good monitoring in place, put real traffic on it, and then start to fine-tune its performance and resource utilization versus trying to optimize it beforehand through synthetic means.

Transitioning from an on-prem environment to the cloud necessitates a shift in how we monitor the health of systems. It’s essential to recognize and discard operational anti-patterns from traditional data center environments, where resource constraints often lead to a focus on specific metrics and behaviors. This can frequently lead to a sort of “overfitting” when monitoring cloud-based systems. The key to choosing good SLIs is by aligning them with the customer’s experience. Metrics such as traffic rate, error rate, and latency directly impact the user and provide meaningful insights into the health of services. By emphasizing these critical baseline metrics and avoiding distractions with irrelevant indicators, organizations can proactively monitor and improve the customer experience. Focusing on the right SLIs ensures that efforts are directed toward resolving actual issues that matter to users, avoiding pitfalls that can inadvertently harm user experience or waste valuable time. As organizations navigate the complexities of migrating to a cloud-native environment, a user-centric approach to monitoring remains fundamental to successful and efficient operations.

Need help making the transition?

Real Kinetic helps organizations with their cloud migrations and implementing effective operations. If you have questions or need help getting started, we’d love to hear from you. These emails come directly to us, and we respond to every one.

Cloud without Kubernetes

I think it’s safe to say Kubernetes has “won” the cloud mindshare game. If you look at the CNCF Cloud Native landscape (and manage to not go cross eyed), it seems like most of the projects are somehow related to Kubernetes. KubeCon is one of the fastest-growing industry events. Companies we talk to at Real Kinetic who are either preparing for or currently executing migrations to the cloud are centering their strategies around Kubernetes. Those already in the cloud are investing heavily in platform-izing their Kubernetes environment. Kubernetes competitors like Nomad, Pivotal Cloud Foundry, OpenShift, and Rancher have sort of just faded to the background (or simply pivoted to Kubernetes). In many ways, “cloud native” seems to be equated with “Kubernetes”.

All this is to say, the industry has coalesced around Kubernetes as the way to do cloud. But after working with enough companies doing cloud, watching their experiences, and understanding their business problems, I can’t help but wonder: should it be? Or rather, is Kubernetes actually the right level of abstraction?

Going k8sless

While we’ve worked with a lot of companies doing Kubernetes, we’ve also worked with some that are deliberately not. Instead, they leaned into serverless—heavily—or as I like to call it, they’ve gone k8sless. These are not small companies or startups, they are name brands you would recognize.

At first, we were skeptical. Our team came from a company that made it all the way to IPO using Google App Engine, one of the earliest serverless platforms available. We have regularly espoused the benefits of serverless. We’ve talked to clients about how they should consider it for their own workloads (often to great skepticism). But using only serverless? For once, we were the serverless skeptics. One client in particular was beginning a migration of their e-commerce platform to Google Cloud. They wanted to do it completely serverless. We gave our feedback and recommendations based on similar migrations we’ve performed:

“There are workloads that aren’t a good fit.”

“It would require major re-architecting.”

“It will be expensive once fully migrated.”

“You’ll have better cost efficiency bin packing lots of services into VMs with Kubernetes.”

We articulated all the usual arguments made by the serverless doubters. Even Google was skeptical, echoing our sentiments to the customer. “Serious companies doing online retail like The Home Depot or Target are using Google Kubernetes Engine,” was more or less the message. We have a team of serverless experts at Real Kinetic though, so we forged ahead and helped execute the migration.

Fast forward nearly three years later and we will happily admit it: we were wrong. You can run a multibillion-dollar e-commerce platform without a single VM. You don’t have to do a full rewrite or major re-architecting. It can be cost-effective. It doesn’t require proprietary APIs or constraints that result in vendor lock-in. It might sound like an exaggeration, but it’s not.

Container as the interface

Over the last several years, Google’s serverless offerings have evolved far beyond App Engine. It has reached the point where it’s now viable to run a wide variety of workloads without much issue. In particular, Cloud Run offers many of the same benefits of a PaaS like App Engine without the constraints. If your code can run in a container, there’s a very good chance it will run on Cloud Run with little to no modification.

In fact, other than using the gcloud CLI to deploy a service, there’s nothing really Google- or Cloud Run-specific needed to get a functioning application. This is because Cloud Run uses Knative, an open-source Kubernetes-based platform, as its deployment interface. And while Cloud Run is a Google-managed backend for the Knative interface, we could just as well switch the backend to GKE or our own Kubernetes cluster. When we implement our Cloud Run services, we actually implement them using a Kubernetes Deployment manifest, shown below, and right before deploying, we swap Deployment for Knative’s Service manifest.

apiVersion: apps/v1
kind: Deployment
metadata:
  labels:
    cloud.googleapis.com/location: us-central1
    service: my-service
  name: my-service
spec:
  template:
    spec:
      containers:
        - image: us.gcr.io/my-project/my-service:v1
          name: my-service
          ports:
            - containerPort: 8080
          resources:
            limits:
              cpu: 2
              memory: 1024Mi

This means we can deploy to Kubernetes without Knative at all, which we often do during development using the combination of Skaffold and K3s to perform local testing. It also allows us to use Kubernetes native tooling such as Kustomize to manage configuration. Think of Cloud Run as a Kubernetes Deployment as a service (though really more like Deployment and Service…as a service).

“Normal” businesses versus internet-scale businesses

What about cost? Yes, the unit cost in terms of compute is higher with serverless. If you execute enough CPU cycles to fill the capacity of a VM, you are better off renting the whole VM as opposed to effectively renting timeshares of it. But here’s the thing: most “normal” businesses tend to have highly cyclical traffic patterns throughout the day and their scale is generally modest.

What do I mean by “normal” businesses? These are primarily non-internet-scale companies such as insurance, fast food, car rental, construction, or financial services, not Google, Netflix, or Amazon. As a result, these companies can benefit greatly from pay-per-use, and those in the retail space also benefit greatly from the elasticity of this model during periods like Black Friday or promotional campaigns. Businesses with brick-and-mortar have traffic that generally follows their operating hours. During off-hours, they can often scale quite literally to zero.

Many of these businesses, for better or worse, treat software development as an IT cost center to be managed. They don’t need—or for that matter, want—the costs and overheads associated with platform-izing Kubernetes. A lot of the companies we interact with fall into this category of “normal” businesses, and I suspect most companies outside of tech do as well.

BYOP—Bring Your Own Platform

I’ve asked it before: is Kubernetes really the end-game abstraction? In my opinion, it’s an implementation detail. I don’t think I’m alone in that opinion. Some companies put a tremendous amount of investment into abstracting Kubernetes from their developers. This is what I mean by “platform-izing” Kubernetes. It typically involves significant and ongoing OpEx investment. The industry has started to coalesce around two concepts that encapsulate this: Platform Engineering and Internal Developer Platform. So while Kubernetes may have become the default container orchestrator, the higher-level pieces—the pieces constituting the Internal Developer Platform—are still very much bespoke. Kelsey Hightower said it best: the majority of people managing infrastructure just want a PaaS. The only requirement: it has to be built by them. That’s a problem.

Imagine having a Kubernetes cluster per Deployment. Full blast radius isolation, complete cost traceability, granular yet simple permissioning. It sounds like a maintenance nightmare though, right? Now imagine those clusters just being hidden from you completely and the Deployment itself is the only thing you interact with and maintain. You just provide your container (or group of containers), configure your CPU and memory requirements, specify the network and resource access, and deploy it. The Deployment manages your load balancing and ingress, automatically scales the pods up and down or canaries traffic, and gives you aggregated logs and metrics out of the box. You only pay for the resources consumed while processing a request. Just a few years ago, this was a futuristic-sounding fantasy.

The platform Kelsey describes above does now exist. From my experience, it’s a nearly ideal solution for those “normal” businesses who are looking to minimize complexity and operational costs and avoid having to bring (more like build) their own platform. I realize GCP is a distant third when it comes to public cloud market share so this will largely fall on deaf ears, but for those who are still listening: stop wasting time on Kubernetes and just use Cloud Run. Let me expand on the reasons why.

  1. Easily and quickly get started with the cloud. Many of the companies we work with who are still in the midst of migrating to the cloud get hung up with analysis paralysis. Cloud Run isn’t a perfect solution for everything, but it’s good enough for the majority of cases. The rest can be handled as exceptions.

  2. Minimize complexity of cloud environments. Cloud Run does not eliminate the need for infrastructure (there are still caches, queues, databases, and so forth), but it greatly simplifies it. Using managed services for the remaining infrastructure pieces simplifies it further.

  3. Increase the efficiency of your developers and reduce operational costs. Rather than spending most of their time dealing with infrastructure concerns, allow your developers to focus on delivering business value. For most businesses, infrastructure is undifferentiated commodity work. By “outsourcing” large parts of your undifferentiated Internal Developer Platform, you can reallocate developers to product or feature development and reduce operational costs. This allows you to get the benefits of Platform Engineering with a fraction of the maintenance and overhead. Lastly, if you are a “normal” business that doesn’t operate at internet scale and has fairly cyclical traffic, it’s entirely likely Cloud Run will be cheaper than VM-based platforms.

  4. Maintain the flexibility to evolve to a more complex solution over time if needed. This is where traditional serverless platforms and PaaS solutions fall short. Again, with Cloud Run there is no actual vendor lock-in, it’s just a Kubernetes Deployment as a Service. Even without Knative, we can take that Deployment and run it in any Kubernetes cluster. This is a very different paradigm from, say, App Engine where you wrote your application using App Engine APIs and deployed your service to the App Engine runtime. In this new paradigm, the artifact is a Plain Old Container. There are cases where Cloud Run is not a good fit, such as certain kinds of stateful legacy applications or services with sustained, non-cyclical traffic. We don’t want to be painted into a corner with these types of situations so having flexibility is important.

There are similar analogs to Cloud Run on other cloud platforms. For example, AWS has AppRunner. However, in my experience these fall short in terms of developer experience because of either lack of investment from the cloud provider or environment complexity (as I would argue is the case for AWS). Managed services like Cloud Run are one of the areas that GCP truly excels and differentiates itself.

Just use Cloud Run, seriously

I realize not everyone will be convinced. The gravitational pull of Kubernetes is strong and as a platform, it’s a safe bet. However, operationalizing Kubernetes properly—whether it’s a managed offering like GKE or not—requires some kind of platform team and ongoing investment. We’ve seen it approached without this where developers are given clusters or allowed to spin them up and fend for themselves. This quickly becomes untenable because standards are non-existent, security and compliance is unmanageable, and developer time is split between managing infrastructure and actual feature development.

If your organization is unable or unwilling to make this investment, I urge you to consider Cloud Run. There’s still work needed on the periphery to properly operationalize it, such as implementing CI/CD pipelines and managing accessory infrastructure, but it’s a much lower investment. Additionally, it provides an escape hatch—unlike App Engine or traditional PaaS solutions, there is no real switching cost in moving to Kubernetes if you need to in the future. With Cloud Run, serverless has finally reached a tipping point where it’s now viable for a majority of workloads rather than a niche subset. Unlike Kubernetes, it provides the right level of abstraction for most businesses building software. In my opinion, serverless is still not taken seriously due to preconceived notions, but it’s time to start reevaluating those notions.

Agree? Disagree? I’d love to hear your thoughts. If you’re an organization that would like to do cloud differently or are looking for the playbook to operationalize Google Cloud Platform, please get in touch.