Take It to the Limit: Considerations for Building Reliable Systems

Complex systems usually operate in failure mode. This is because a complex system typically consists of many discrete pieces, each of which can fail in isolation (or in concert). In a microservice architecture where a given function potentially comprises several independent service calls, high availability hinges on the ability to be partially available. This is a core tenet behind resilience engineering. If a function depends on three services, each with a reliability of 90%, 95%, and 99%, respectively, partial availability could be the difference between 99.995% reliability and 84% reliability (assuming failures are independent). Resilience engineering means designing with failure as the normal.

Anticipating failure is the first step to resilience zen, but the second is embracing it. Telling the client “no” and failing on purpose is better than failing in unpredictable or unexpected ways. Backpressure is another critical resilience engineering pattern. Fundamentally, it’s about enforcing limits. This comes in the form of queue lengths, bandwidth throttling, traffic shaping, message rate limits, max payload sizes, etc. Prescribing these restrictions makes the limits explicit when they would otherwise be implicit (eventually your server will exhaust its memory, but since the limit is implicit, it’s unclear exactly when or what the consequences might be). Relying on unbounded queues and other implicit limits is like someone saying they know when to stop drinking because they eventually pass out.

Rate limiting is important not just to prevent bad actors from DoSing your system, but also yourself. Queue limits and message size limits are especially interesting because they seem to confuse and frustrate developers who haven’t fully internalized the motivation behind them. But really, these are just another form of rate limiting or, more generally, backpressure. Let’s look at max message size as a case study.

Imagine we have a system of distributed actors. An actor can send messages to other actors who, in turn, process the messages and may choose to send messages themselves. Now, as any good software engineer knows, the eighth fallacy of distributed computing is “the network is homogenous.” This means not all actors are using the same hardware, software, or network configuration. We have servers with 128GB RAM running Ubuntu, laptops with 16GB RAM running macOS, mobile clients with 2GB RAM running Android, IoT edge devices with 512MB RAM, and everything in between, all running a hodgepodge of software and network interfaces.

When we choose not to put an upper bound on message sizes, we are making an implicit assumption (recall the discussion on implicit/explicit limits from earlier). Put another way, you and everyone you interact with (likely unknowingly) enters an unspoken contract of which neither party can opt out. This is because any actor may send a message of arbitrary size. This means any downstream consumers of this message, either directly or indirectly, must also support arbitrarily large messages.

How can we test something that is arbitrary? We can’t. We have two options: either we make the limit explicit or we keep this implicit, arbitrarily binding contract. The former allows us to define our operating boundaries and gives us something to test. The latter requires us to test at some undefined production-level scale. The second option is literally gambling reliability for convenience. The limit is still there, it’s just hidden. When we don’t make it explicit, we make it easy to DoS ourselves in production. Limits become even more important when dealing with cloud infrastructure due to their multitenant nature. They prevent a bad actor (or yourself) from bringing down services or dominating infrastructure and system resources.

In our heterogeneous actor system, we have messages bound for mobile devices and web browsers, which are often single-threaded or memory-constrained consumers. Without an explicit limit on message size, a client could easily doom itself by requesting too much data or simply receiving data outside of its control—this is why the contract is unspoken but binding.

Let’s look at this from a different kind of engineering perspective. Consider another type of system: the US National Highway System. The US Department of Transportation uses the Federal Bridge Gross Weight Formula as a means to prevent heavy vehicles from damaging roads and bridges. It’s really the same engineering problem, just a different discipline and a different type of infrastructure.

The August 2007 collapse of the Interstate 35W Mississippi River bridge in Minneapolis brought renewed attention to the issue of truck weights and their relation to bridge stress. In November 2008, the National Transportation Safety Board determined there had been several reasons for the bridge’s collapse, including (but not limited to): faulty gusset plates, inadequate inspections, and the extra weight of heavy construction equipment combined with the weight of rush hour traffic.

The DOT relies on weigh stations to ensure trucks comply with federal weight regulations, fining those that exceed restrictions without an overweight permit.

The federal maximum weight is set at 80,000 pounds. Trucks exceeding the federal weight limit can still operate on the country’s highways with an overweight permit, but such permits are only issued before the scheduled trip and expire at the end of the trip. Overweight permits are only issued for loads that cannot be broken down to smaller shipments that fall below the federal weight limit, and if there is no other alternative to moving the cargo by truck.

Weight limits need to be enforced so civil engineers have a defined operating range for the roads, bridges, and other infrastructure they build. Computers are no different. This is the reason many systems enforce these types of limits. For example, Amazon clearly publishes the limits for its Simple Queue Service—the max in-flight messages for standard queues is 120,000 messages and 20,000 messages for FIFO queues. Messages are limited to 256KB in size. Amazon KinesisApache KafkaNATS, and Google App Engine pull queues all limit messages to 1MB in size. These limits allow the system designers to optimize their infrastructure and ameliorate some of the risks of multitenancy—not to mention it makes capacity planning much easier.

Unbounded anything—whether its queues, message sizes, queries, or traffic—is a resilience engineering anti-pattern. Without explicit limits, things fail in unexpected and unpredictable ways. Remember, the limits exist, they’re just hidden. By making them explicit, we restrict the failure domain giving us more predictability, longer mean time between failures, and shorter mean time to recovery at the cost of more upfront work or slightly more complexity.

It’s better to be explicit and handle these limits upfront than to punt on the problem and allow systems to fail in unexpected ways. The latter might seem like less work at first but will lead to more problems long term. By requiring developers to deal with these limitations directly, they will think through their APIs and business logic more thoroughly and design better interactions with respect to stability, scalability, and performance.

Benchmarking Commit Logs

In this article, we look at Apache Kafka and NATS Streaming, two messaging systems based on the idea of a commit log. We’ll compare some of the features of both but spend less time talking about Kafka since by now it’s quite well known. Similar to previous studies, we’ll attempt to quantify their general performance characteristics through careful benchmarking.

The purpose of this benchmark is to test drive the newly released NATS Streaming system, which was made generally available just in the last few months. NATS Streaming doesn’t yet support clustering, so we try to put its performance into context by looking at a similar configuration of Kafka.

Unlike conventional message queues, commit logs are an append-only data structure. This results in several nice properties like total ordering of messages, at-least-once delivery, and message-replay semantics. Jay Kreps’ blog post The Log is a great introduction to the concept and particularly why it’s so useful in the context of distributed systems and stream processing (his book I Heart Logs is an extended version of the blog post and is a quick read).

Kafka, which originated at LinkedIn, is by far the most popular and most mature implementation of the commit log (AWS offers their own flavor of it called Kinesis, and imitation is the sincerest form of flattery). It’s billed as a “distributed streaming platform for building real-time data pipelines and streaming apps.” The much newer NATS Streaming is actually a data-streaming layer built on top of Apcera’s high-performance publish-subscribe system NATS. It’s billed as “real-time streaming for Big Data, IoT, Mobile, and Cloud Native Applications.” Both have some similarities as well as some key differences.

Fundamental to the notion of a log is a way to globally order events. Neither NATS Streaming nor Kafka are actually a single log but many logs, each totally ordered using a sequence number or offset, respectively.

In Kafka, topics are partitioned into multiple logs which are then replicated across a number of servers for fault tolerance, making it a distributed commit log. Each partition has a server that acts as the leader. Cluster membership and leader election is managed by ZooKeeper.

NATS Streaming’s topics are called “channels” which are globally ordered. Unlike Kafka, NATS Streaming does not support replication or partitioning of channels, though my understanding is clustering support is slated for Q1 2017. Its message store is pluggable, so it can provide durability using a file-backed implementation, like Kafka, or simply an in-memory store.

NATS Streaming is closer to a hybrid of traditional message queues and the commit log. Like Kafka, it allows replaying the log from a specific offset, the beginning of time, or the newest offset, but it also exposes an API for reading from the log at a specific physical time offset, e.g. all messages from the last 30 seconds. Kafka, on the other hand, only has a notion of logical offsets (correction: Kafka added support for offset lookup by timestamp in 0.10.1.0) . Generally, relying on physical time is an anti-pattern in distributed systems due to clock drift and the fact that clocks are not always monotonic. For example, imagine a situation where a NATS Streaming server is restarted and the clock is changed. Messages are still ordered by their sequence numbers but their timestamps might not reflect that. Developers would need to be aware of this while implementing their business logic.

With Kafka, it’s strictly on consumers to track their offset into the log (or the high-level consumer which stores offsets in ZooKeeper (correction: Kafka itself can now store offsets which is used by the new Consumer API, meaning clients do not have to manage offsets directly or rely on ZooKeeper)). NATS Streaming allows clients to either track their sequence number or use a durable subscription, which causes the server to track the last acknowledged message for a client. If the client restarts, the server will resume delivery starting at the earliest unacknowledged message. This is closer to what you would expect from a traditional message-oriented middleware like RabbitMQ.

Lastly, NATS Streaming supports publisher and subscriber rate limiting. This works by configuring the maximum number of in-flight (unacknowledged) messages either from the publisher to the server or from the server to the subscriber. Starting in version 0.9, Kafka supports a similar rate limiting feature that allows producer and consumer byte-rate thresholds to be defined for groups of clients with its Quotas protocol.

Kafka was designed to avoid tracking any client state on the server for performance and scalability reasons. Throughput and storage capacity scale linearly with the number of nodes. NATS Streaming provides some additional features over Kafka at the cost of some added state on the server. Since clustering isn’t supported, there isn’t really any scale or HA story yet, so it’s unclear how that will play out. That said, once replication is supported, there’s a lot of work going into verifying its correctness (which is a major advantage Kafka has).

Benchmarks

Since NATS Streaming does not support replication at this time (0.3.1), we’ll compare running a single instance of it with file-backed persistence to running a single instance of Kafka (0.10.1.0). We’ll look at both latency and throughput running on commodity hardware (m4.xlarge EC2 instances) with load generation and consumption each running on separate instances. In all of these benchmarks, the systems under test have not been tuned at all and are essentially in their “off-the-shelf” configurations.

We’ll first look at latency by publishing messages of various sizes, ranging from 256 bytes to 1MB, at a fixed rate of 50 messages/second for 30 seconds. Message contents are randomized to account for compression. We then plot the latency distribution by percentile on a logarithmic scale from the 0th percentile to the 99.9999th percentile. Benchmarks are run several times in an attempt to produce a “normalized” result. The benchmark code used is open source.

First, to establish a baseline and later get a feel for the overhead added by the file system, we’ll benchmark NATS Streaming with in-memory storage, meaning messages are not written to disk.

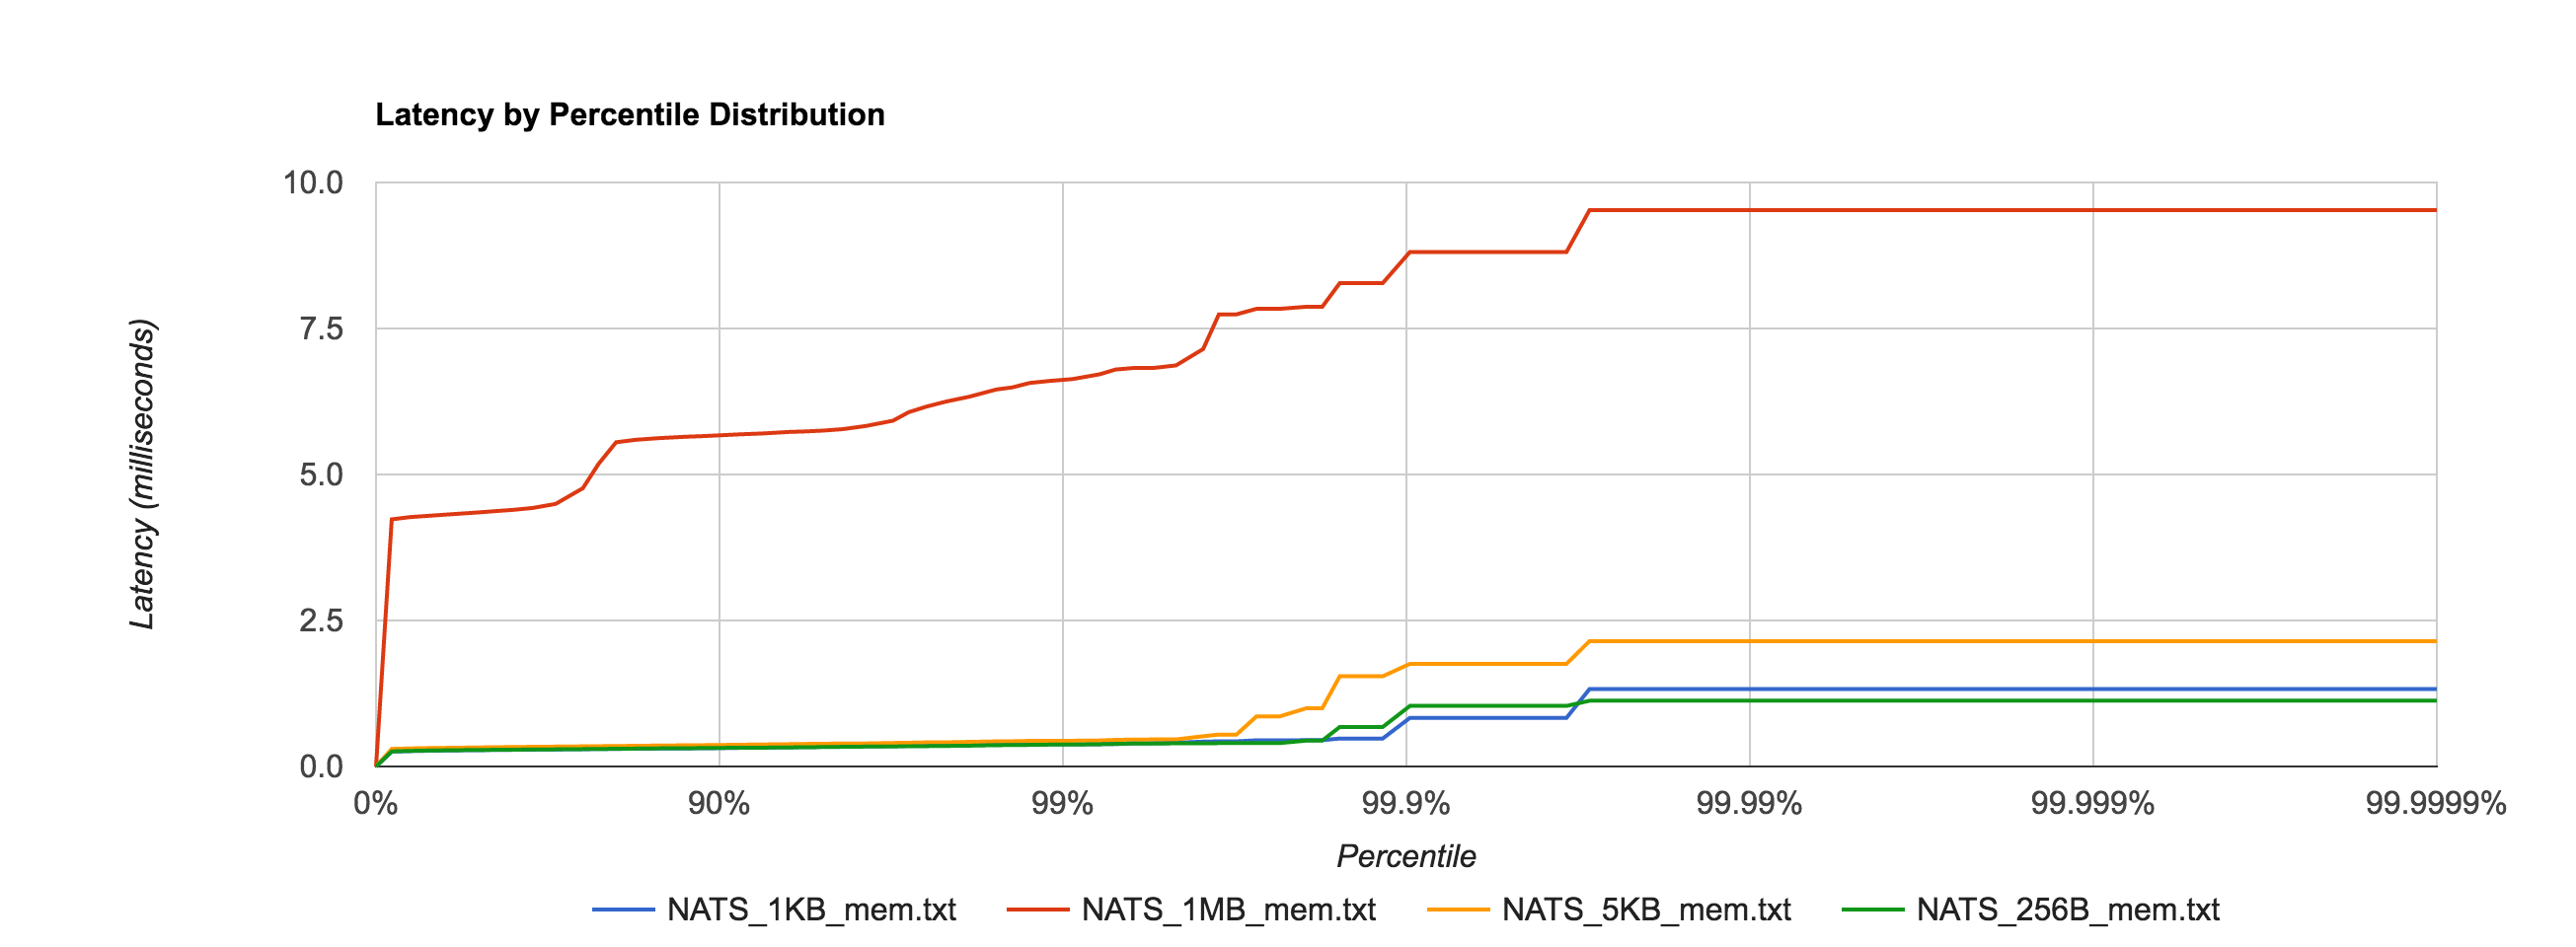
Unsurprisingly, the 1MB configuration has much higher latencies than the other configurations, but everything falls within single-digit-millisecond latencies.nats_mem

NATS Streaming 0.3.1 (in-memory persistence)

 Size 99% 99.9% 99.99% 99.999% 99.9999% 
256B 0.3750ms 1.0367ms 1.1257ms 1.1257ms 1.1257ms
1KB 0.38064ms 0.8321ms 1.3260ms 1.3260ms 1.3260ms
5KB 0.4408ms 1.7569ms 2.1465ms 2.1465ms 2.1465ms
1MB 6.6337ms 8.8097ms 9.5263ms 9.5263ms 9.5263ms

Next, we look at NATS Streaming with file-backed persistence. This provides the same durability guarantees as Kafka running with a replication factor of 1. By default, Kafka stores logs under /tmp. Many Unix distributions mount /tmp to tmpfs which appears as a mounted file system but is actually stored in volatile memory. To account for this and provide as level a playing field as possible, we configure NATS Streaming to also store its logs in /tmp.

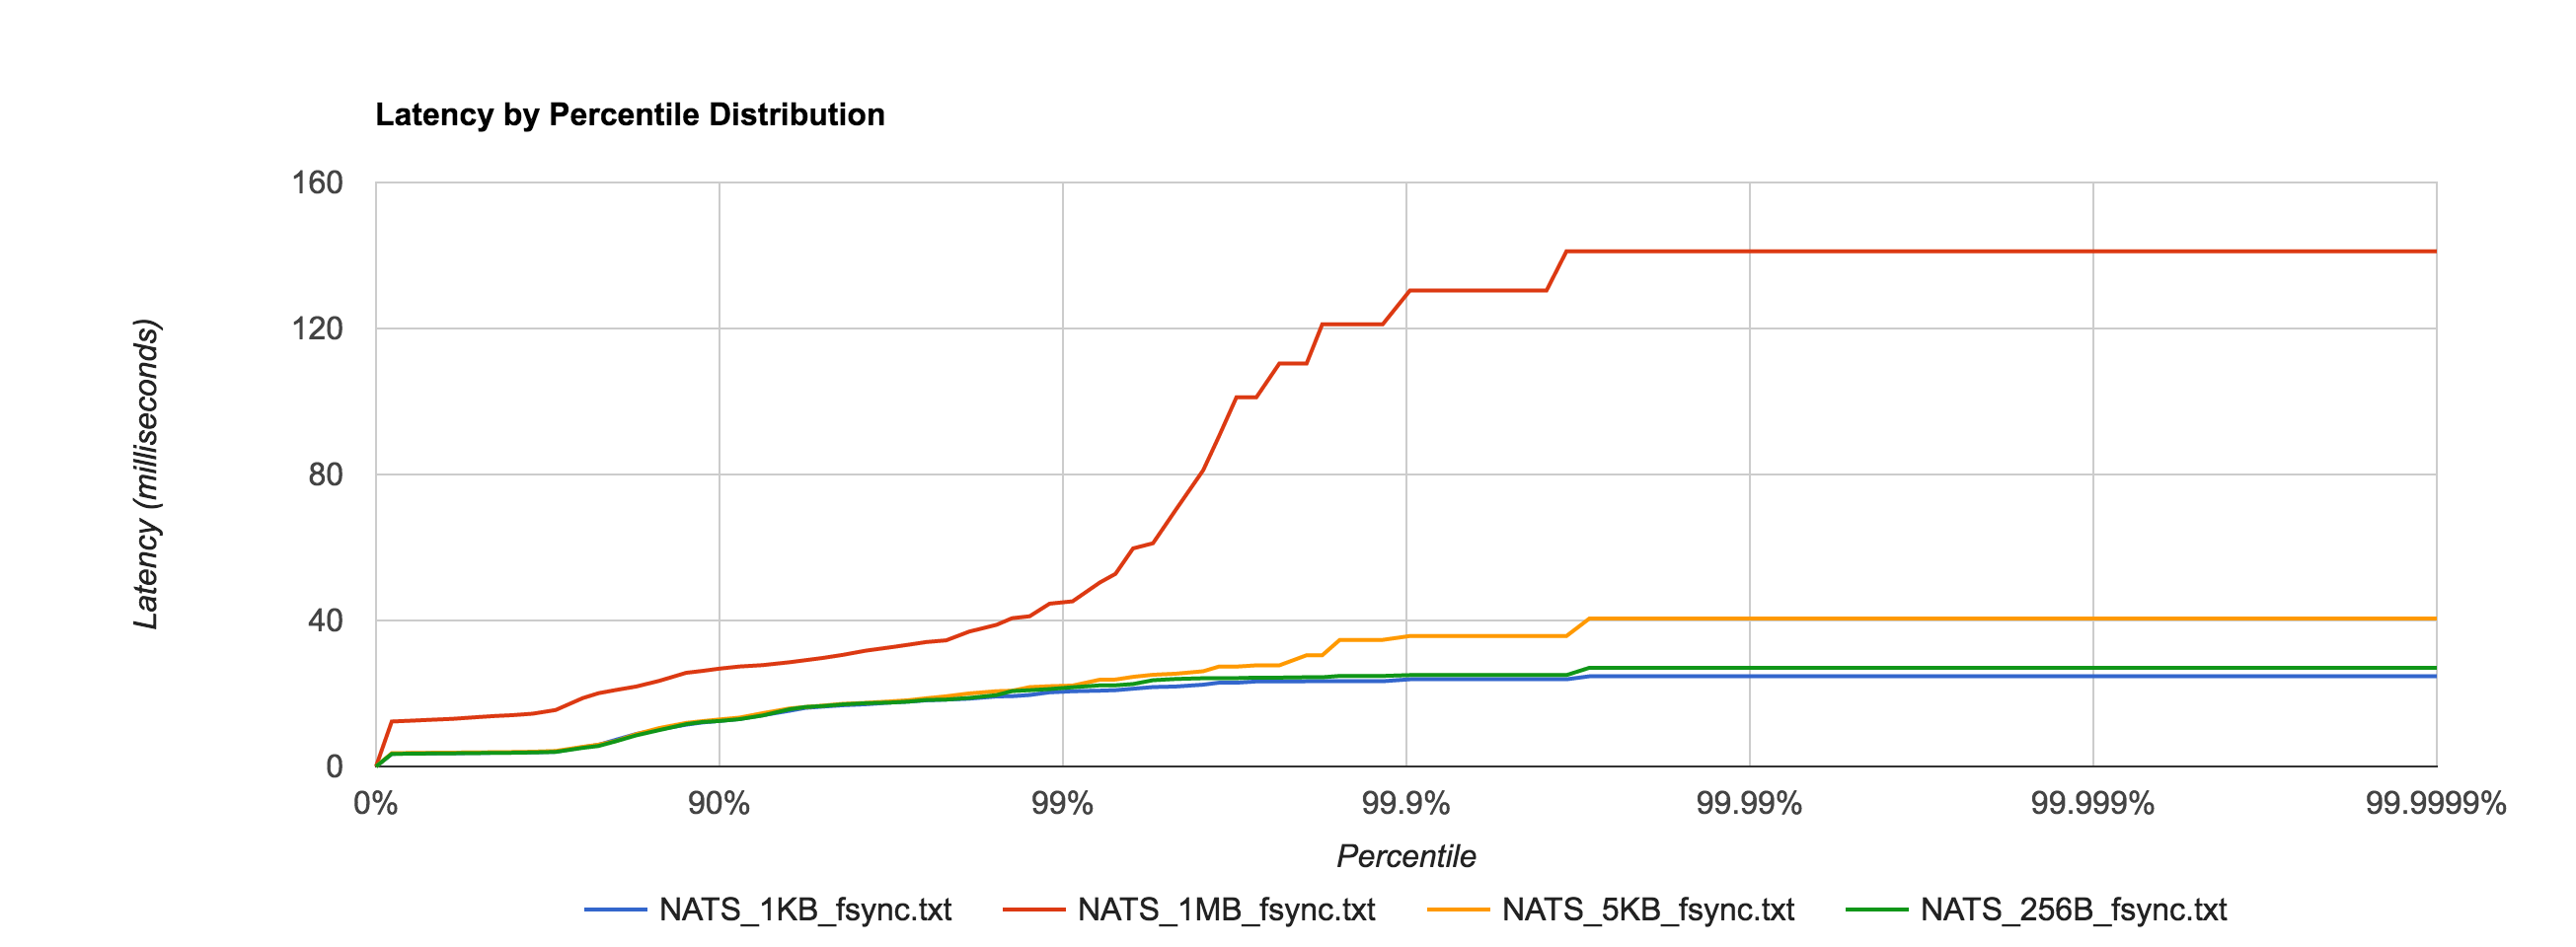
As expected, latencies increase by about an order of magnitude once we start going to disk.

nats_file_fsync

NATS Streaming 0.3.1 (file-backed persistence)

 Size 99% 99.9% 99.99% 99.999% 99.9999% 
256B 21.7051ms 25.0369ms 27.0524ms 27.0524ms 27.0524ms
1KB 20.6090ms 23.8858ms 24.7124ms 24.7124ms 24.7124ms
5KB 22.1692ms 35.7394ms 40.5612ms 40.5612ms 40.5612ms
1MB 45.2490ms 130.3972ms 141.1564ms 141.1564ms 141.1564ms

Since we will be looking at Kafka, there is an important thing to consider relating to fsync behavior. As of version 0.8, Kafka does not call fsync directly and instead relies entirely on the background flush performed by the OS. This is clearly indicated by their documentation:

We recommend using the default flush settings which disable application fsync entirely. This means relying on the background flush done by the OS and Kafka’s own background flush. This provides the best of all worlds for most uses: no knobs to tune, great throughput and latency, and full recovery guarantees. We generally feel that the guarantees provided by replication are stronger than sync to local disk, however the paranoid still may prefer having both and application level fsync policies are still supported.

However, NATS Streaming calls fsync every time a batch is written to disk by default. This can be disabled through the use of the –file_sync flag. By setting this flag to false, we put NATS Streaming’s persistence behavior closer in line with Kafka’s (again assuming a replication factor of 1).

As an aside, the comparison between NATS Streaming and Kafka still isn’t completely “fair”. Jay Kreps points out that Kafka relies on replication as the primary means of durability.

Kafka leaves [fsync] off by default because it relies on replication not fsync for durability, which is generally faster. If you don’t have replication I think you probably need fsync and maybe some kind of high integrity file system.

I don’t think we can provide a truly fair comparison until NATS Streaming supports replication, at which point we will revisit this.

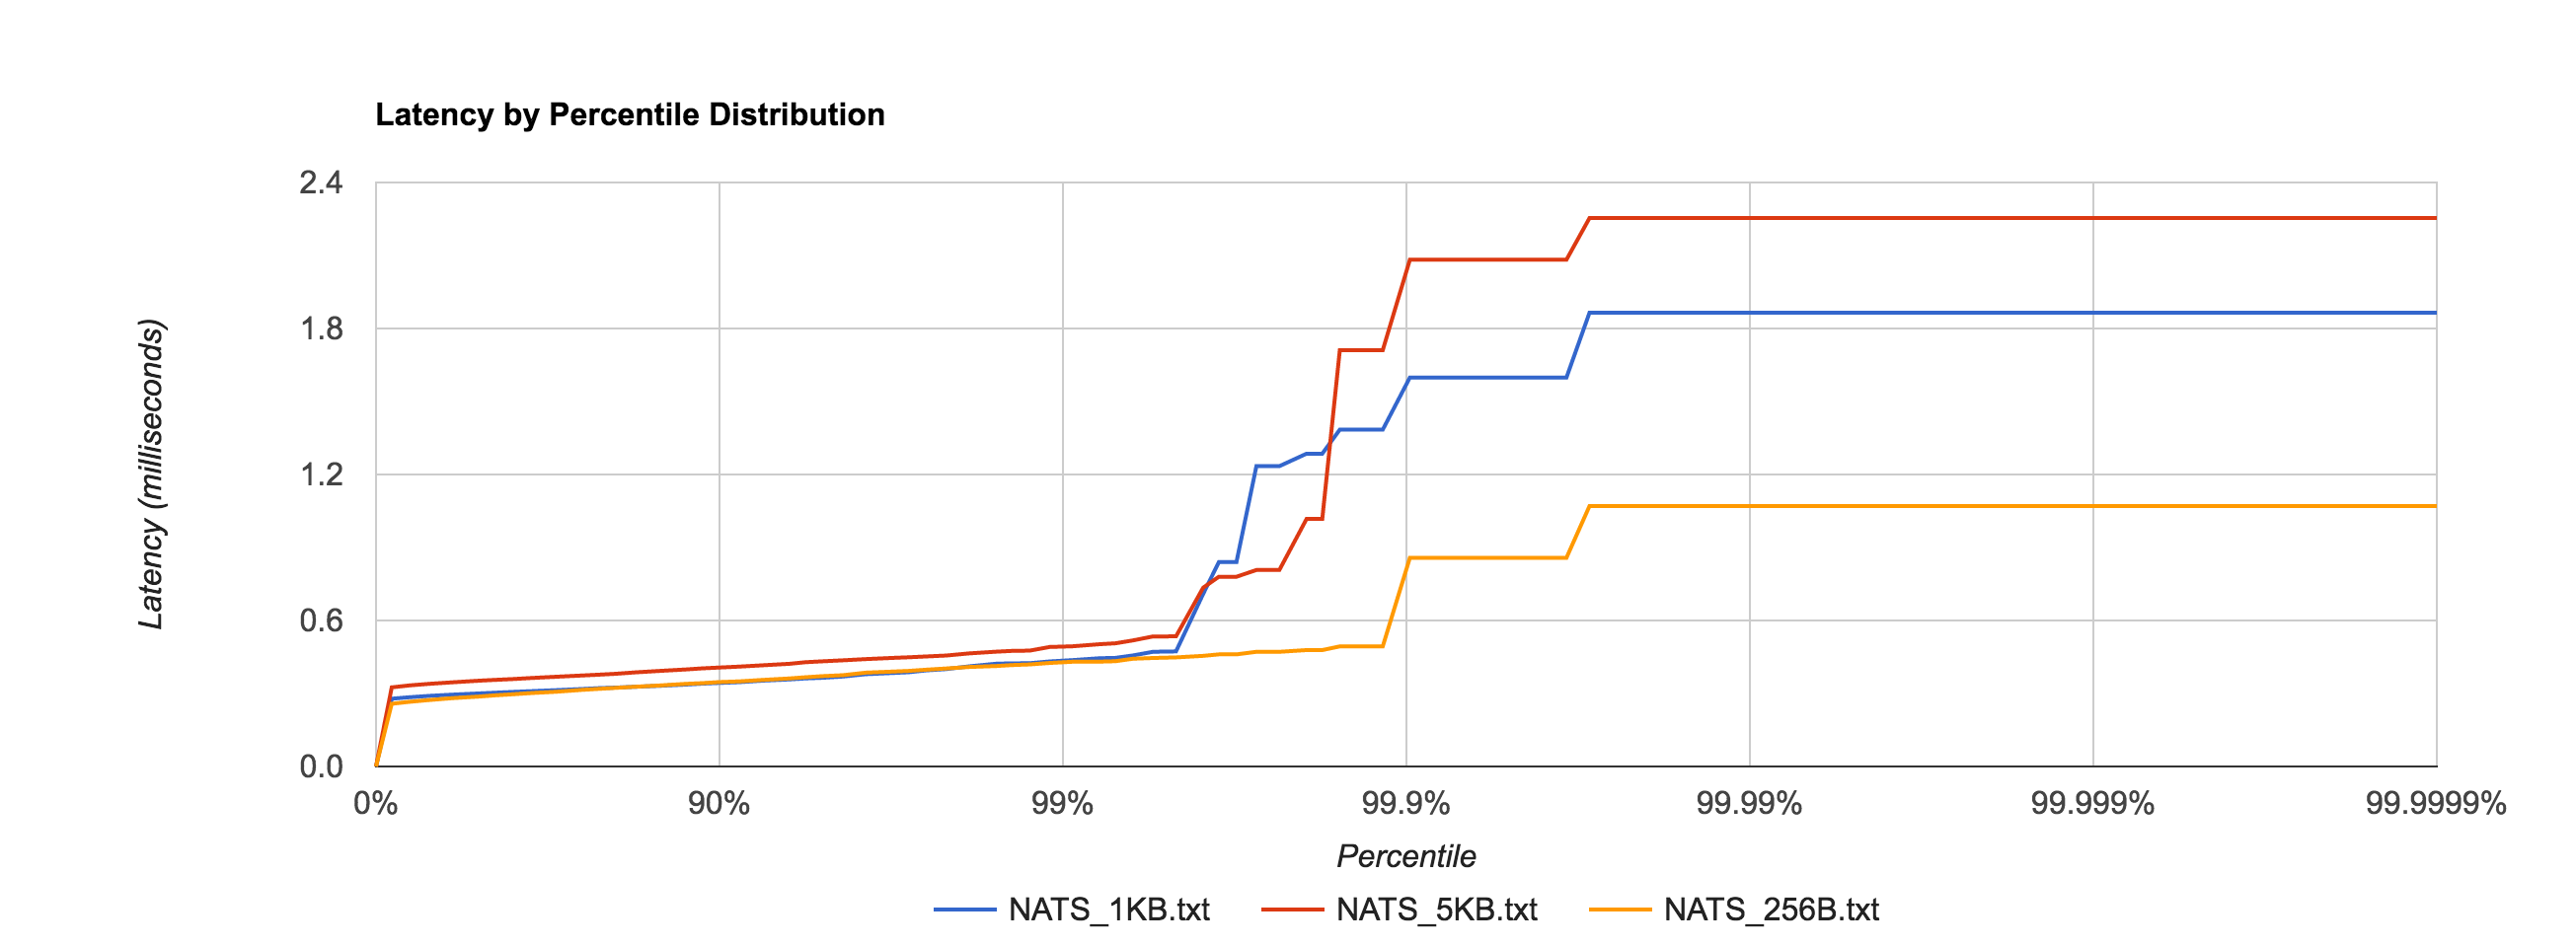
To no one’s surprise, setting –file_sync=false has a significant impact on latency, shown in the distribution below.

nats_file_no_fsync

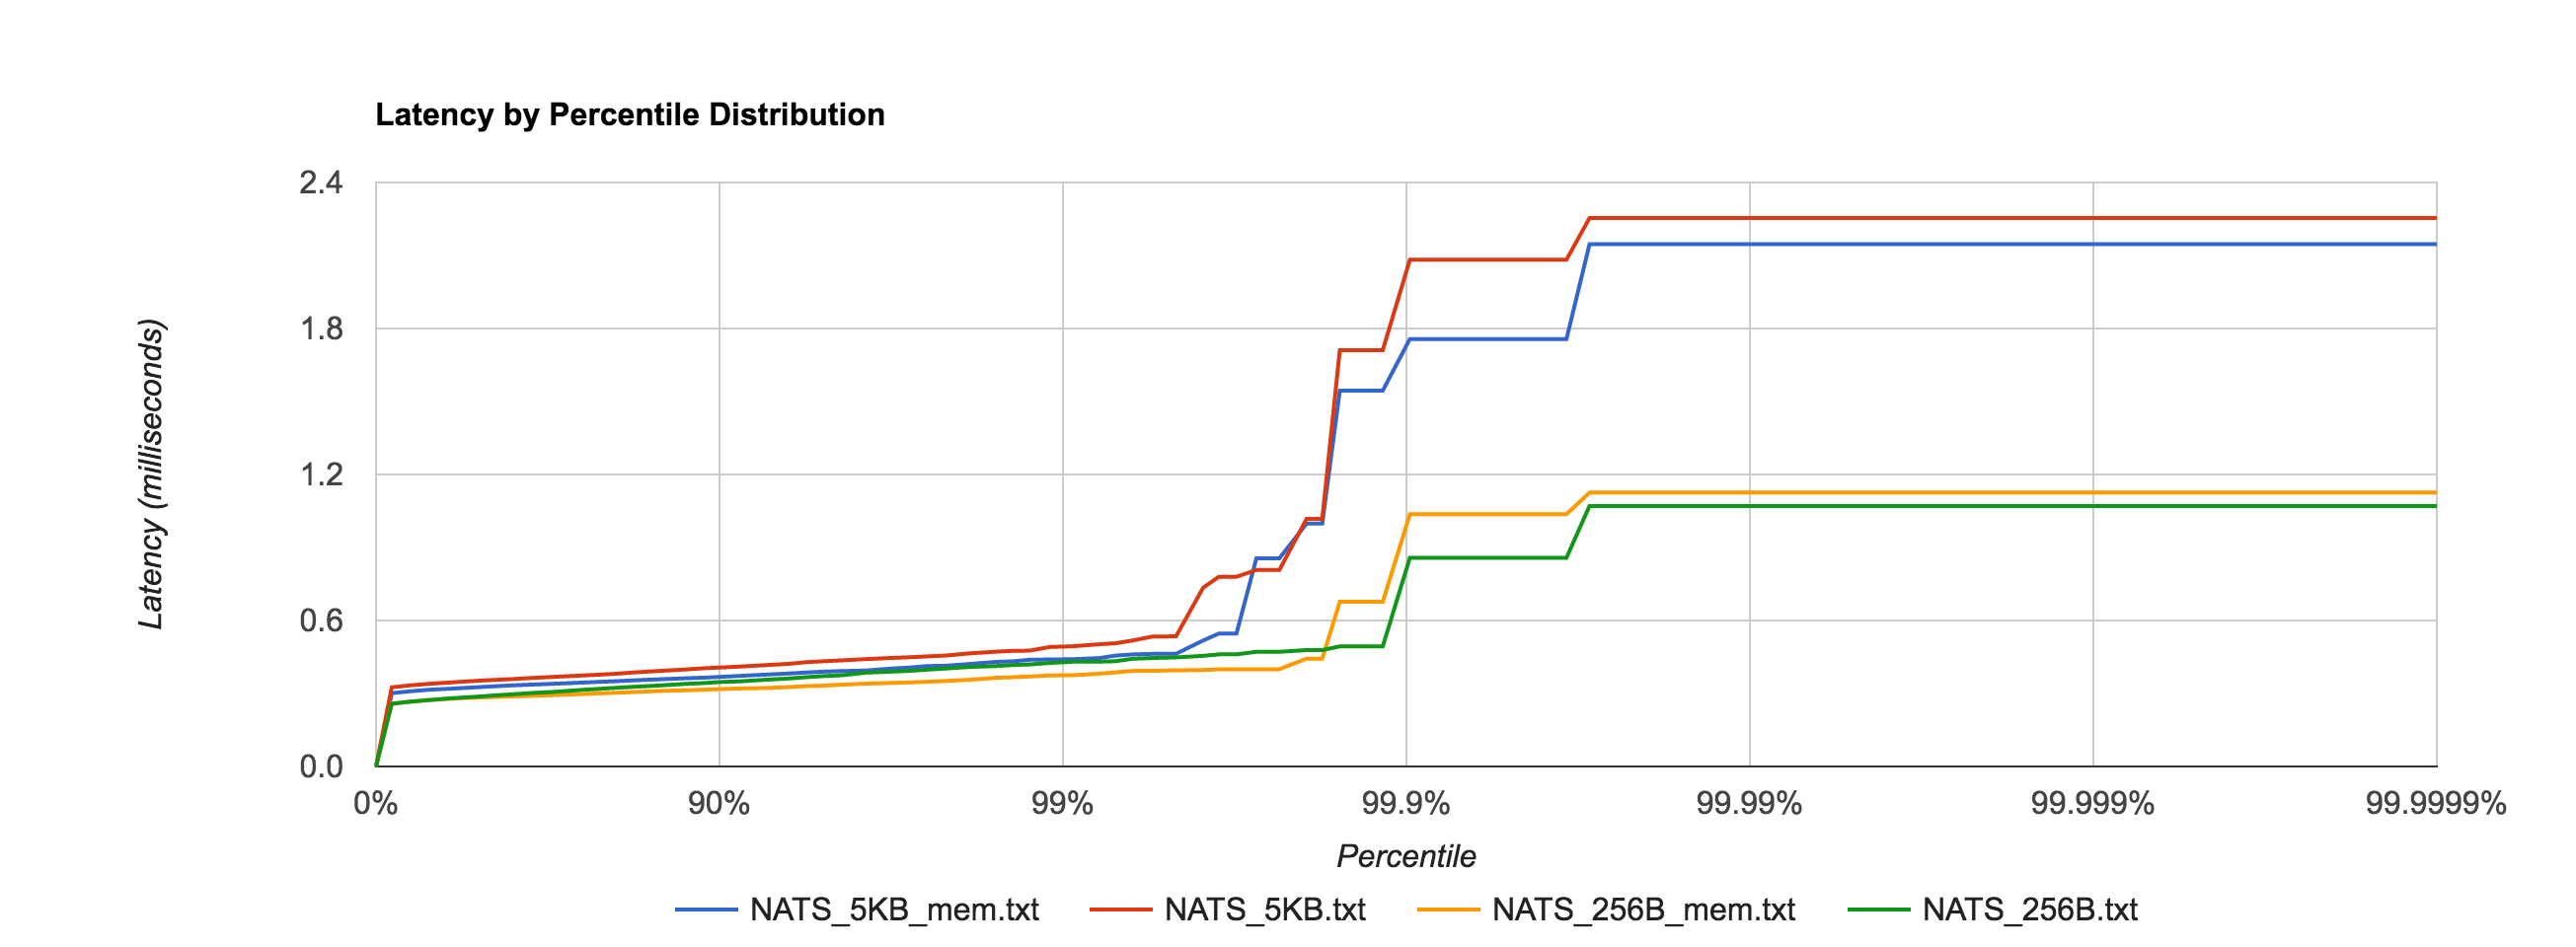
In fact, it’s now in line with the in-memory performance as before for 256B, 1KB, and 5KB messages, shown in the comparison below.

nats_file_mem

For a reason I have yet to figure out, the latency for 1MB messages is roughly an order of magnitude faster when fsync is enabled after the 95th percentile, which seems counterintuitive. If anyone has an explanation, I would love to hear it. I’m sure there’s a good debug story there. The distribution below shows the 1MB configuration for NATS Streaming with and without fsync enabled and just how big the difference is at the 95th percentile and beyond.

nats_file_mem_1mb

NATS Streaming 0.3.1 (file-backed persistence, –file_sync=false)

 Size 99% 99.9% 99.99% 99.999% 99.9999% 
256B 0.4304ms 0.8577ms 1.0706ms 1.0706ms 1.0706ms
1KB 0.4372ms 1.5987ms 1.8651ms 1.8651ms 1.8651ms
5KB 0.4939ms 2.0828ms 2.2540ms 2.2540ms 2.2540ms
1MB 1296.1464ms 1556.1441ms 1596.1457ms 1596.1457ms 1596.1457ms

Kafka with replication factor 1 tends to have higher latencies than NATS Streaming with –file_sync=false. There was one potential caveat here Ivan Kozlovic pointed out to me in that NATS Streaming uses a caching optimization for reads that may put it at an advantage.

Now, there is one side where NATS Streaming *may* be looking better and not fair to Kafka. By default, the file store keeps everything in memory once stored. This means look-ups will be fast. There is only a all-or-nothing mode right now, which means either cache everything or nothing. With caching disabled (–file_cache=false), every lookup will result in disk access (which when you have 1 to many subscribers will be bad). I am working on changing that. But if you do notice that in Kafka, consuming results in a disk read (given the other default behavior described above, they actually may not ;-)., then you could disable NATS Streaming file caching.

Fortunately, we can verify if Kafka is actually going to disk to read messages back from the log during the benchmark using iostat. We see something like this for the majority of the benchmark duration:

avg-cpu:  %user   %nice %system %iowait  %steal   %idle
          13.53    0.00   11.28    0.00    0.00   75.19

Device:    tps   Blk_read/s   Blk_wrtn/s   Blk_read   Blk_wrtn
xvda      0.00         0.00         0.00          0          0

Specifically, we’re interested in Blk_read, which indicates the total number of blocks read. It appears that Kafka does indeed make heavy use of the operating system’s page cache as Blk_wrtn and Blk_read rarely show any activity throughout the entire benchmark. As such, it seems fair to leave NATS Streaming’s –file_cache=true, which is the default.

One interesting point is Kafka offloads much of its caching to the page cache and outside of the JVM heap, clearly in an effort to minimize GC pauses. I’m not clear if the cache Ivan refers to in NATS Streaming is off-heap or not (NATS Streaming is written in Go which, like Java, is a garbage-collected language).

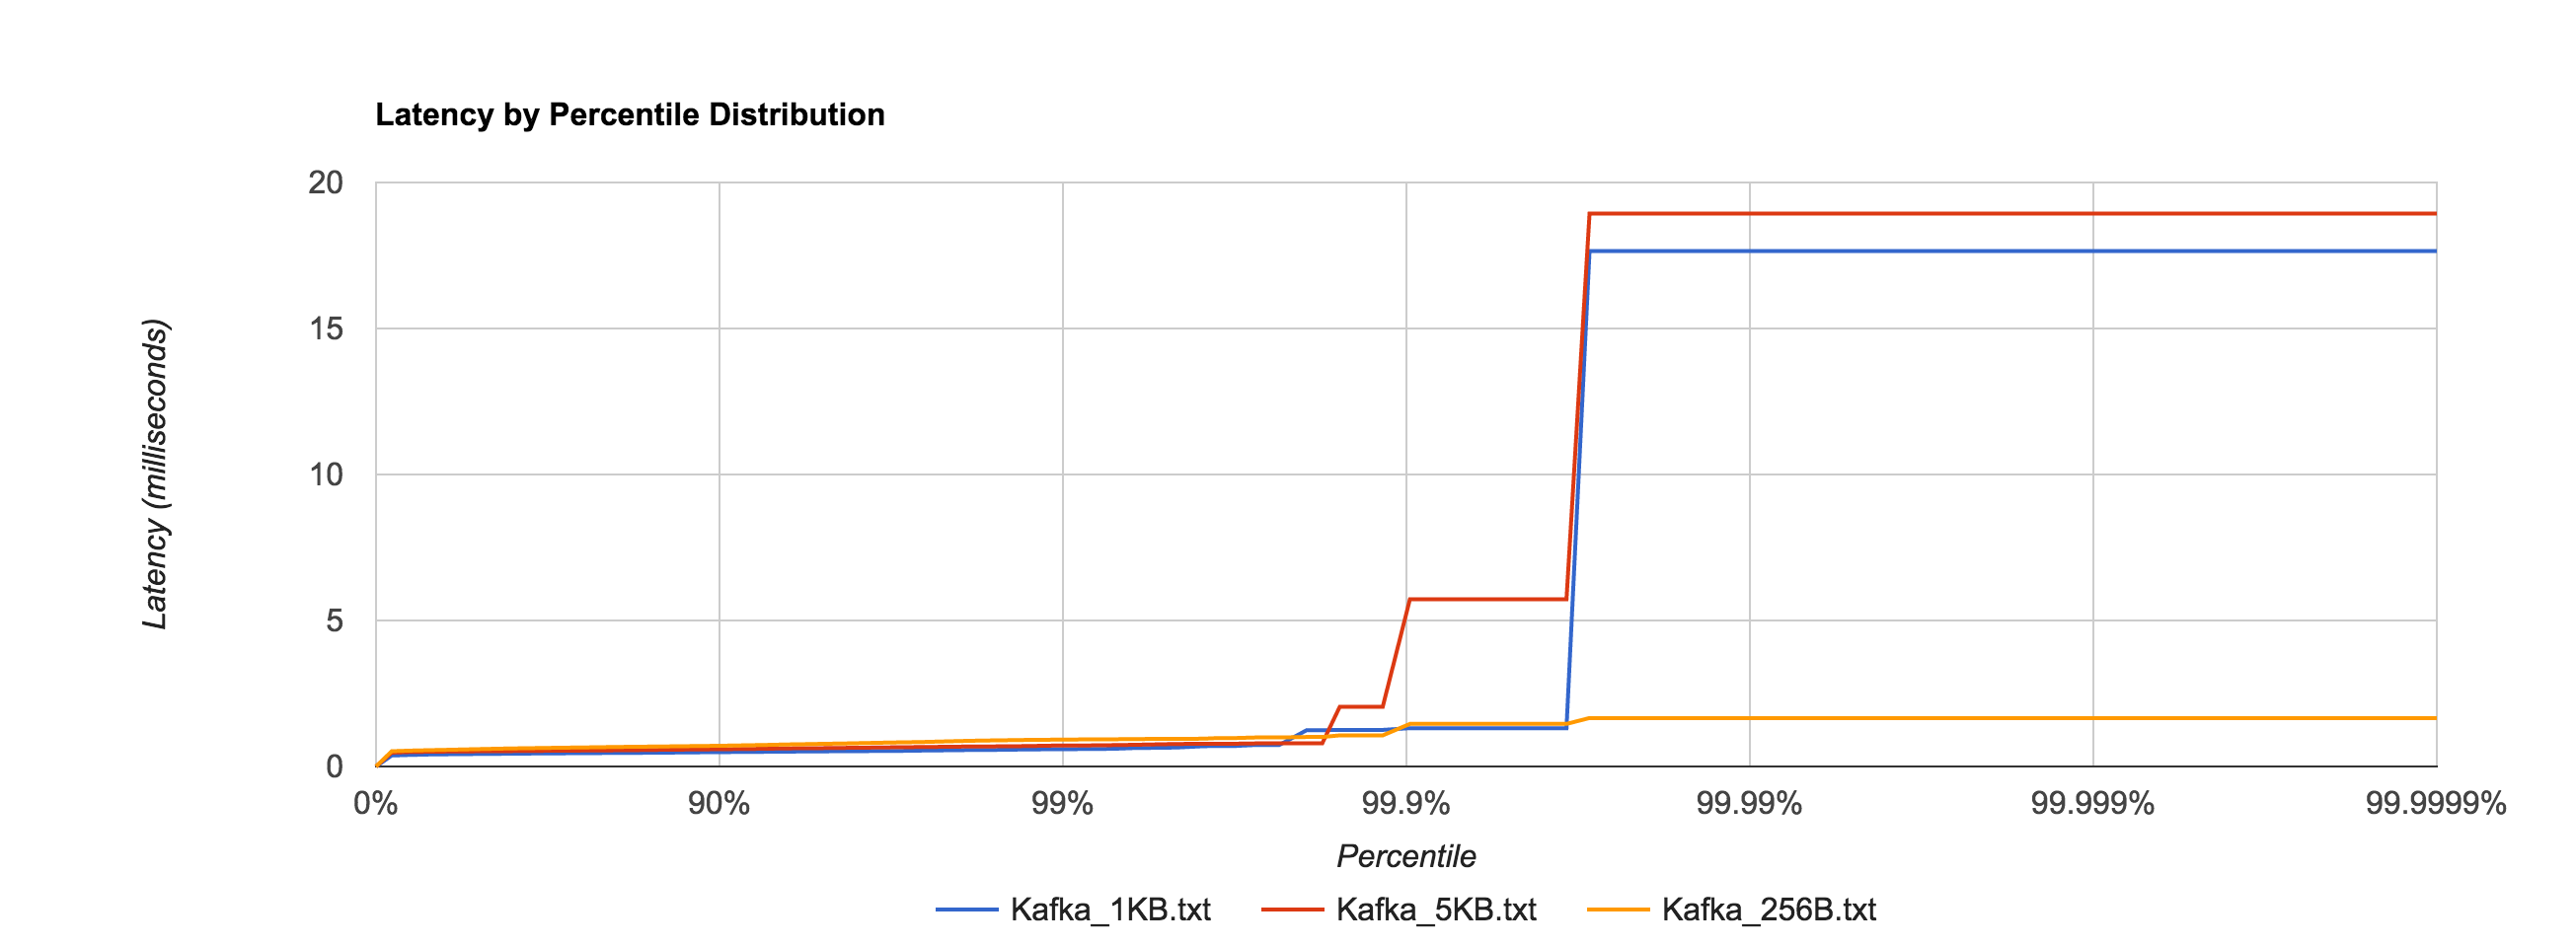
Below is the distribution of latencies for 256B, 1KB, and 5KB configurations in Kafka.

kafka

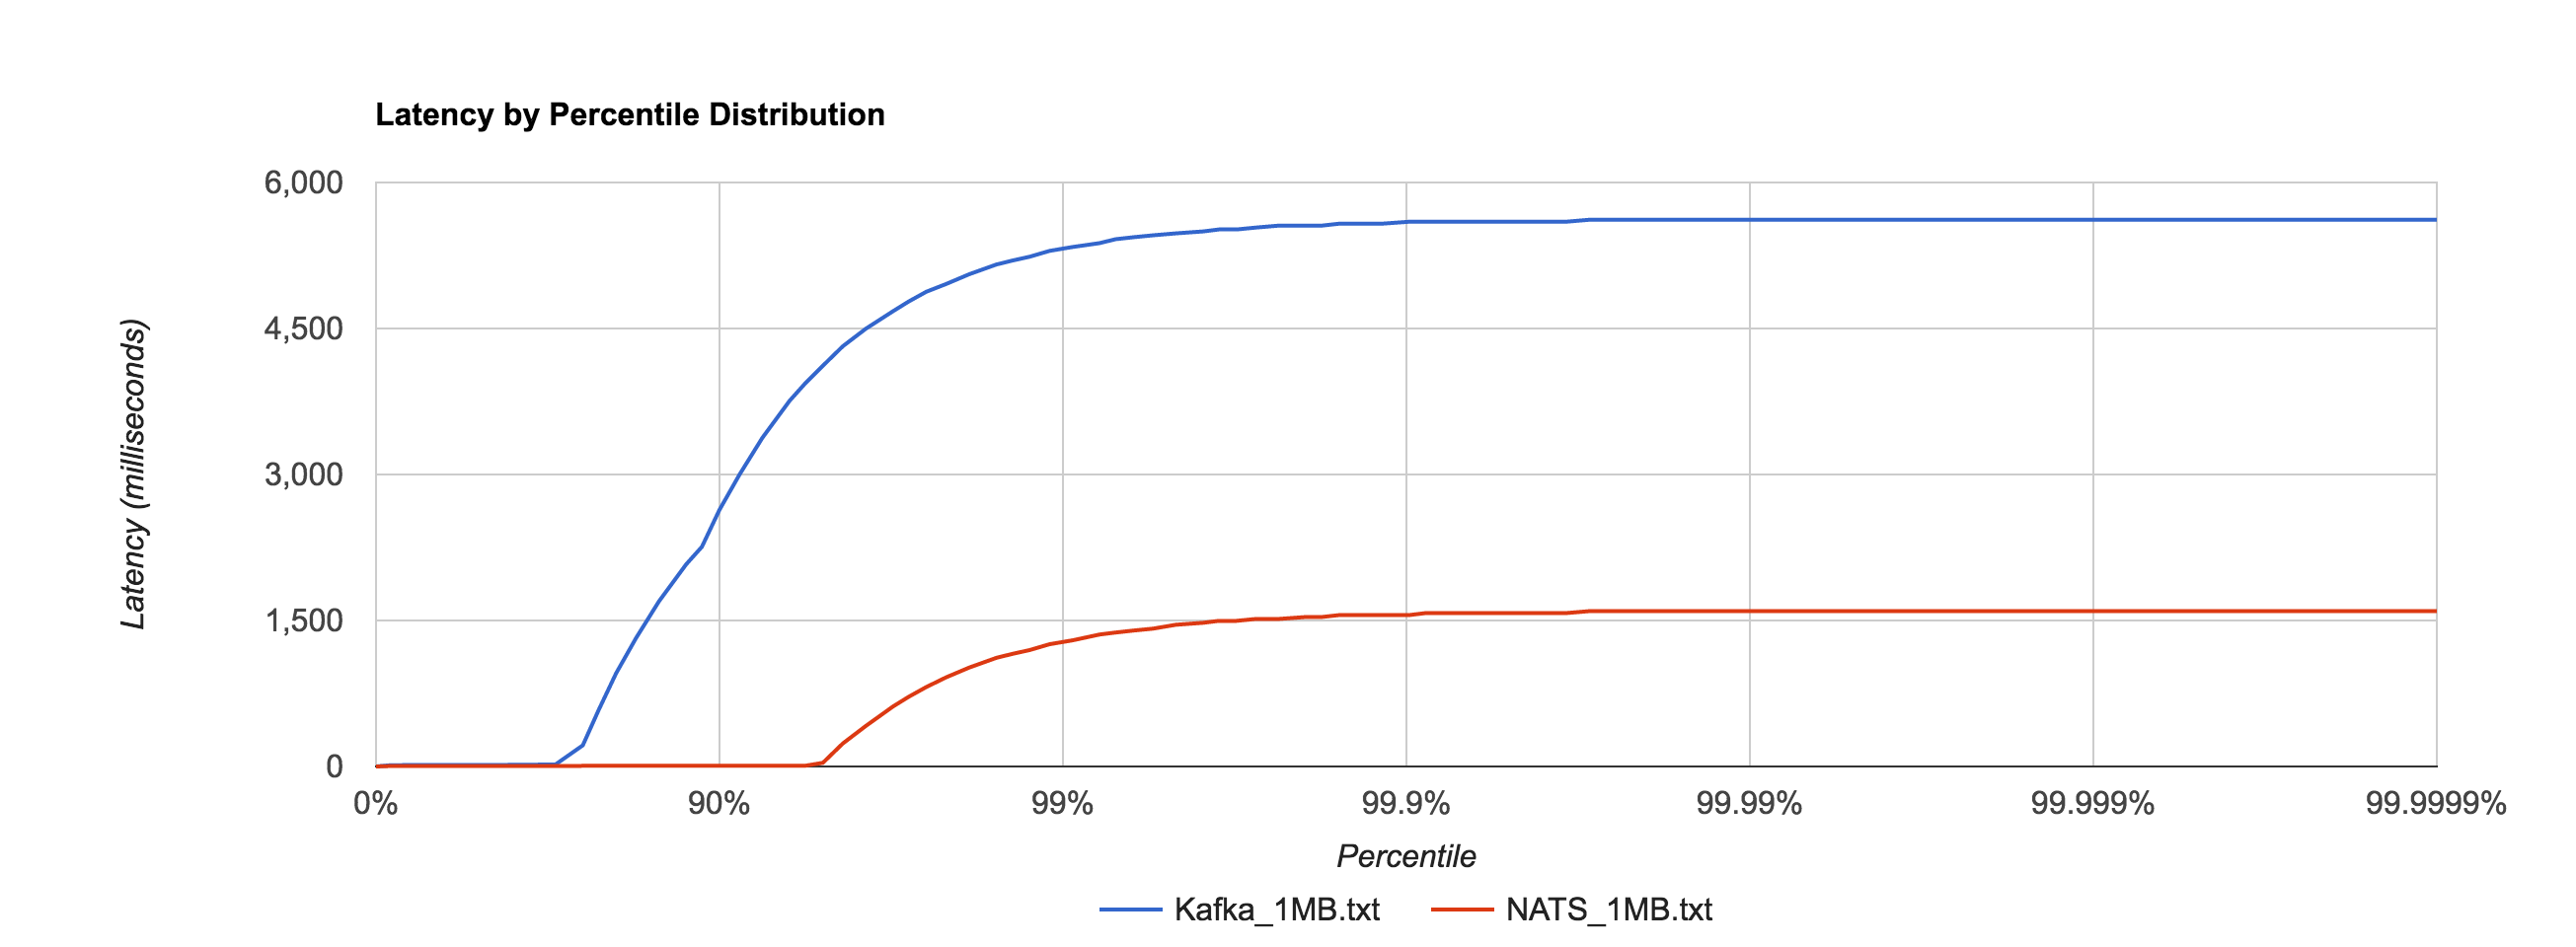
Similar to NATS Streaming, 1MB message latencies tend to be orders of magnitude worse after about the 80th percentile. The distribution below compares the 1MB configuration for NATS Streaming and Kafka.

nats_kafka_1mb

Kafka 0.10.1.0 (replication factor 1)

 Size 99% 99.9% 99.99% 99.999% 99.9999% 
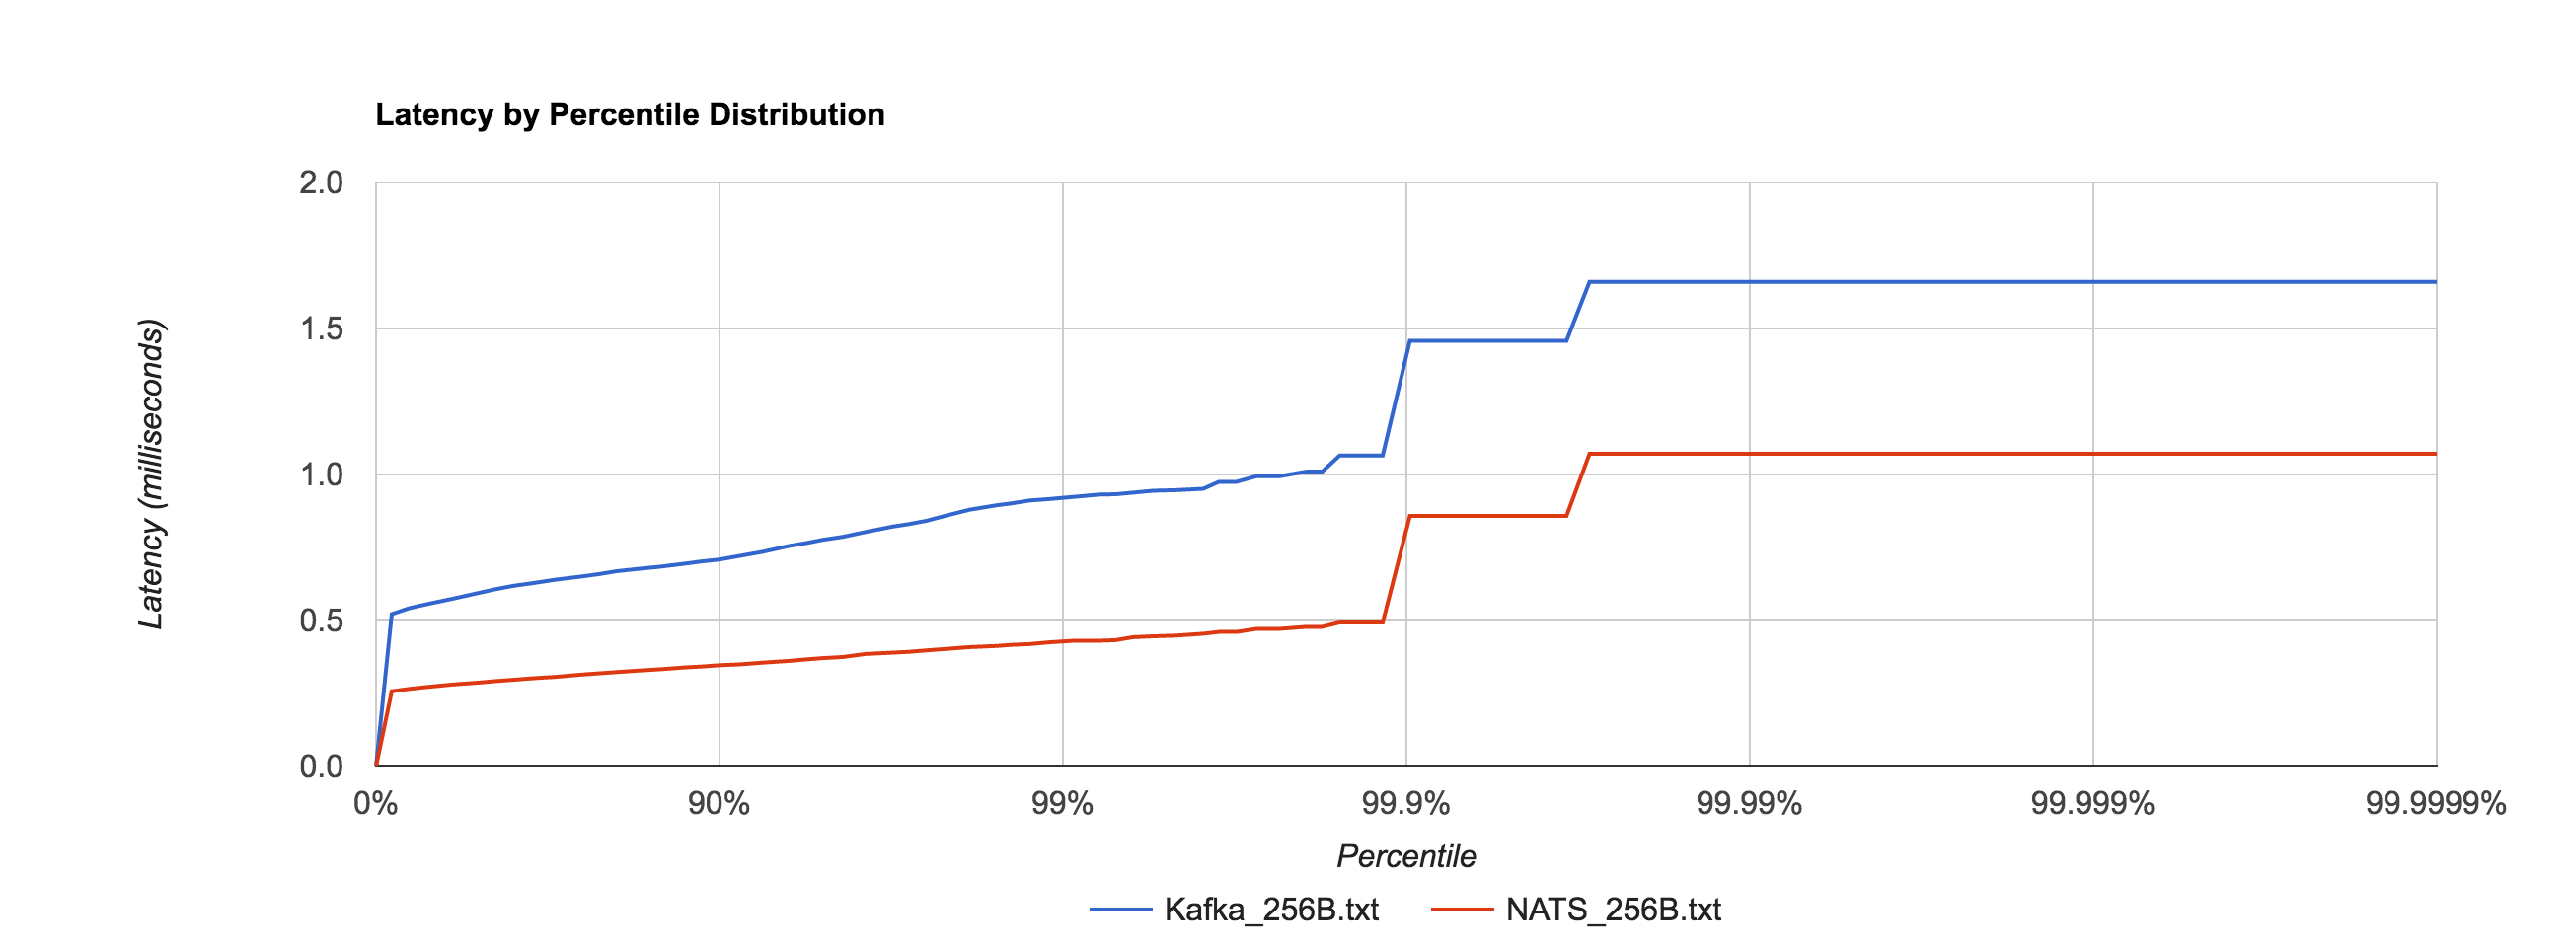
256B 0.9230ms 1.4575ms 1.6596ms 1.6596ms 1.6596ms
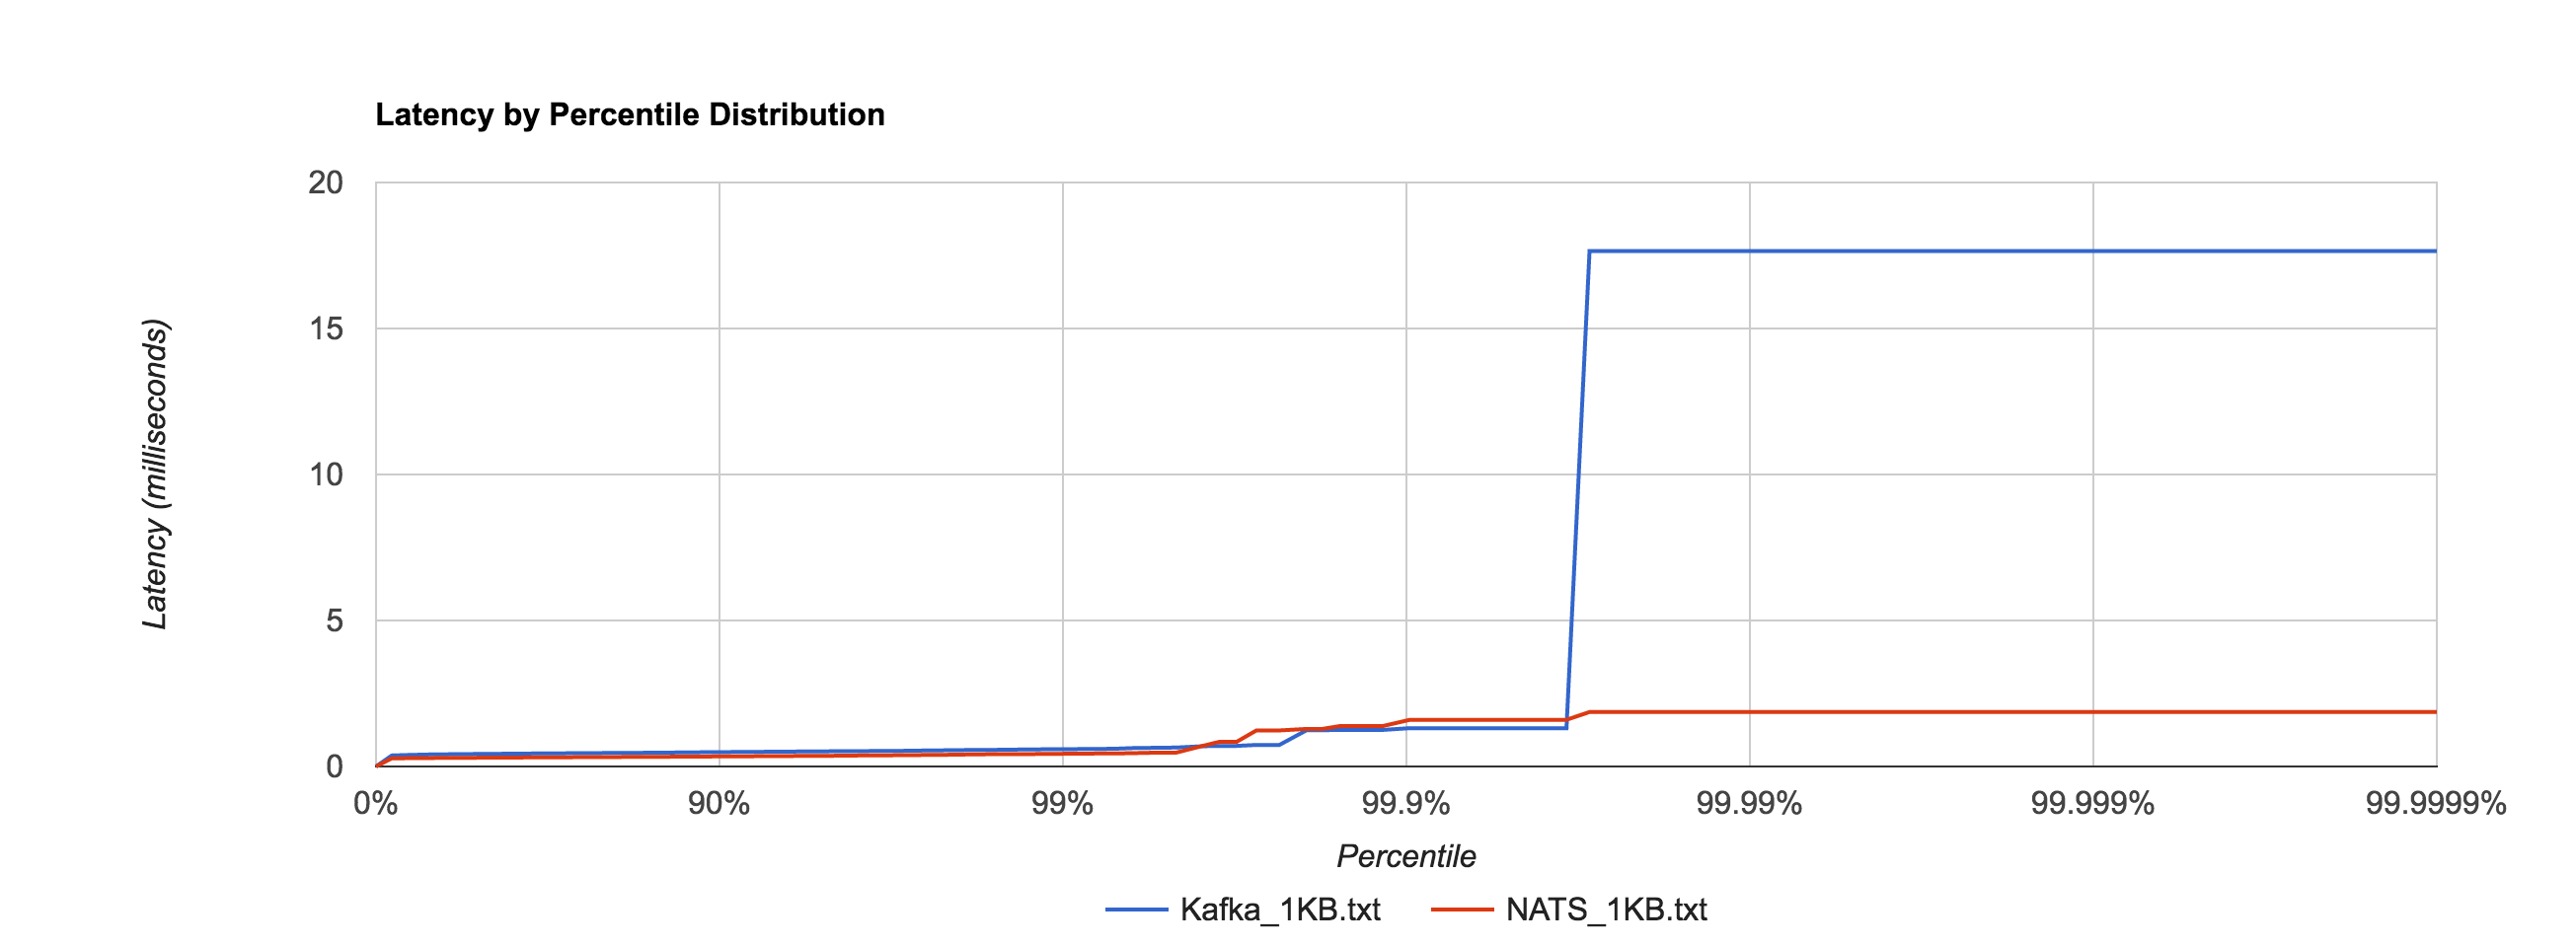
1KB 0.5942ms 1.3123ms 17.6556ms 17.6556ms 17.6556ms
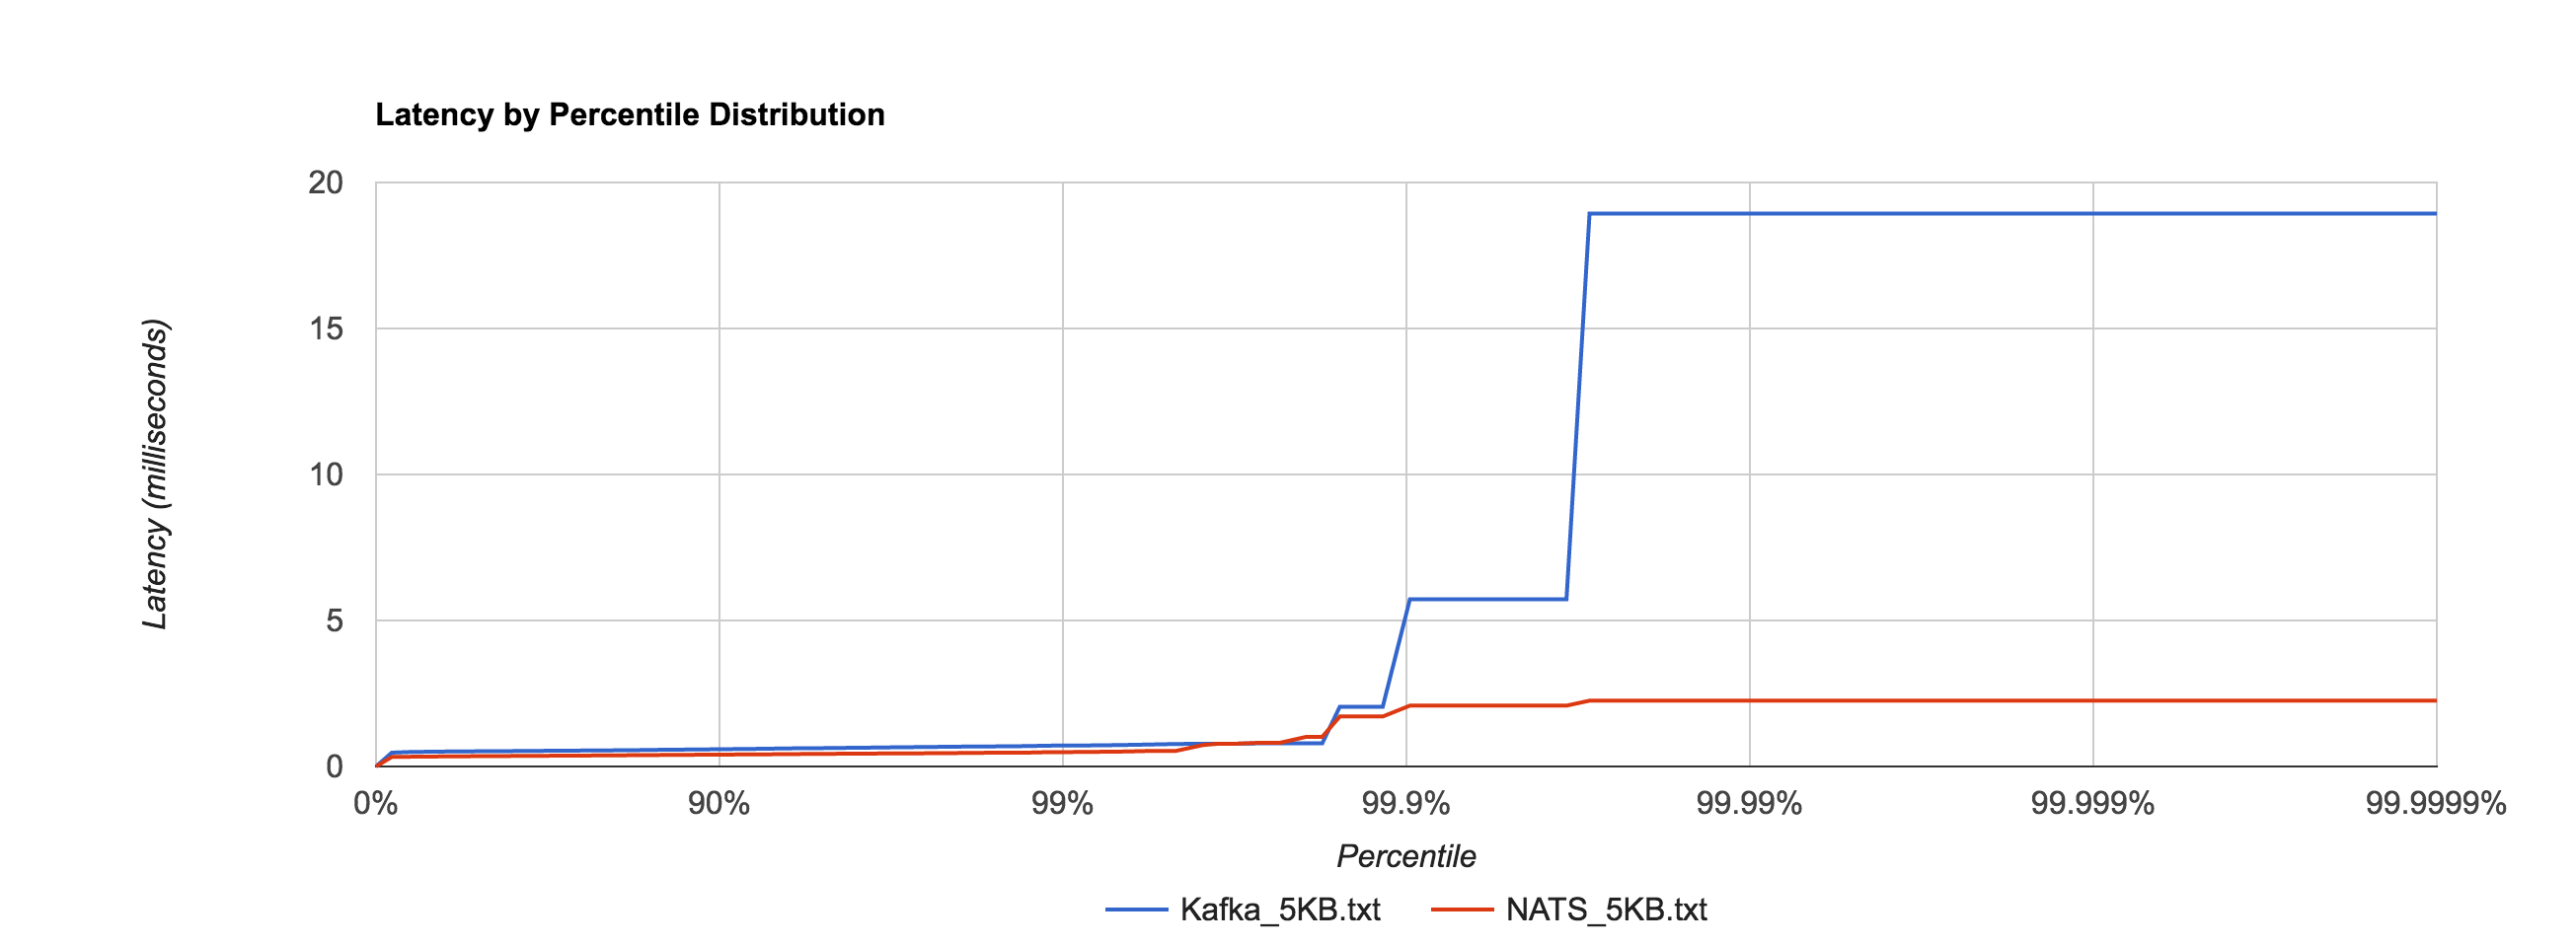
5KB 0.7203ms 5.7236ms 18.9334ms 18.9334ms 18.9334ms
1MB 5337.3174ms 5597.3315ms 5617.3199ms 5617.3199ms 5617.3199ms

The percentile distributions below compare NATS Streaming and Kafka for the 256B, 1KB, and 5KB configurations, respectively.

nats_kafka_256b

nats_kafka_1kb

nats_kafka_5kb

Next, we’ll look at overall throughput for the two systems. This is done by publishing 100,000 messages using the same range of sizes as before and measuring the elapsed time. Specifically, we measure throughput at the publisher and the subscriber.

Despite using an asynchronous publisher in both the NATS Streaming and Kafka benchmarks, we do not consider the publisher “complete” until it has received acks for all published messages from the server. In Kafka, we do this by setting request.required.acks to 1, which means the leader replica has received the data, and consuming the received acks. This is important because the default value is 0, which means the producer never waits for an ack from the broker. In NATS Streaming, we provide an ack callback on every publish. We use the same benchmark configuration as the latency tests, separating load generation and consumption on different EC2 instances. Note the log scale in the following charts.

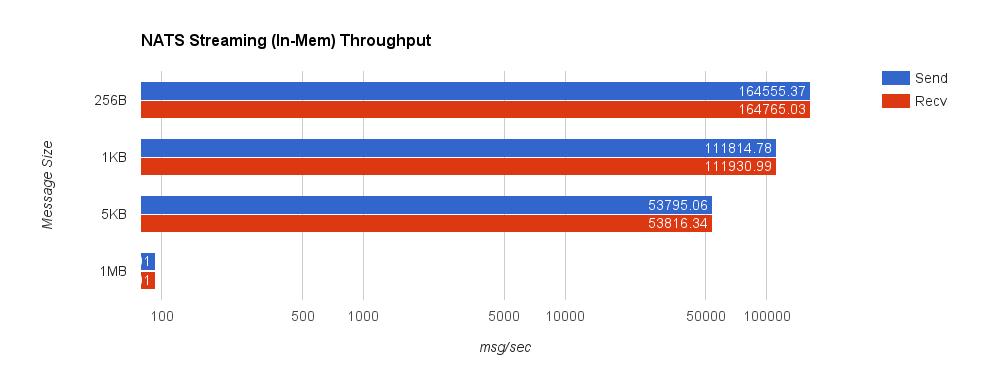
Once again, we’ll start by looking at NATS Streaming using in-memory persistence. The truncated 1MB send and receive throughputs are 93.01 messages/second.

nats_mem_throughput

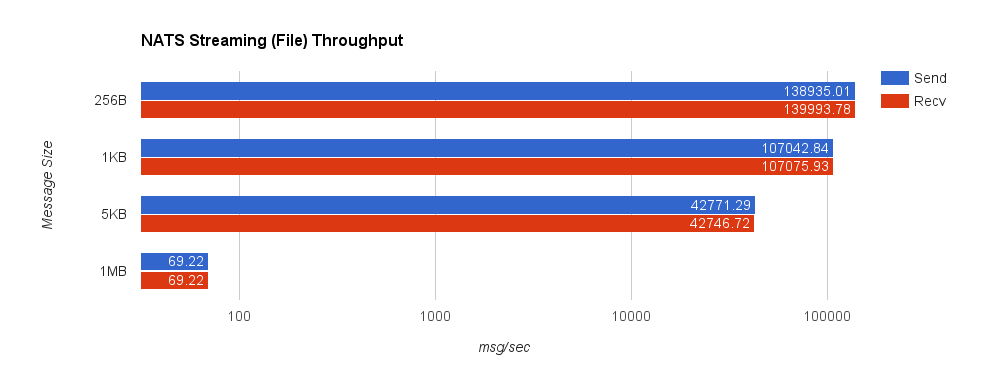
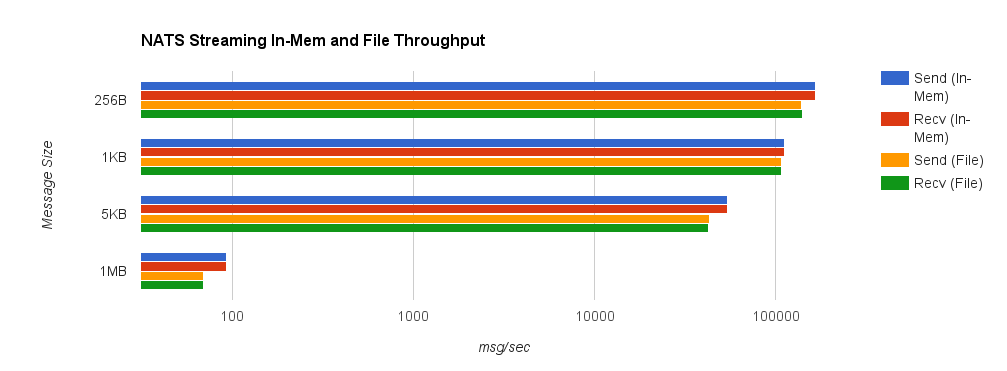
For comparison, we now look at NATS Streaming with file persistence and –file_sync=false. As before, this provides the closest behavior to Kafka’s default flush behavior. The second chart shows a side-by-side comparison between NATS Streaming with in-memory and file persistence.

nats_file_throughput

nats_compare_throughput

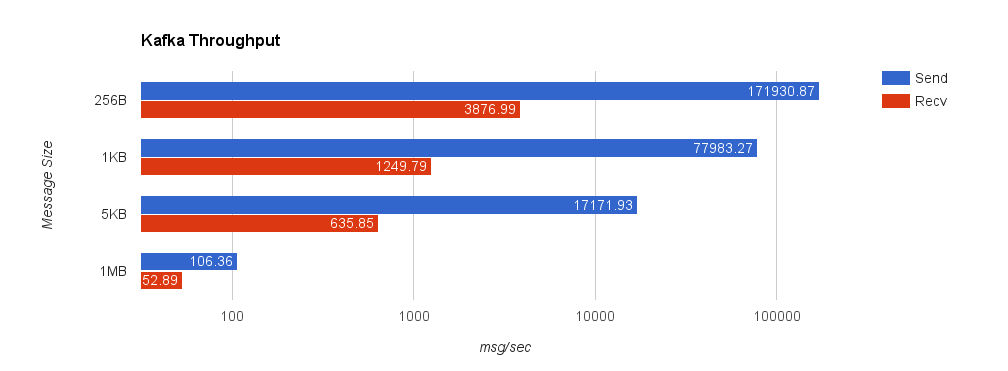
Lastly, we look at Kafka with replication factor 1. Throughput significantly deteriorates when we set request.required.acks = 1 since the producer must wait for all acks from the server. This is important though because, by default, the client does not require an ack from the server. If this were the case, the producer would have no idea how much data actually reached the server once it finished—it could simply be buffered in the client, in flight over the wire, or in the server but not yet on disk. Running the benchmark with request.required.acks = 0 yields much higher throughput on the sender but is basically an exercise in how fast you can write to a channel using the Sarama Go client—slightly misleading.

kafka_throughput

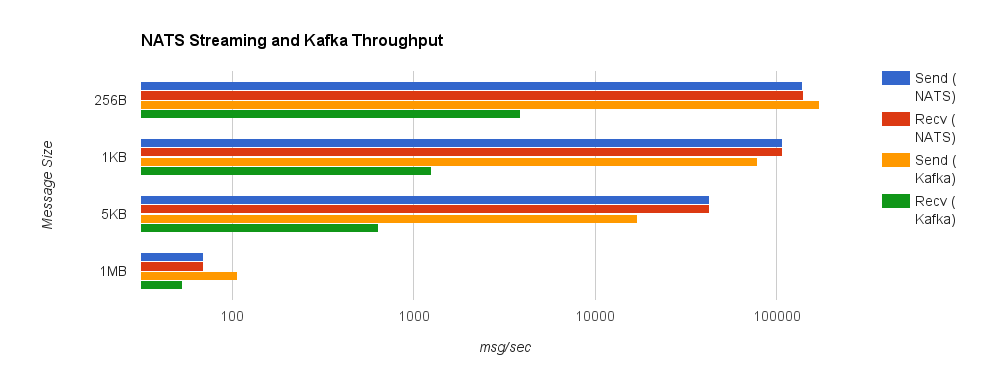
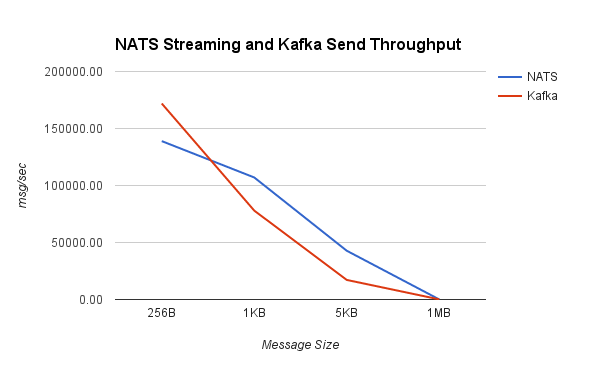
Looking at some comparisons of Kafka and NATS Streaming, we can see that NATS Streaming has higher throughput in all but a few cases.

nats_kafka_throughput

nats_kafka_send_throughput

I want to repeat the disclaimer from before: the purpose of this benchmark is to test drive the newly released NATS Streaming system (which as mentioned earlier, doesn’t yet support clustering), and put its performance into context by looking at a similar configuration of Kafka.

Kafka generally scales very well, so measuring the throughput of a single broker with a single producer and single consumer isn’t particularly meaningful. In reality, we’d be running a cluster with several brokers and partitioning our topics across them.

For as young as it is, NATS Streaming has solid performance (which shouldn’t come as much of a surprise considering the history of NATS itself), and I imagine it will only get better with time as the NATS team continues to optimize. In some ways, NATS Streaming bridges the gap between the commit log as made popular by Kafka and the conventional message queue as made popular by protocols like JMS, AMQP, STOMP, and the like.

The bigger question at this point is how NATS Streaming will tackle scaling and replication (a requirement for true production-readiness in my opinion). Kafka was designed from the ground up for high scalability and availability through the use of external coordination (read ZooKeeper). Naturally, there is a lot of complexity and cost that comes with that. NATS Streaming attempts to keep NATS’ spirit of simplicity, but it’s yet to be seen how it will reconcile that with the complex nature of distributed systems. I’m excited to see where Apcera takes NATS Streaming and generally the NATS ecosystem in the future since the team has a lot of experience in this area.

You Are Not Paid to Write Code

“Taco Bell Programming” is the idea that we can solve many of the problems we face as software engineers with clever reconfigurations of the same basic Unix tools. The name comes from the fact that every item on the menu at Taco Bell, a company which generates almost $2 billion in revenue annually, is simply a different configuration of roughly eight ingredients.

Many people grumble or reject the notion of using proven tools or techniques. It’s boring. It requires investing time to learn at the expense of shipping code.  It doesn’t do this one thing that we need it to do. It won’t work for us. For some reason—and I continue to be completely baffled by this—everyone sees their situation as a unique snowflake despite the fact that a million other people have probably done the same thing. It’s a weird form of tunnel vision, and I see it at every level in the organization. I catch myself doing it on occasion too. I think it’s just human nature.

I was able to come to terms with this once I internalized something a colleague once said: you are not paid to write code. You have never been paid to write code. In fact, code is a nasty byproduct of being a software engineer.

Every time you write code or introduce third-party services, you are introducing the possibility of failure into your system.

I think the idea of Taco Bell Programming can be generalized further and has broader implications based on what I see in industry. There are a lot of parallels to be drawn from The Systems Bible by John Gall, which provides valuable commentary on general systems theory. Gall’s Fundamental Theorem of Systems is that new systems mean new problems. I think the same can safely be said of code—more code, more problems. Do it without a new system if you can.

Systems are seductive and engineers in particular seem to have a predisposition for them. They promise to do a job faster, better, and more easily than you could do it by yourself or with a less specialized system. But when you introduce a new system, you introduce new variables, new failure points, and new problems.

But if you set up a system, you are likely to find your time and effort now being consumed in the care and feeding of the system itself. New problems are created by its very presence. Once set up, it won’t go away, it grows and encroaches. It begins to do strange and wonderful things. Breaks down in ways you never thought possible. It kicks back, gets in the way, and opposes its own proper function. Your own perspective becomes distorted by being in the system. You become anxious and push on it to make it work. Eventually you come to believe that the misbegotten product it so grudgingly delivers is what you really wanted all the time. At that point encroachment has become complete. You have become absorbed. You are now a systems person.

The last systems principle we look at is one I find particularly poignant: almost anything is easier to get into than out of. When we introduce new systems, new tools, new lines of code, we’re with them for the long haul. It’s like a baby that doesn’t grow up.

We’re not paid to write code, we’re paid to add value (or reduce cost) to the business. Yet I often see people measuring their worth in code, in systems, in tools—all of the output that’s easy to measure. I see it come at the expense of attending meetings. I see it at the expense of supporting other teams. I see it at the expense of cross-training and personal/professional development. It’s like full-bore coding has become the norm and we’ve given up everything else.

Another area I see this manifest is with the siloing of responsibilities. Product, Platform, Infrastructure, Operations, DevOps, QA—whatever the silos, it’s created a sort of responsibility lethargy. “I’m paid to write software, not tests” or “I’m paid to write features, not deploy and monitor them.” Things of that nature.

I think this is only addressed by stewarding a strong engineering culture and instilling the right values and expectations. For example, engineers should understand that they are not defined by their tools but rather the problems they solve and ultimately the value they add. But it’s important to spell out that this goes beyond things like commits, PRs, and other vanity metrics. We should embrace the principles of systems theory and Taco Bell Programming. New systems or more code should be the last resort, not the first step. Further, we should embody what it really means to be an engineer rather than measuring raw output. You are not paid to write code.

Benchmarking Message Queue Latency

About a year and a half ago, I published Dissecting Message Queues, which broke down a few different messaging systems and did some performance benchmarking. It was a naive attempt and had a lot of problems, but it was also my first time doing any kind of system benchmarking. It turns out benchmarking systems correctly is actually pretty difficult and many folks get it wrong. I don’t claim to have gotten it right, but over the past year and a half I’ve learned a lot, tried to build some better tools, and improve my methodology.

Tooling and Methodology

The Dissecting Message Queues benchmarks used a framework I wrote which published a specified number of messages effectively as fast as possible, received them, and recorded the end-to-end latency. There are several problems with this. First, load generation and consumption run on the same machine. Second, the system under test runs on the same machine as the benchmark client—both of these confound measurements. Third, running “pedal to the metal” and looking at the resulting latency isn’t a very useful benchmark because it’s not representative of a production environment (as Gil Tene likes to say, this is like driving your car as fast as possible, crashing it into a pole, and looking at the shape of the bumper afterwards—it’s always going to look bad). Lastly, the benchmark recorded average latency, which, for all intents and purposes, is a useless metric to look at.

I wrote Flotilla to automate “scaled-up” benchmarking—running the broker and benchmark clients on separate, distributed VMs. Flotilla also attempted to capture a better view of latency by looking at the latency distribution, though it only went up to the 99th percentile, which can sweep a lot of really bad things under the rug as we’ll see later. However, it still ran tests at full throttle, which isn’t great.

Bench is an attempt to get back to basics. It’s a simple, generic benchmarking library for measuring latency. It provides a straightforward Requester interface which can be implemented for various systems under test. Bench works by attempting to issue a fixed rate of requests per second and measuring the latency of each request issued synchronously. Latencies are captured using HDR Histogram, which observes the complete latency distribution and allows us to look, for example, at “six nines” latency.

Introducing a request schedule allows us to measure latency for different configurations of request rate and message size, but in a “closed-loop” test, it creates another problem called coordinated omission. The problem with a lot of benchmarks is that they end up measuring service time rather than response time, but the latter is likely what you care about because it’s what your users experience.

The best way to describe service time vs. response time is to think of a cash register. The cashier might be able to ring up a customer in under 30 seconds 99% of the time, but 1% of the time it takes three minutes. The time it takes to ring up a customer is the service time, while the response time consists of the service time plus the time the customer waited in line. Thus, the response time is dependent upon the variation in both service time and the rate of arrival. When we measure latency, we really want to measure response time.

Now, let’s think about how most latency benchmarks work. They usually do this:

  1. Note timestamp before request, t0.
  2. Make synchronous request.
  3. Note timestamp after request, t1.
  4. Record latency t1t0.
  5. Repeat as needed for request schedule.

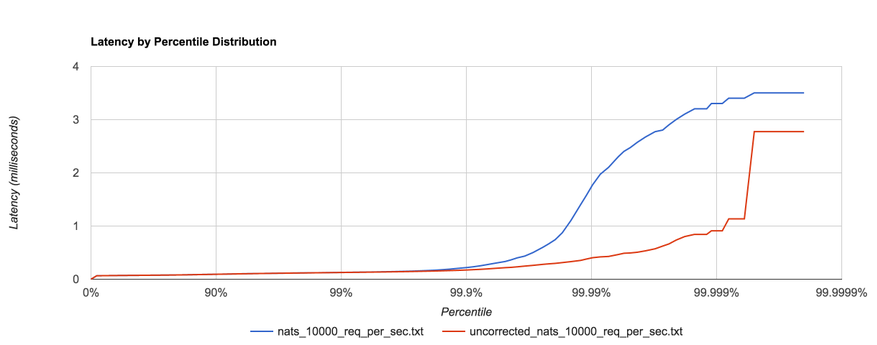
What’s the problem with this? Nothing, as long as our requests fit within the specified request schedule.  For example, if we’re issuing 100 requests per second and each request takes 10 ms to complete, we’re good. However, if one request takes 100 ms to complete, that means we issued only one request during those 100 ms when, according to our schedule, we should have issued 10 requests in that window. Nine other requests should have been issued, but the benchmark effectively coordinated with the system under test by backing off. In reality, those nine requests waited in line—one for 100 ms, one for 90 ms, one for 80 ms, etc. Most benchmarks don’t capture this time spent waiting in line, yet it can have a dramatic effect on the results. The graph below shows the same benchmark with coordinated omission both uncorrected (red) and corrected (blue):
coordinated_omission

HDR Histogram attempts to correct coordinated omission by filling in additional samples when a request falls outside of its expected interval. We can also deal with coordinated omission by simply avoiding it altogether—always issue requests according to the schedule.

Message Queue Benchmarks

I benchmarked several messaging systems using bench—RabbitMQ (3.6.0), Kafka (0.8.2.2 and 0.9.0.0), Redis (2.8.4) pub/sub, and NATS (0.7.3). In this context, a “request” consists of publishing a message to the server and waiting for a response (i.e. a roundtrip). We attempt to issue requests at a fixed rate and correct for coordinated omission, then plot the complete latency distribution all the way up to the 99.9999th percentile. We repeat this for several configurations of request rate and request size. It’s also important to note that each message going to and coming back from the server are of the specified size, i.e. the “response” is the same size as the “request.”

The configurations used are listed below. Each configuration is run for a sustained 30 seconds.

  • 256B requests at 3,000 requests/sec (768 KB/s)
  • 1KB requests at 3,000 requests/sec (3 MB/s)
  • 5KB requests at 2,000 requests/sec (10 MB/s)
  • 1KB requests at 20,000 requests/sec (20.48 MB/s)
  • 1MB requests at 100 requests/sec (100 MB/s)

These message sizes are mostly arbitrary, and there might be a better way to go about this. Though I think it’s worth pointing out that the Ethernet MTU is 1500 bytes, so accounting for headers, the maximum amount of data you’ll get in a single TCP packet will likely be between 1400 and 1500 bytes.

The system under test and benchmarking client are on two different m4.xlarge EC2 instances (2.4 GHz Intel Xeon Haswell, 16GB RAM) with enhanced networking enabled.

Redis and NATS

Redis pub/sub and NATS have similar performance characteristics. Both offer very lightweight, non-transactional messaging with no persistence options (discounting Redis’ RDB and AOF persistence, which don’t apply to pub/sub), and both support some level of topic pattern matching. I’m hesitant to call either a “message queue” in the traditional sense, so I usually just refer to them as message brokers or buses. Because of their ephemeral nature, both are a nice choice for low-latency, lossy messaging.

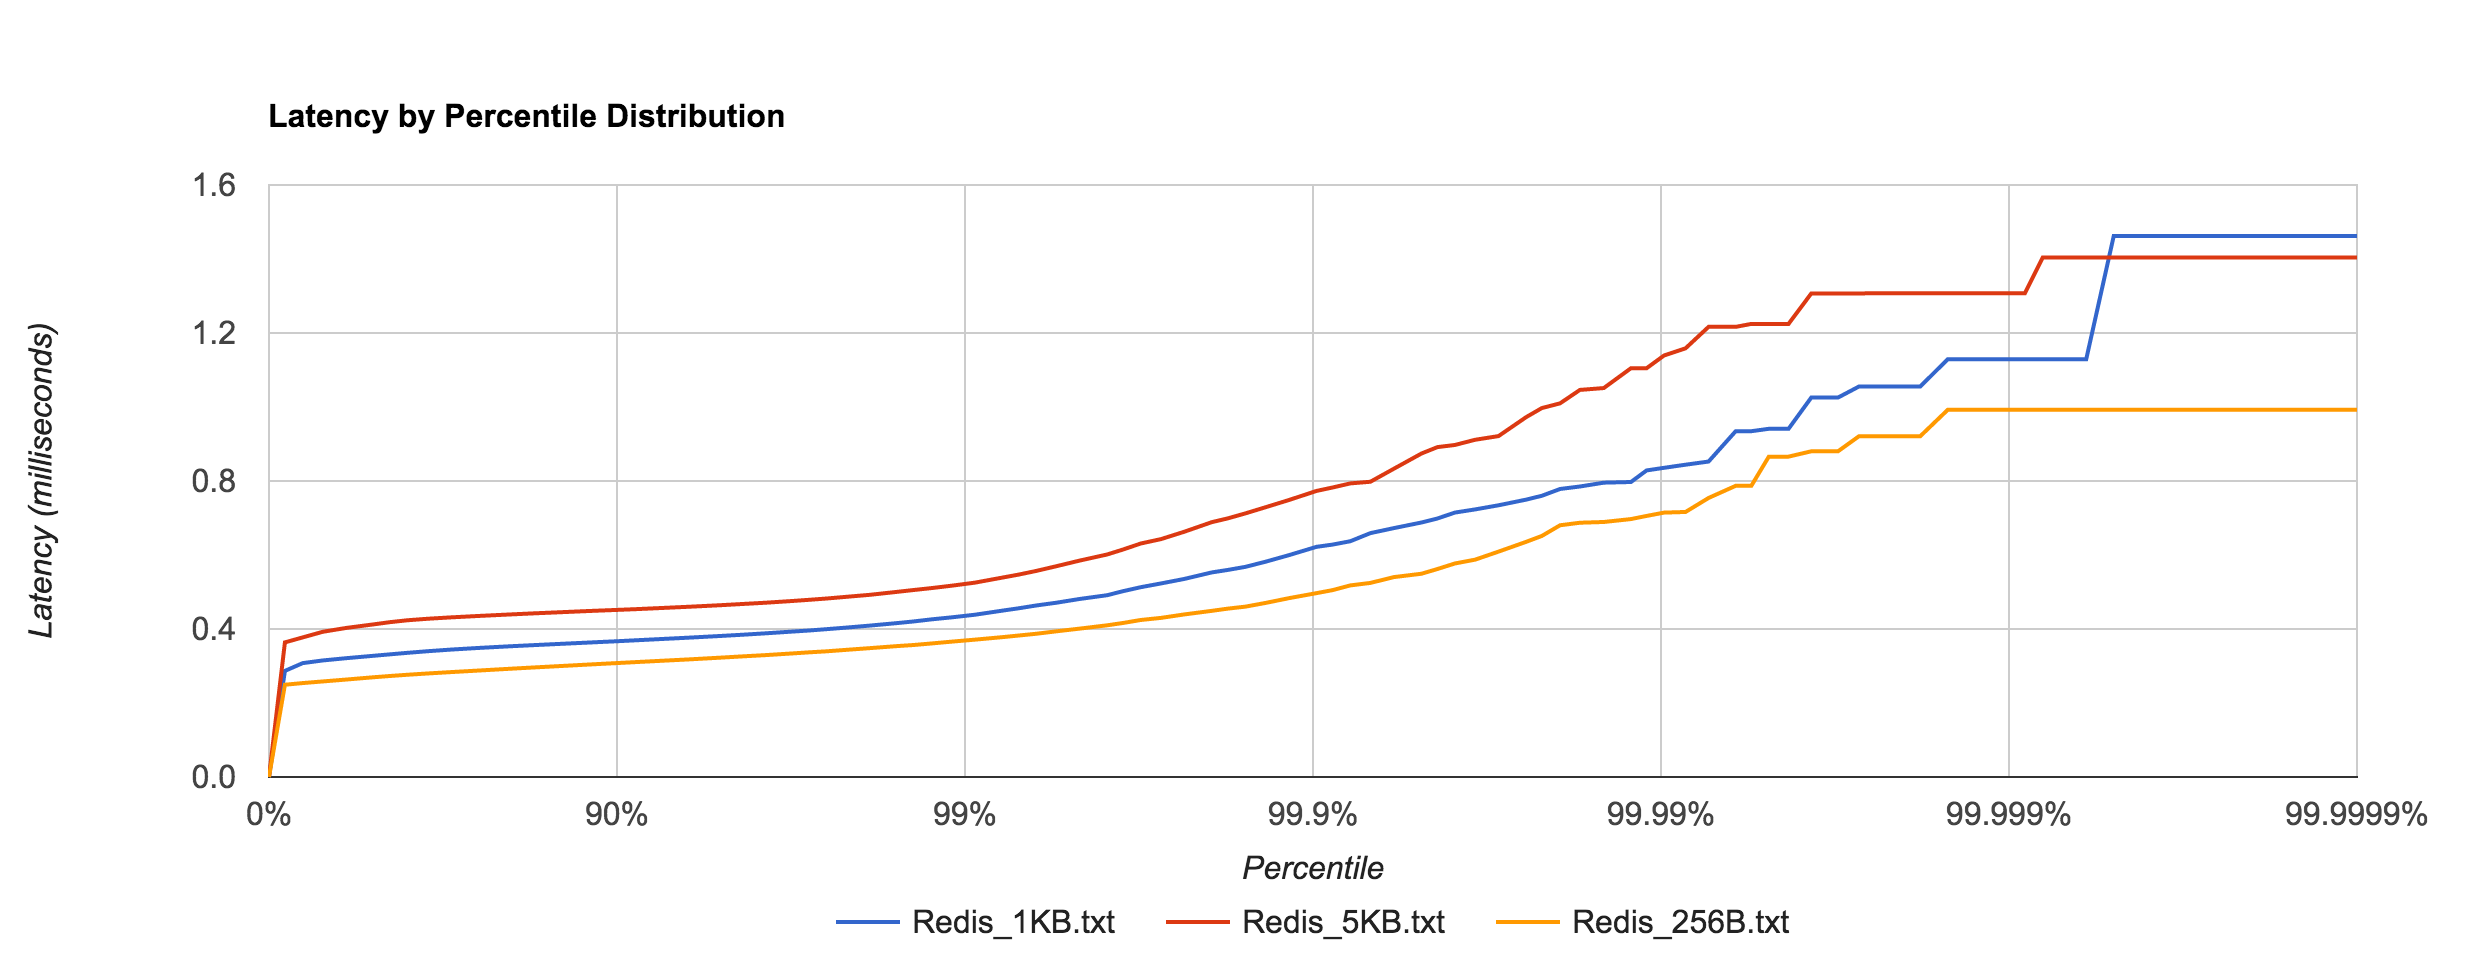
Redis tail latency peaks around 1.5 ms.

Redis_latency

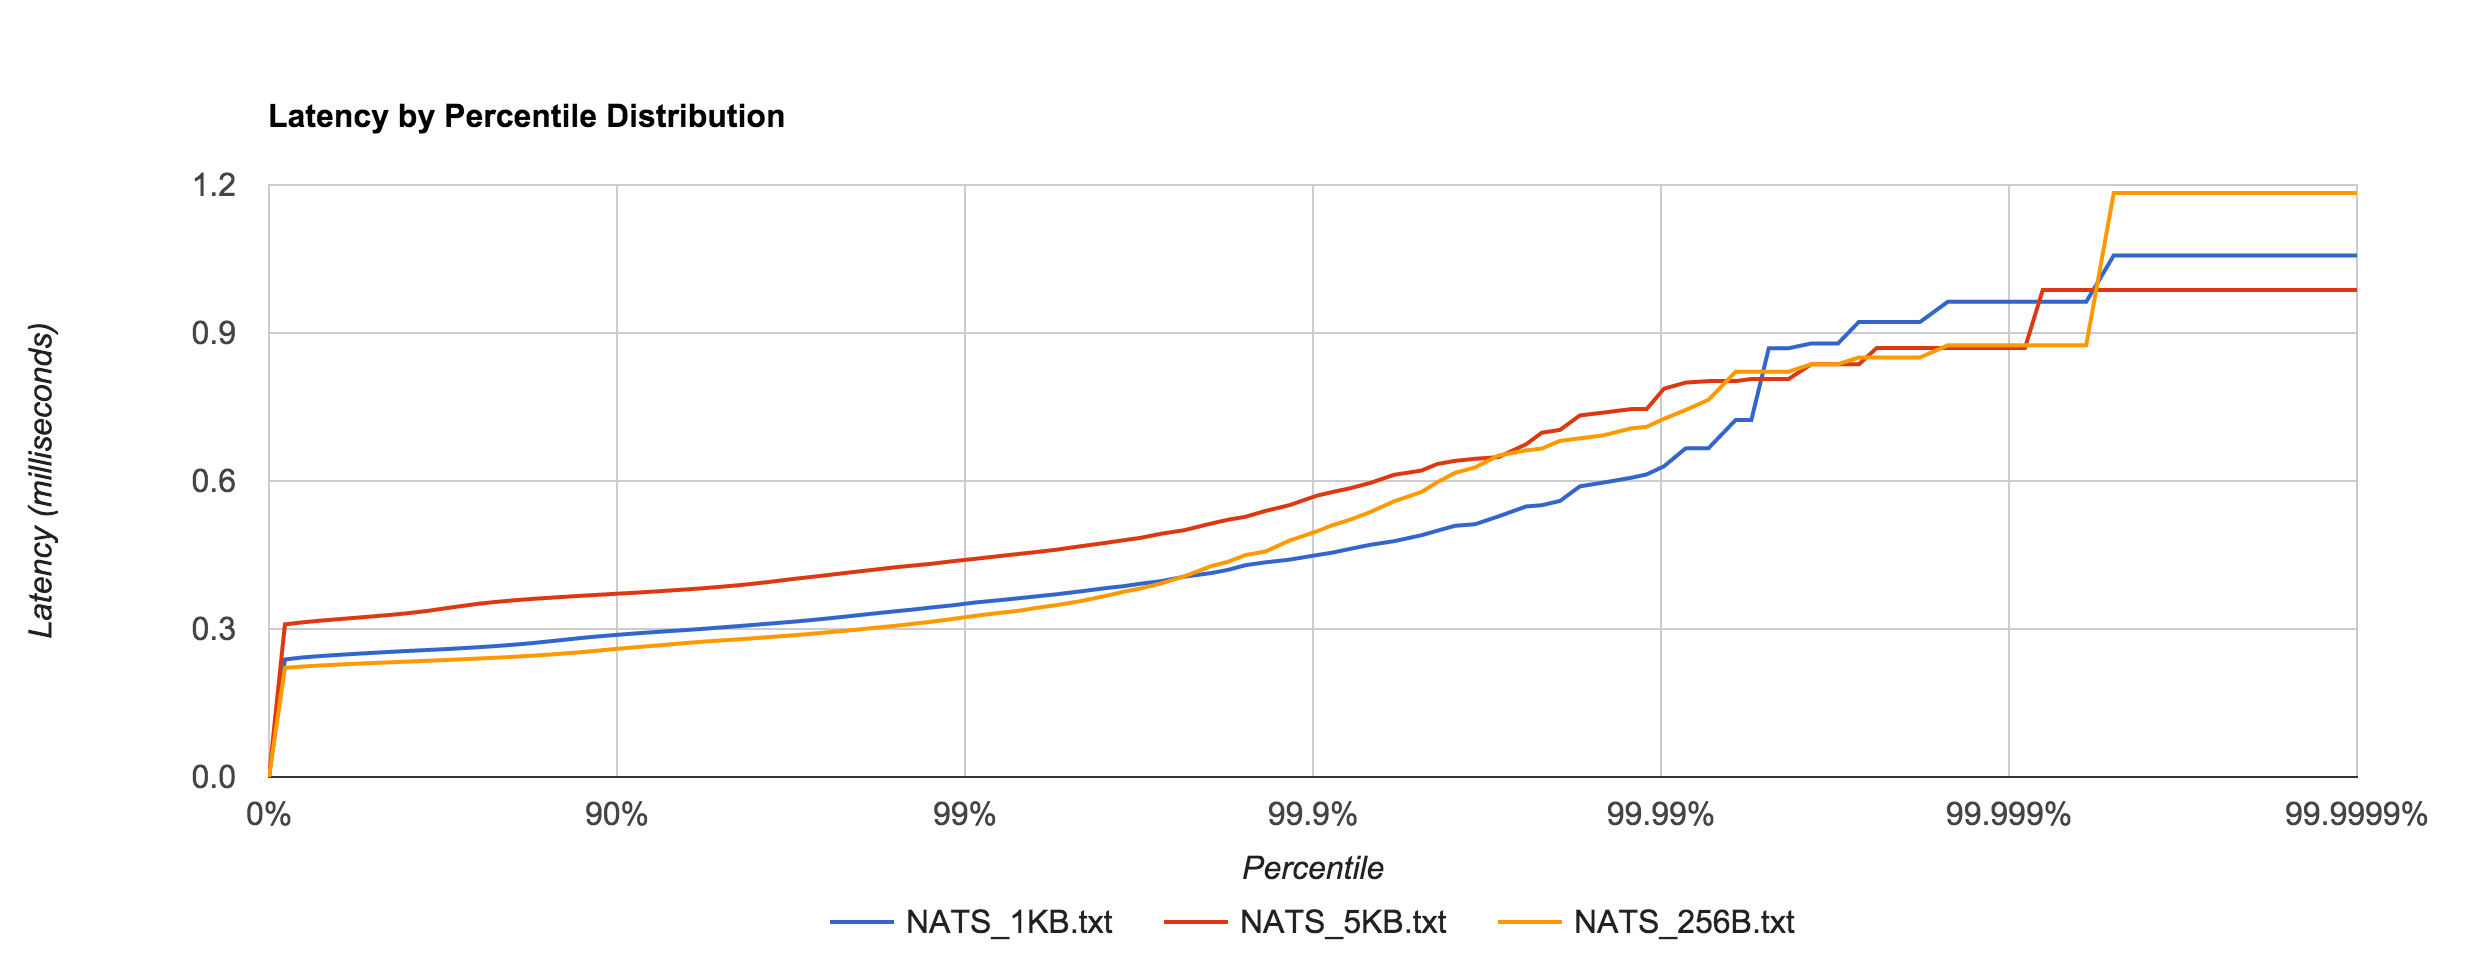
NATS performance looks comparable to Redis. Latency peaks around 1.2 ms.

NATS_latency

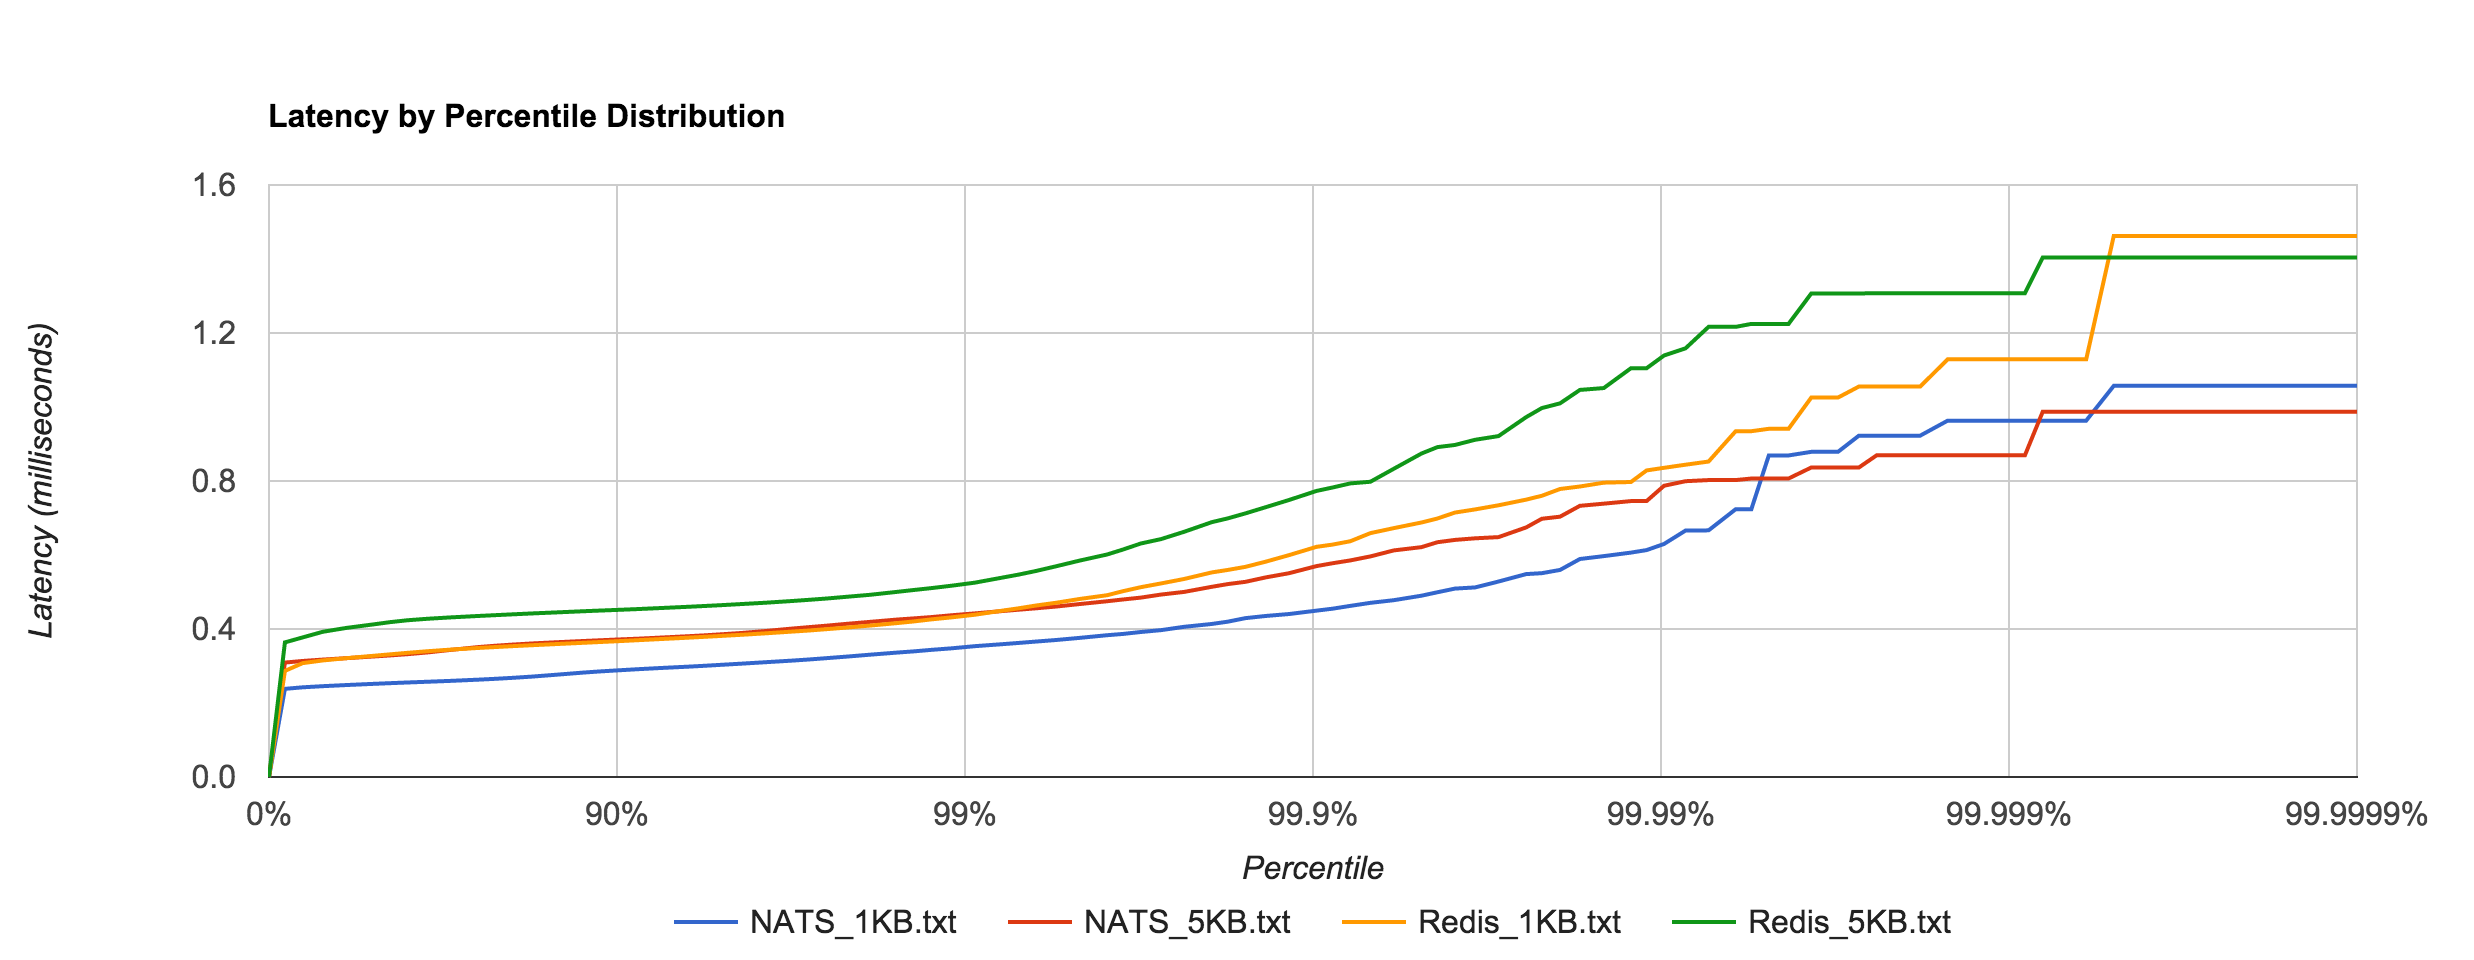
The resemblance becomes more apparent when we overlay the two distributions for the 1KB and 5KB runs. NATS tends to be about 0.1 to 0.4 ms faster.

Redis_NATS_latency

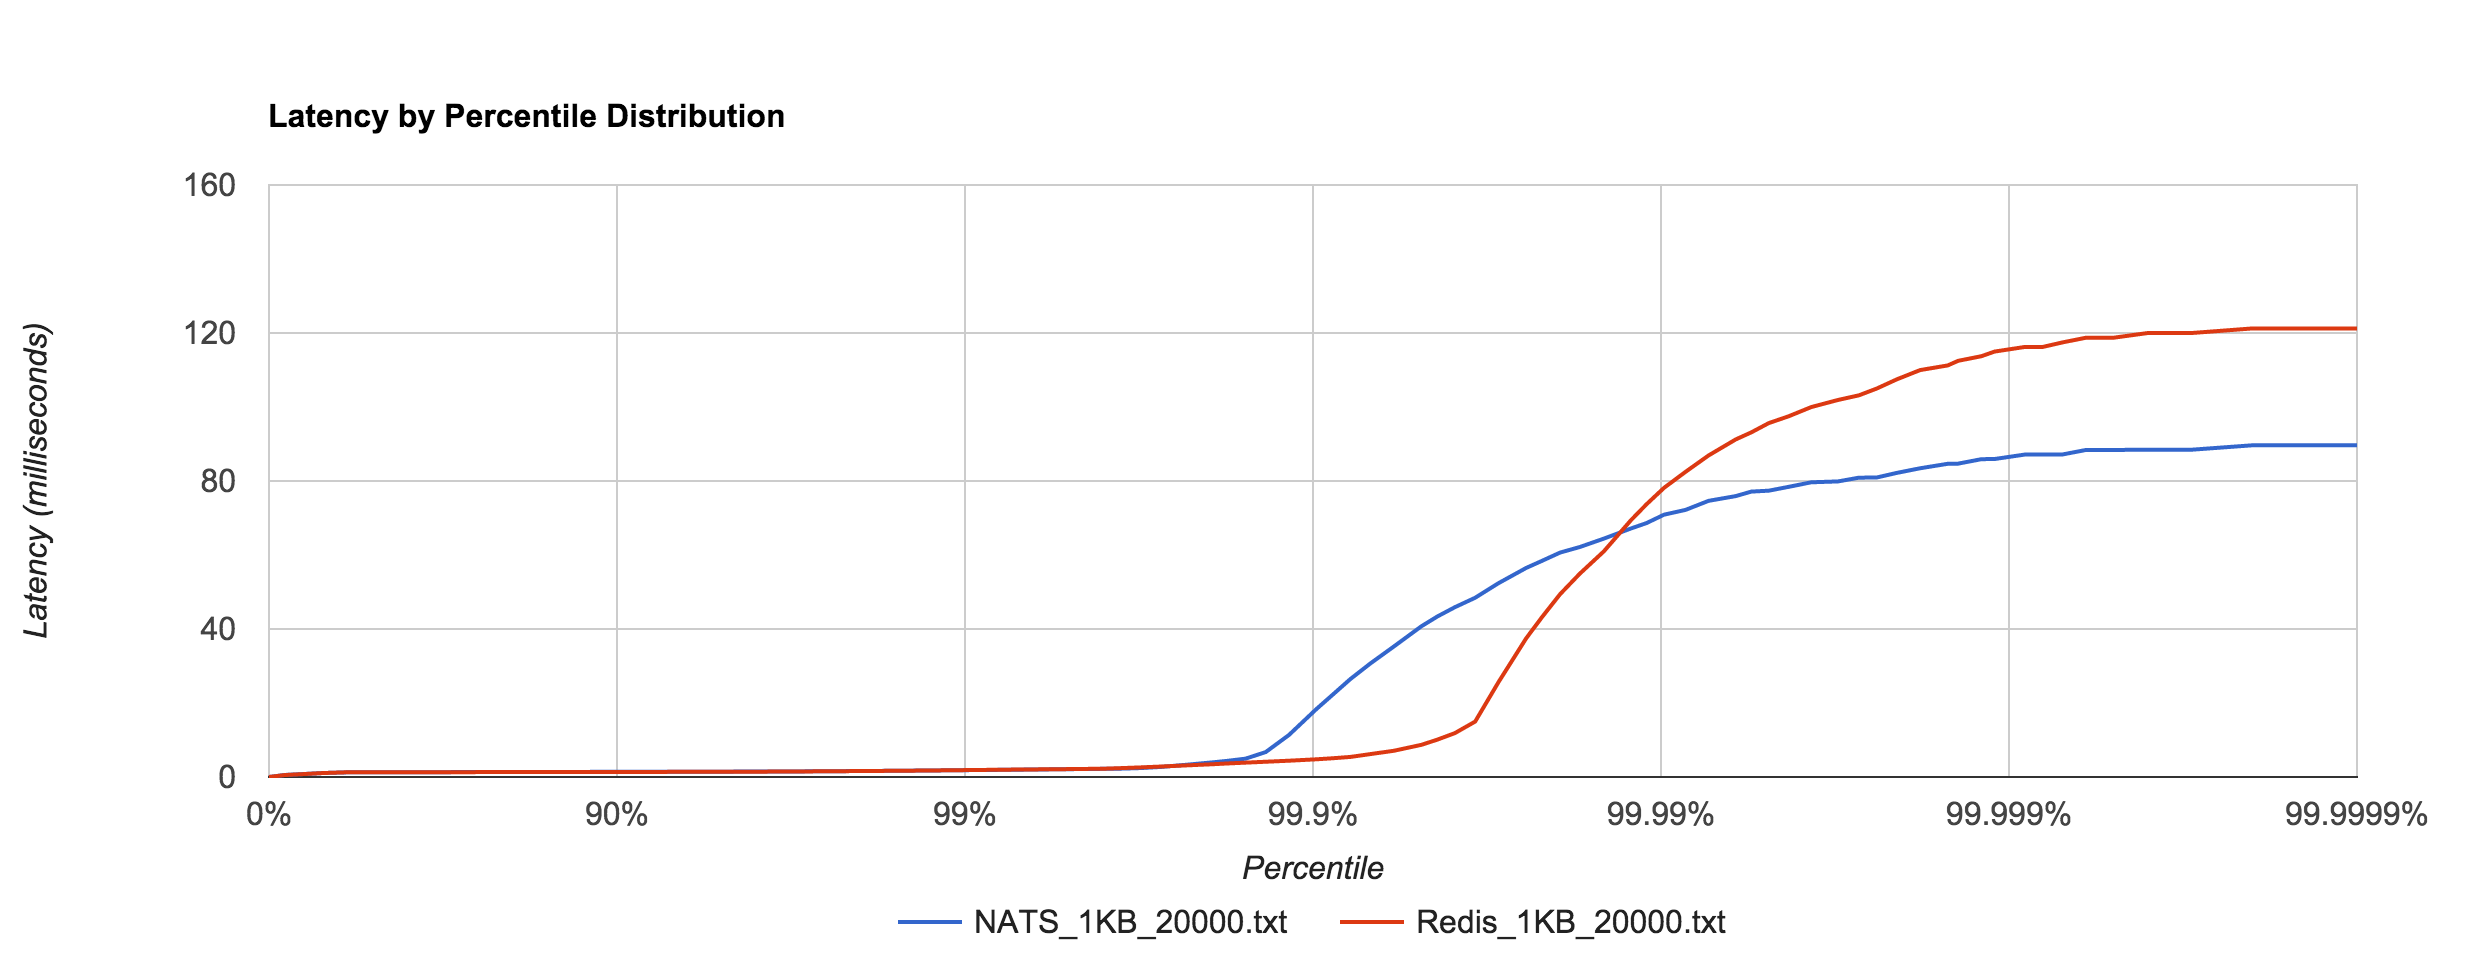
The 1KB, 20,000 requests/sec run uses 25 concurrent connections. With concurrent load, tail latencies jump up, peaking around 90 and 120 ms at the 99.9999th percentile in NATS and Redis, respectively.

Redis_NATS_1KB_20000_latency

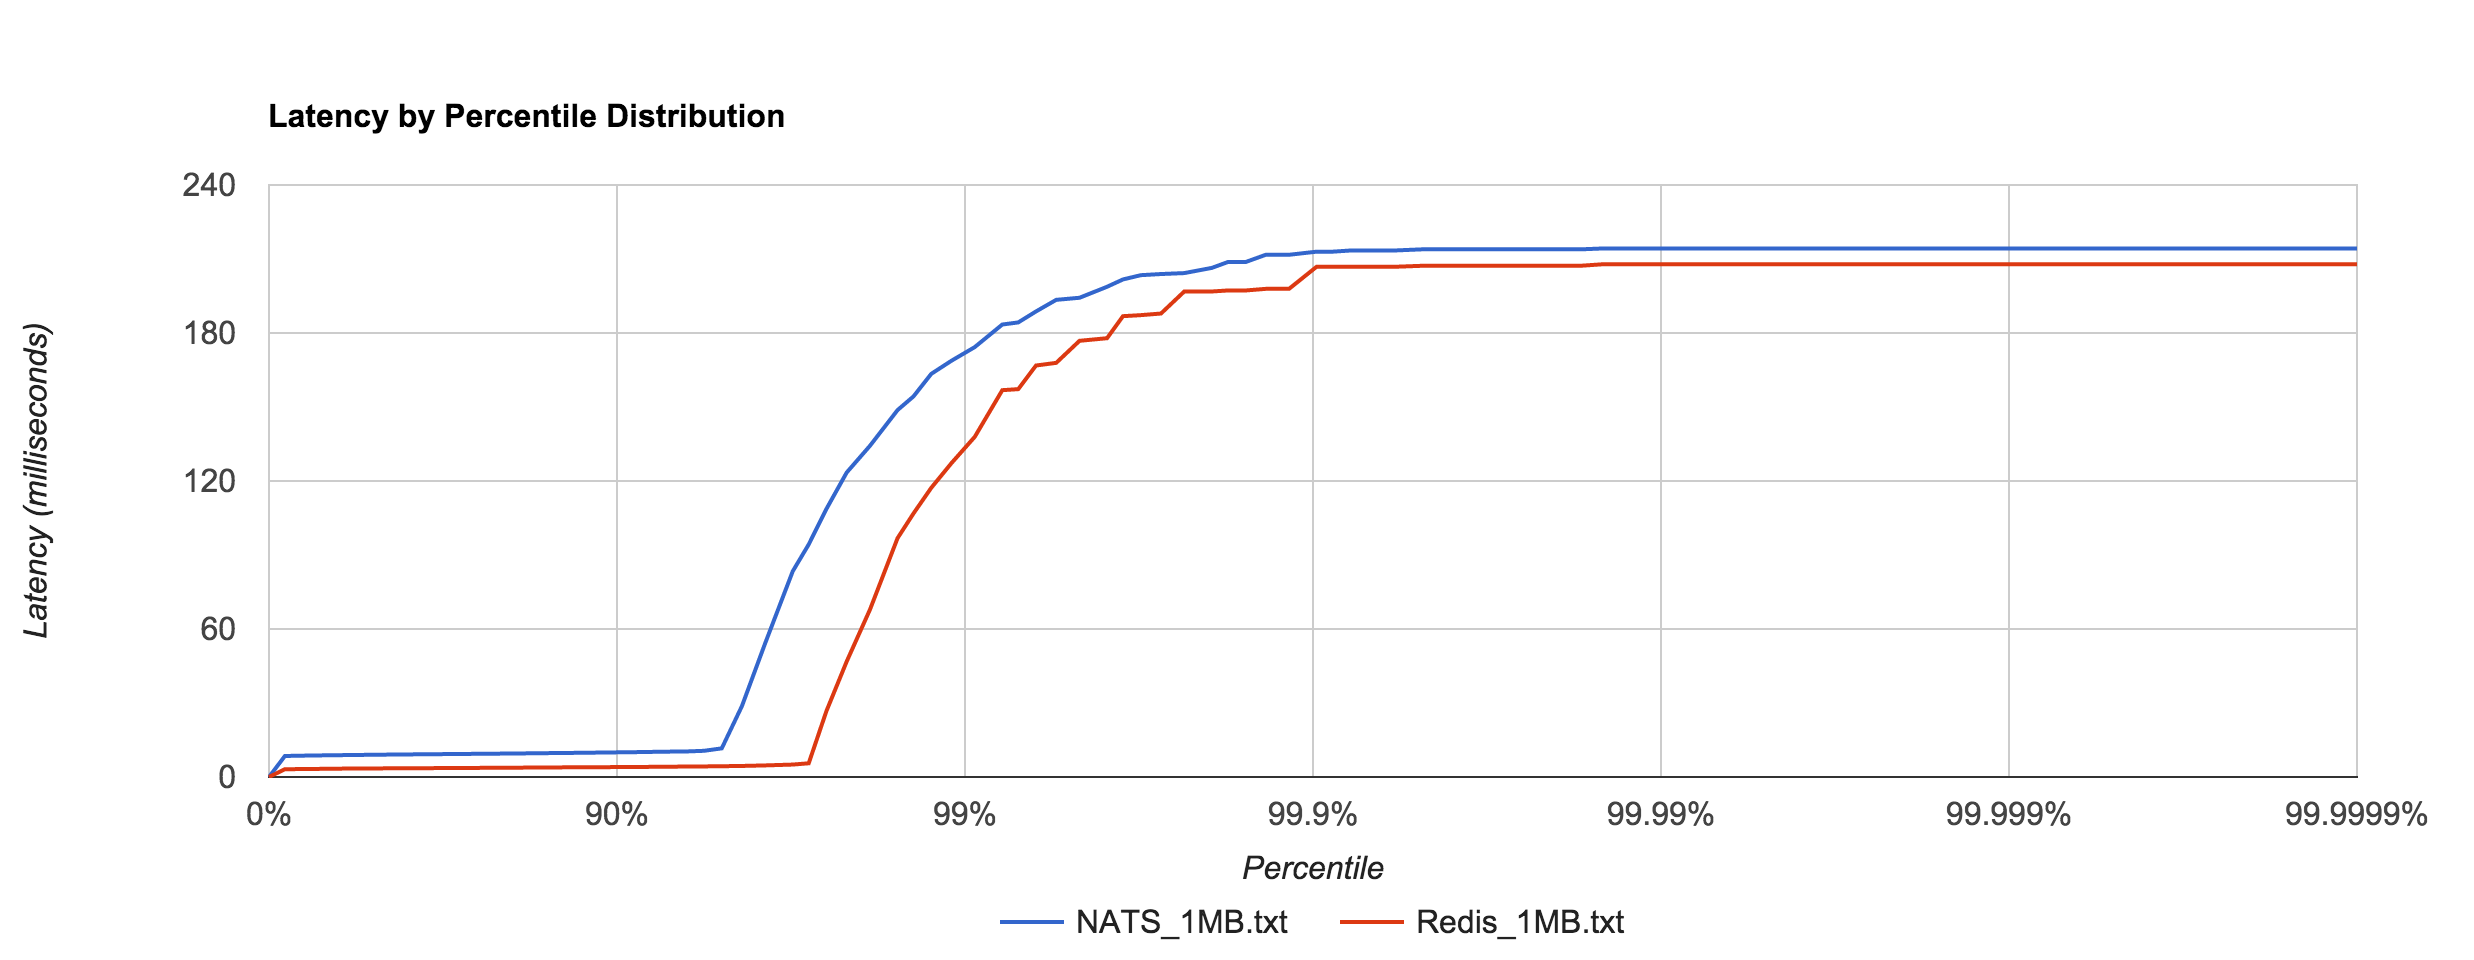
Large messages (1MB) don’t hold up nearly as well, exhibiting large tail latencies starting around the 95th and 97th percentiles in NATS and Redis, respectively. 1MB is the default maximum message size in NATS. The latency peaks around 214 ms. Again, keep in mind these are synchronous, roundtrip latencies.

Redis_NATS_1MB_latency

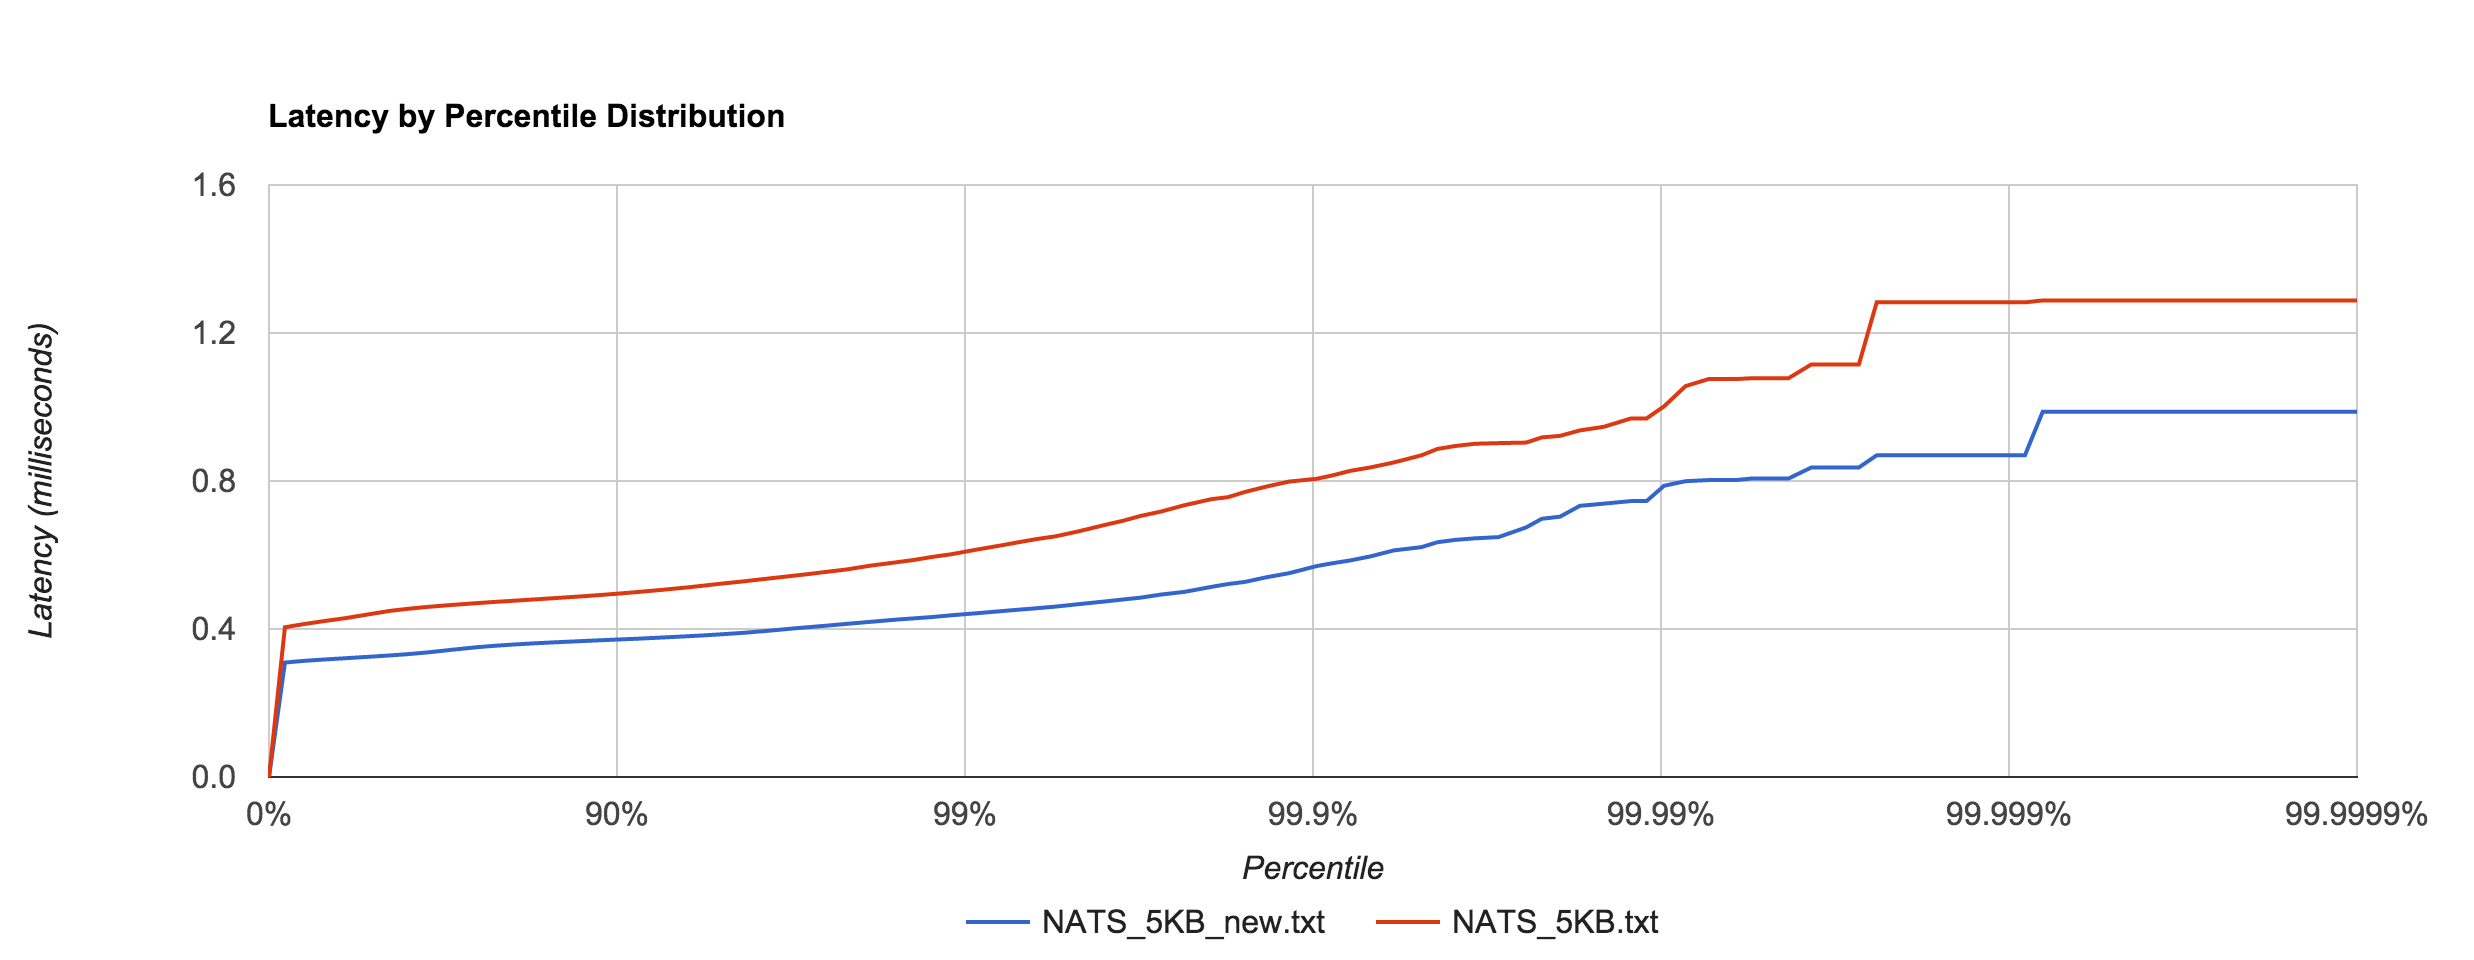
Apcera’s Ivan Kozlovic pointed out that the version of the NATS client I was using didn’t include a recent performance optimization. Before, the protocol parser scanned over each byte in the payload, but the newer version skips to the end (the previous benchmarks were updated to use the newer version). The optimization does have a noticeable effect, illustrated below. There was about a 30% improvement with the 5KB latencies.

NATS_optimization_latency

The difference is even more pronounced in the 1MB case, which has roughly a 90% improvement up to the 90th percentile. The linear scale in the graph below hides this fact, but at the 90th percentile, for example, the pre-optimization latency is 10 ms and the optimized latency is 3.8 ms. Clearly, the large tail is mostly unaffected, however.

NATS_1MB_optimization_latency

In general, this shows that NATS and Redis are better suited to smaller messages (well below 1MB), in which latency tends to be sub-millisecond up to four nines.

RabbitMQ and Kafka

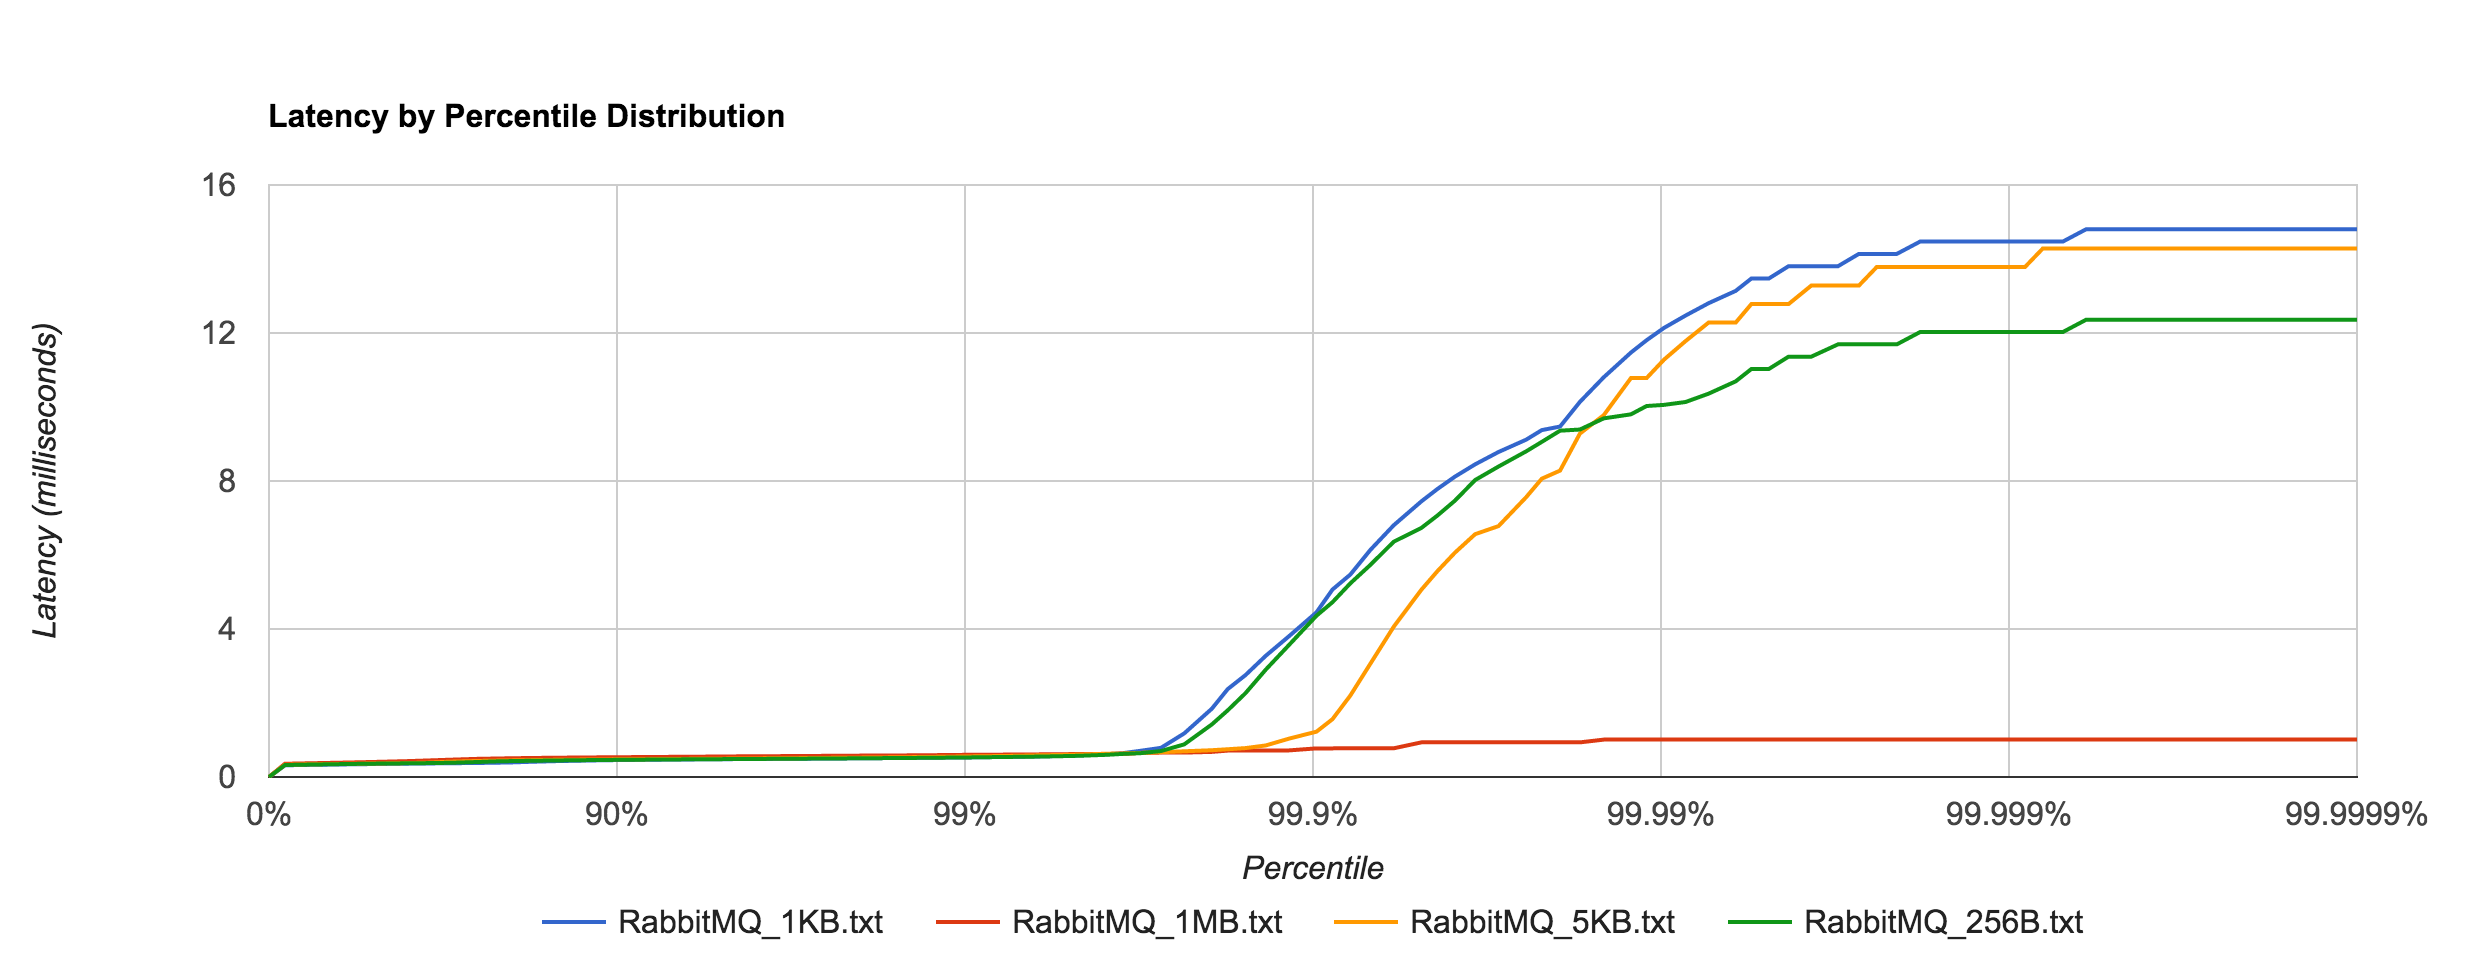
RabbitMQ is a popular AMQP implementation. Unlike NATS, it’s a more traditional message queue in the sense that it supports binding queues and transactional-delivery semantics. Consequently, RabbitMQ is a more “heavyweight” queuing solution and tends to pay an additional premium with latency. In this benchmark, non-durable queues were used. As a result, we should see reduced latencies since we aren’t going to disk.

RabbitMQ_latency

Latency tends to be sub-millisecond up to the 99.7th percentile, but we can see that it doesn’t hold up to NATS beyond that point for the 1KB and 5KB payloads.

RabbitMQ_NATS_latency

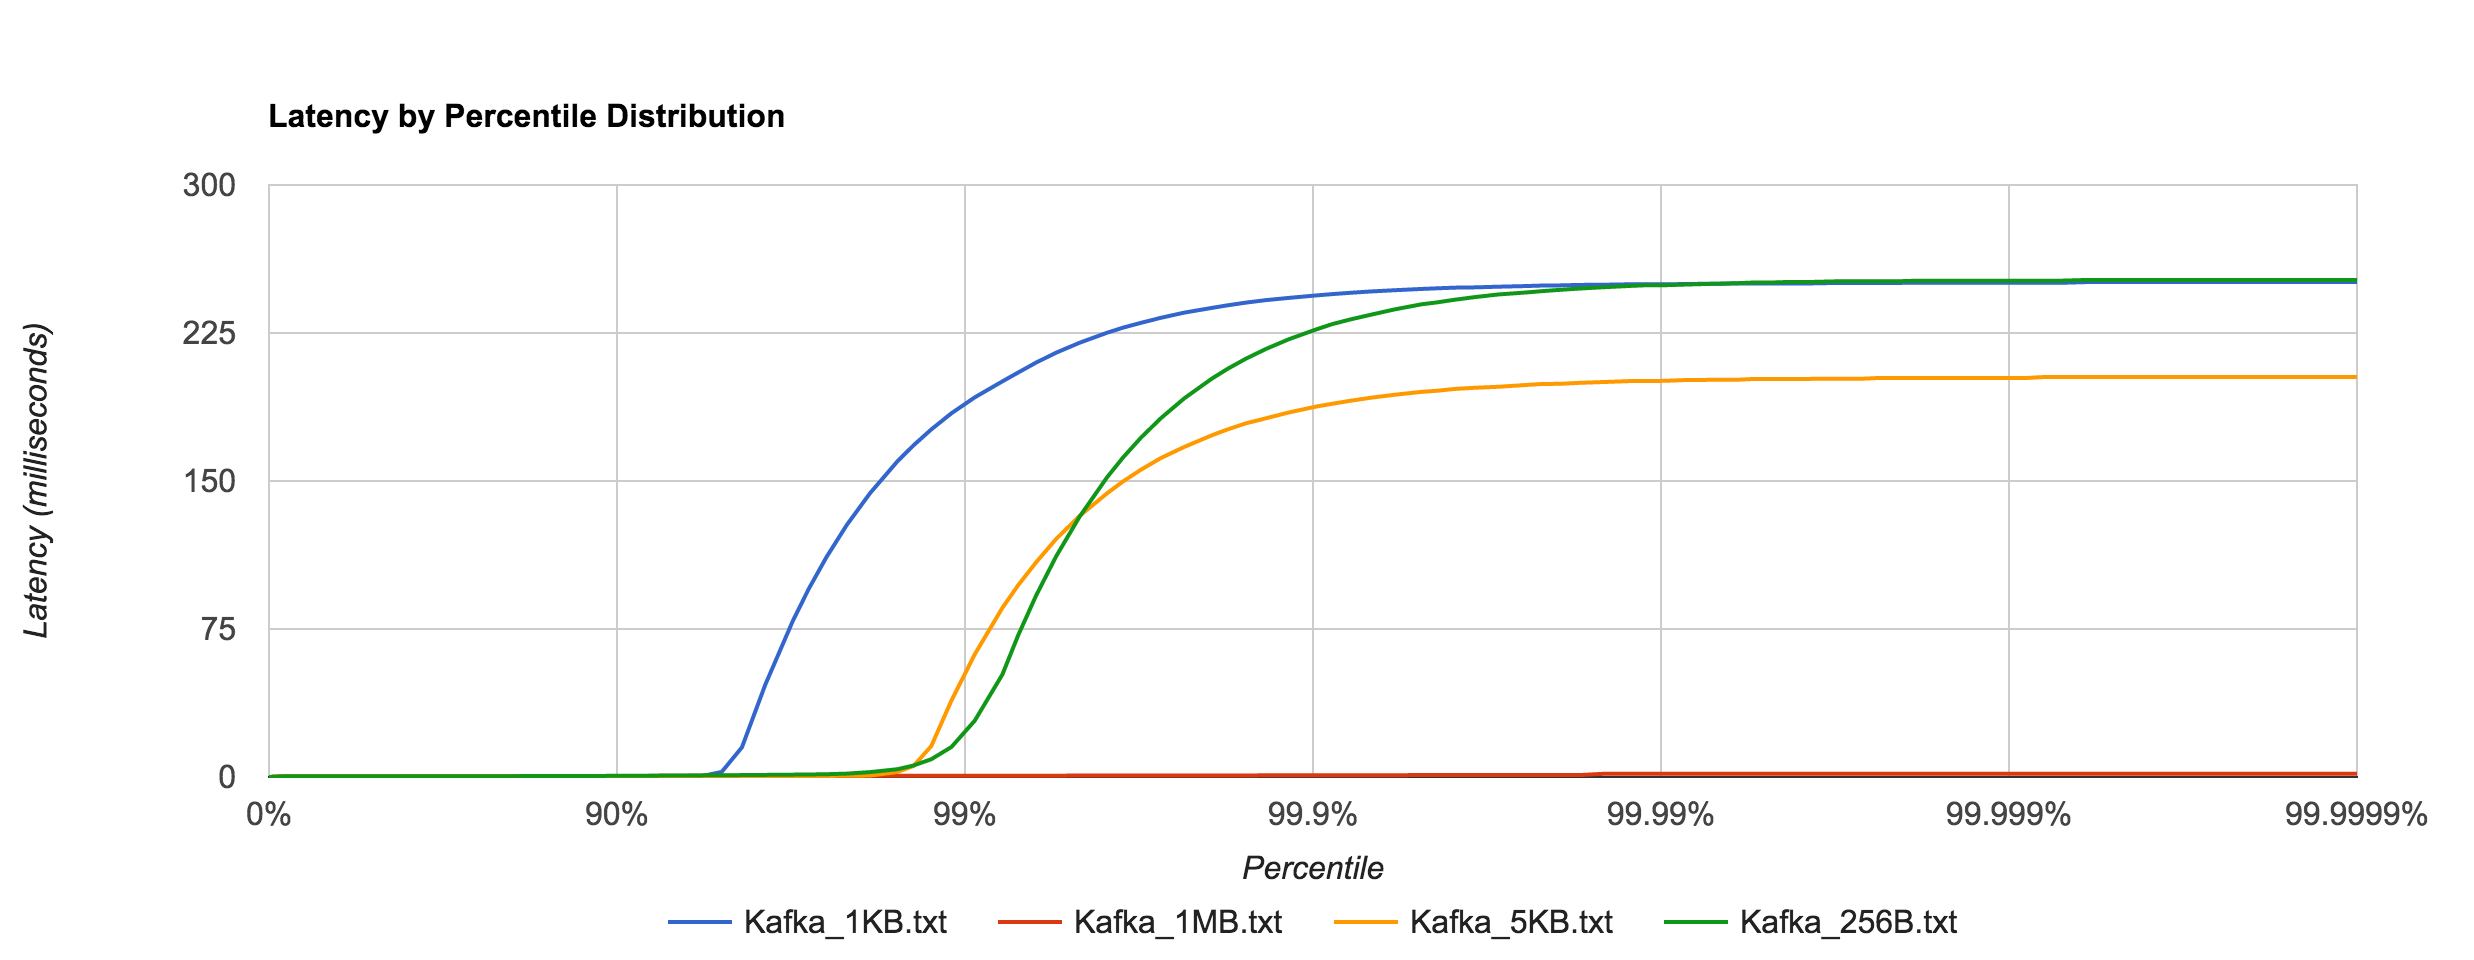
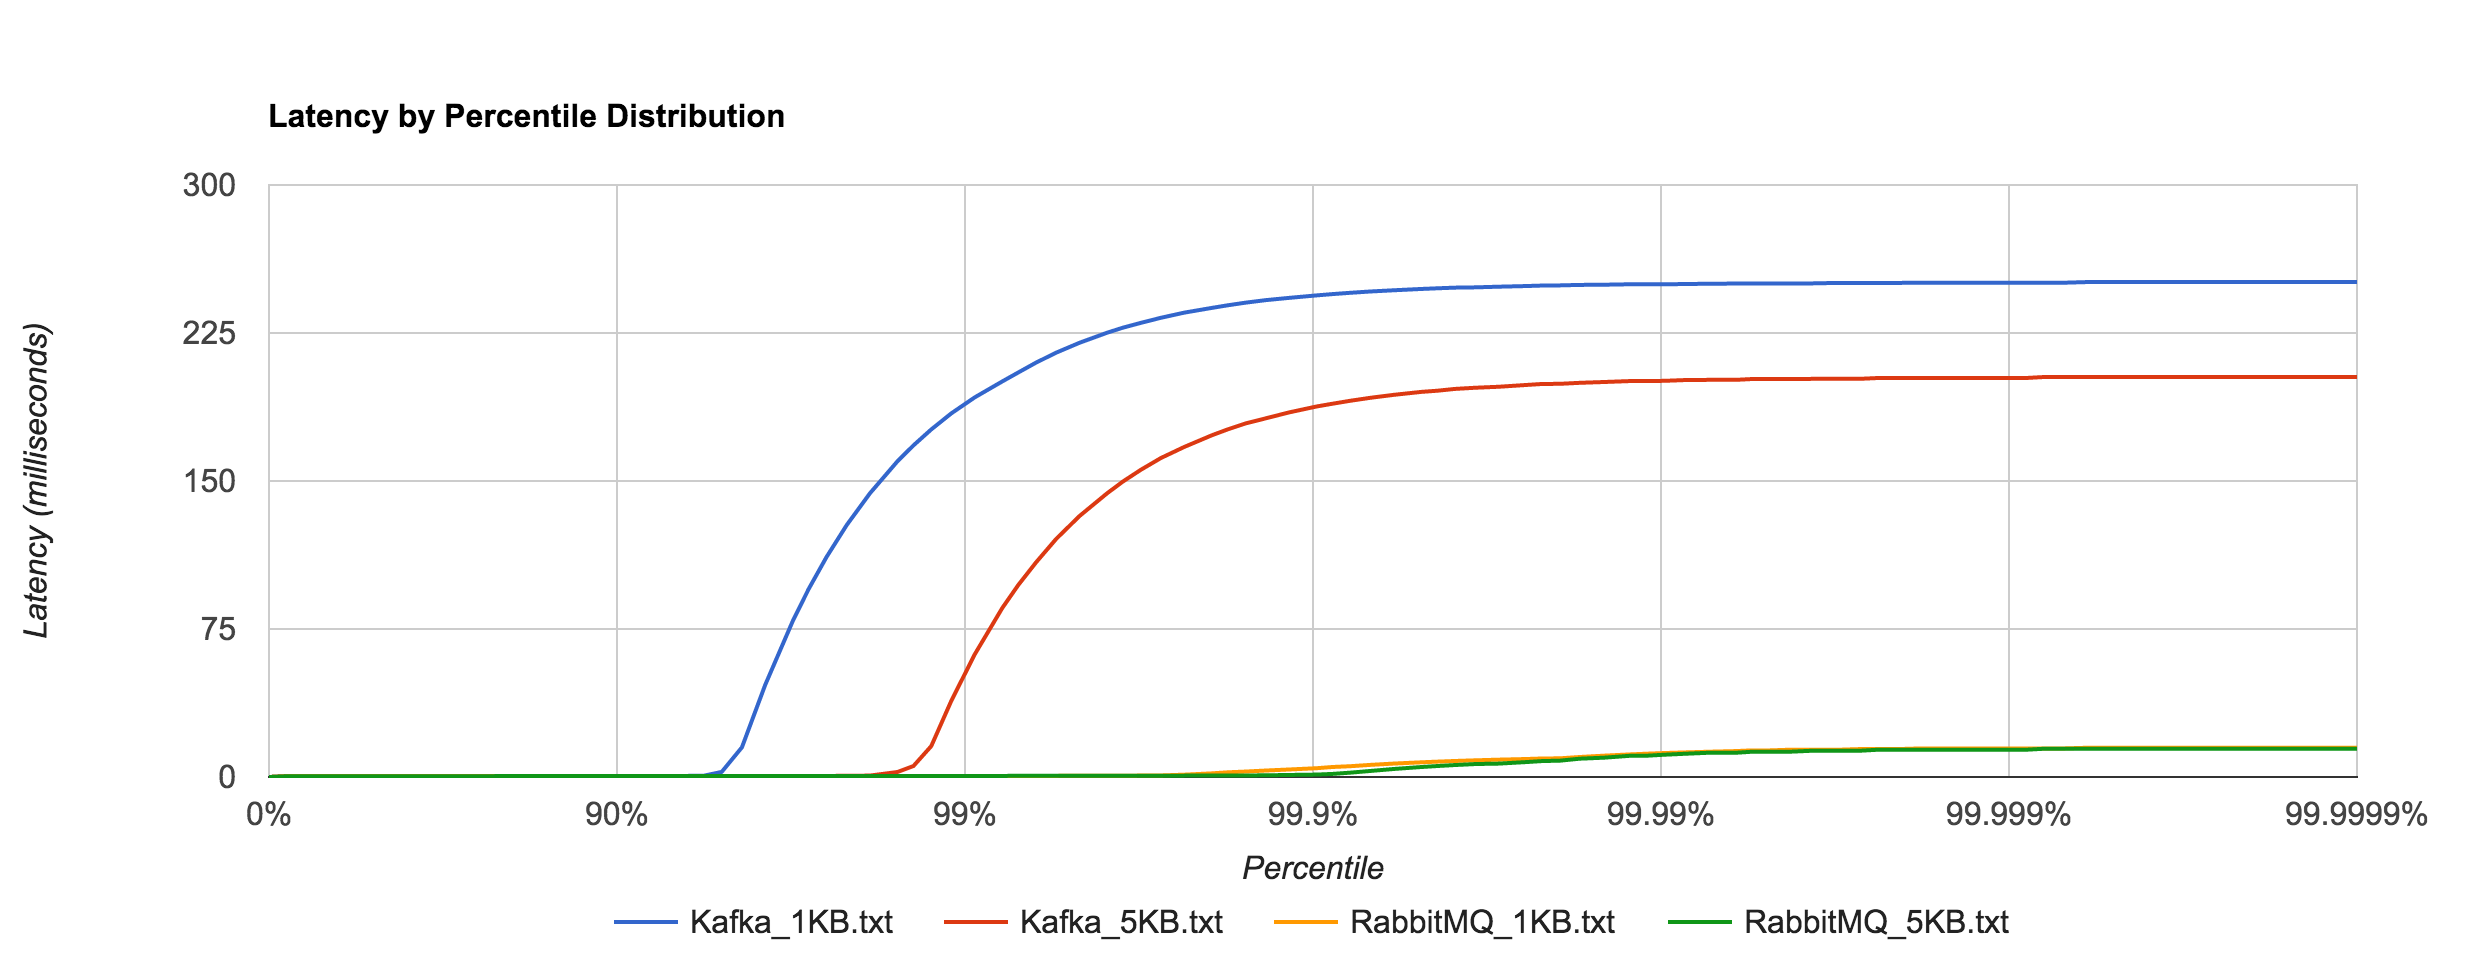
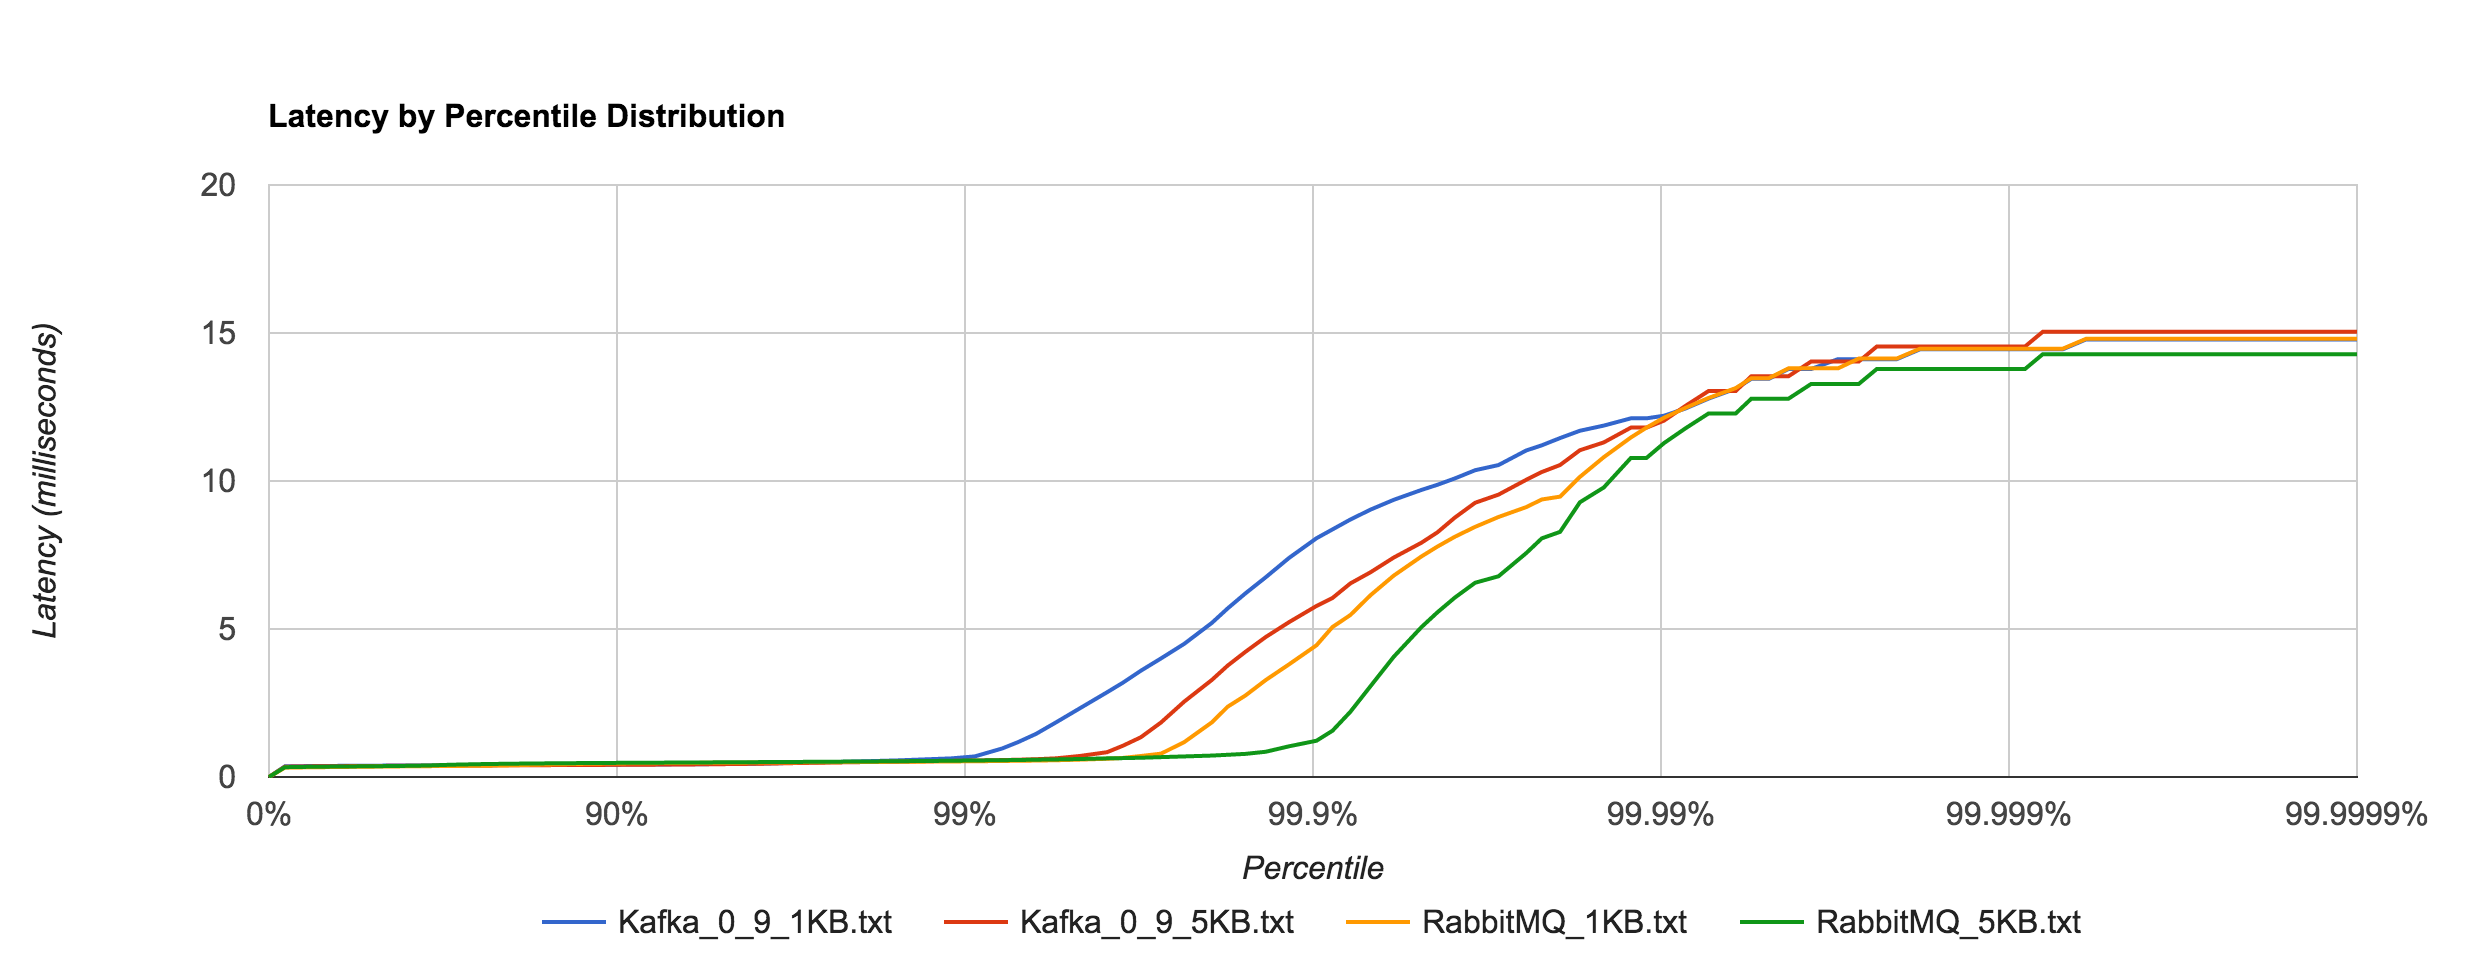
Kafka, on the other hand, requires disk persistence, but this doesn’t have a dramatic effect on latency until we look at the 94th percentile and beyond, when compared to RabbitMQ. Writes should be to page cache with flushes to disk happening asynchronously. The graphs below are for 0.8.2.2.

Kafka_latency

RabbitMQ_Kafka_latency

Once again, the 1KB, 20,000 requests/sec run is distributed across 25 concurrent connections. With RabbitMQ, we see the dramatic increase in tail latencies as we did with Redis and NATS. The RabbitMQ latencies in the concurrent case stay in line with the previous latencies up to about the 99th percentile. Interestingly, Kafka, doesn’t appear to be significantly affected. The latencies of 20,000 requests/sec at 1KB per request are not terribly different than the latencies of 3,000 requests/sec at 1KB per request, both peaking around 250 ms.

RabbitMQ_Kafka_1KB_20000_latency

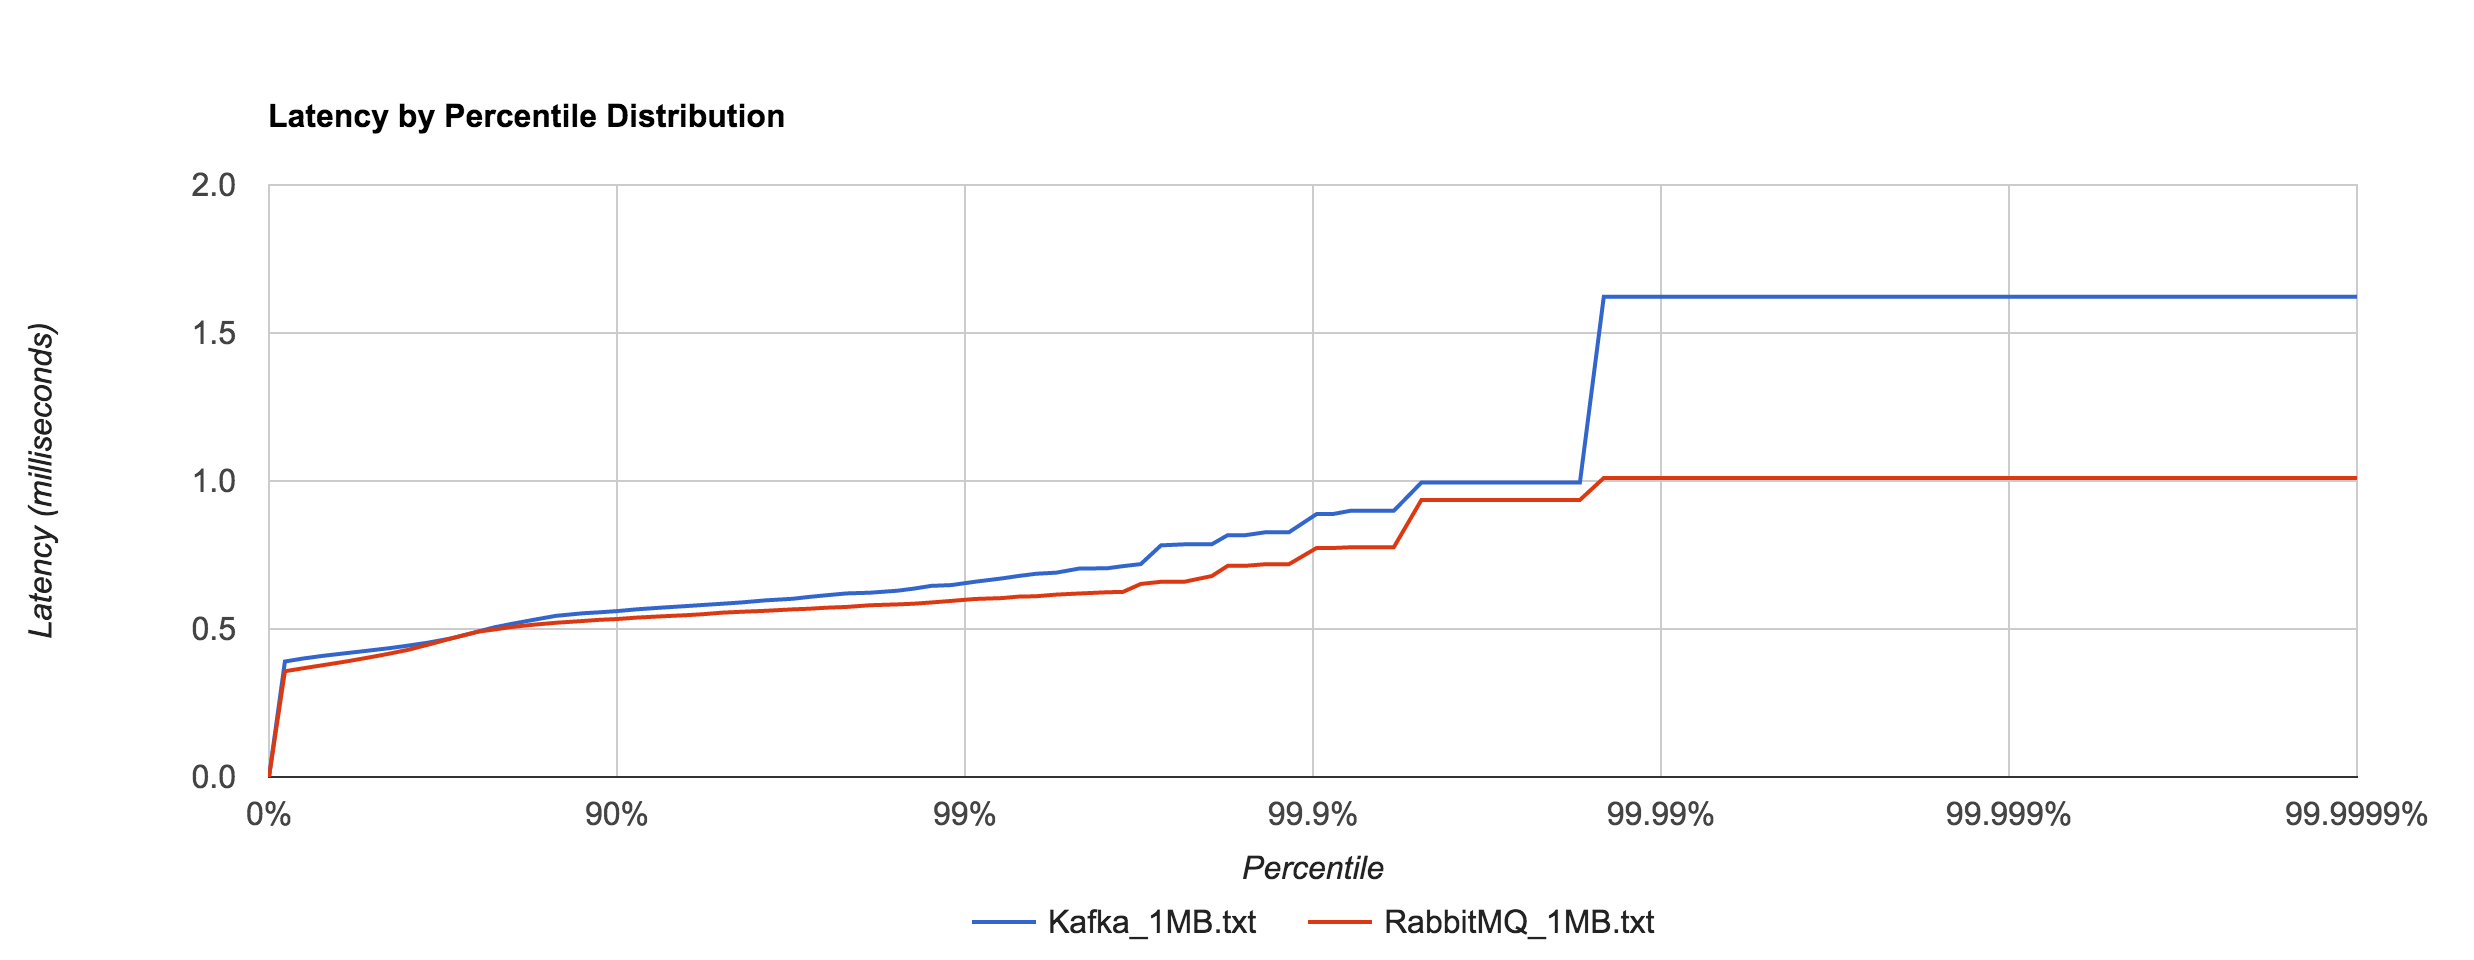
What’s particularly interesting is the behavior of 1MB messages vs. the rest. With RabbitMQ, there’s almost a 14x difference in max latencies between the 5KB and 1MB runs with 1MB being the faster. With Kafka 0.8.2.2, the difference is over 126x in the same direction. We can plot the 1MB latencies for RabbitMQ and Kafka since it’s difficult to discern them with a linear scale.

RabbitMQ_Kafka_1MB_latency

tried to understand what was causing this behavior. I’ve yet to find a reasonable explanation for RabbitMQ. Intuition tells me it’s a result of buffering—either at the OS level or elsewhere—and the large messages cause more frequent flushing. Remember that these benchmarks were with transient publishes. There should be no disk accesses occurring, though my knowledge of Rabbit’s internals are admittedly limited. The fact that this behavior occurs in RabbitMQ and not Redis or NATS seems odd. Nagle’s algorithm is disabled in all of the benchmarks (TCP_NODELAY). After inspecting packets with Wireshark, it doesn’t appear to be a problem with delayed acks.

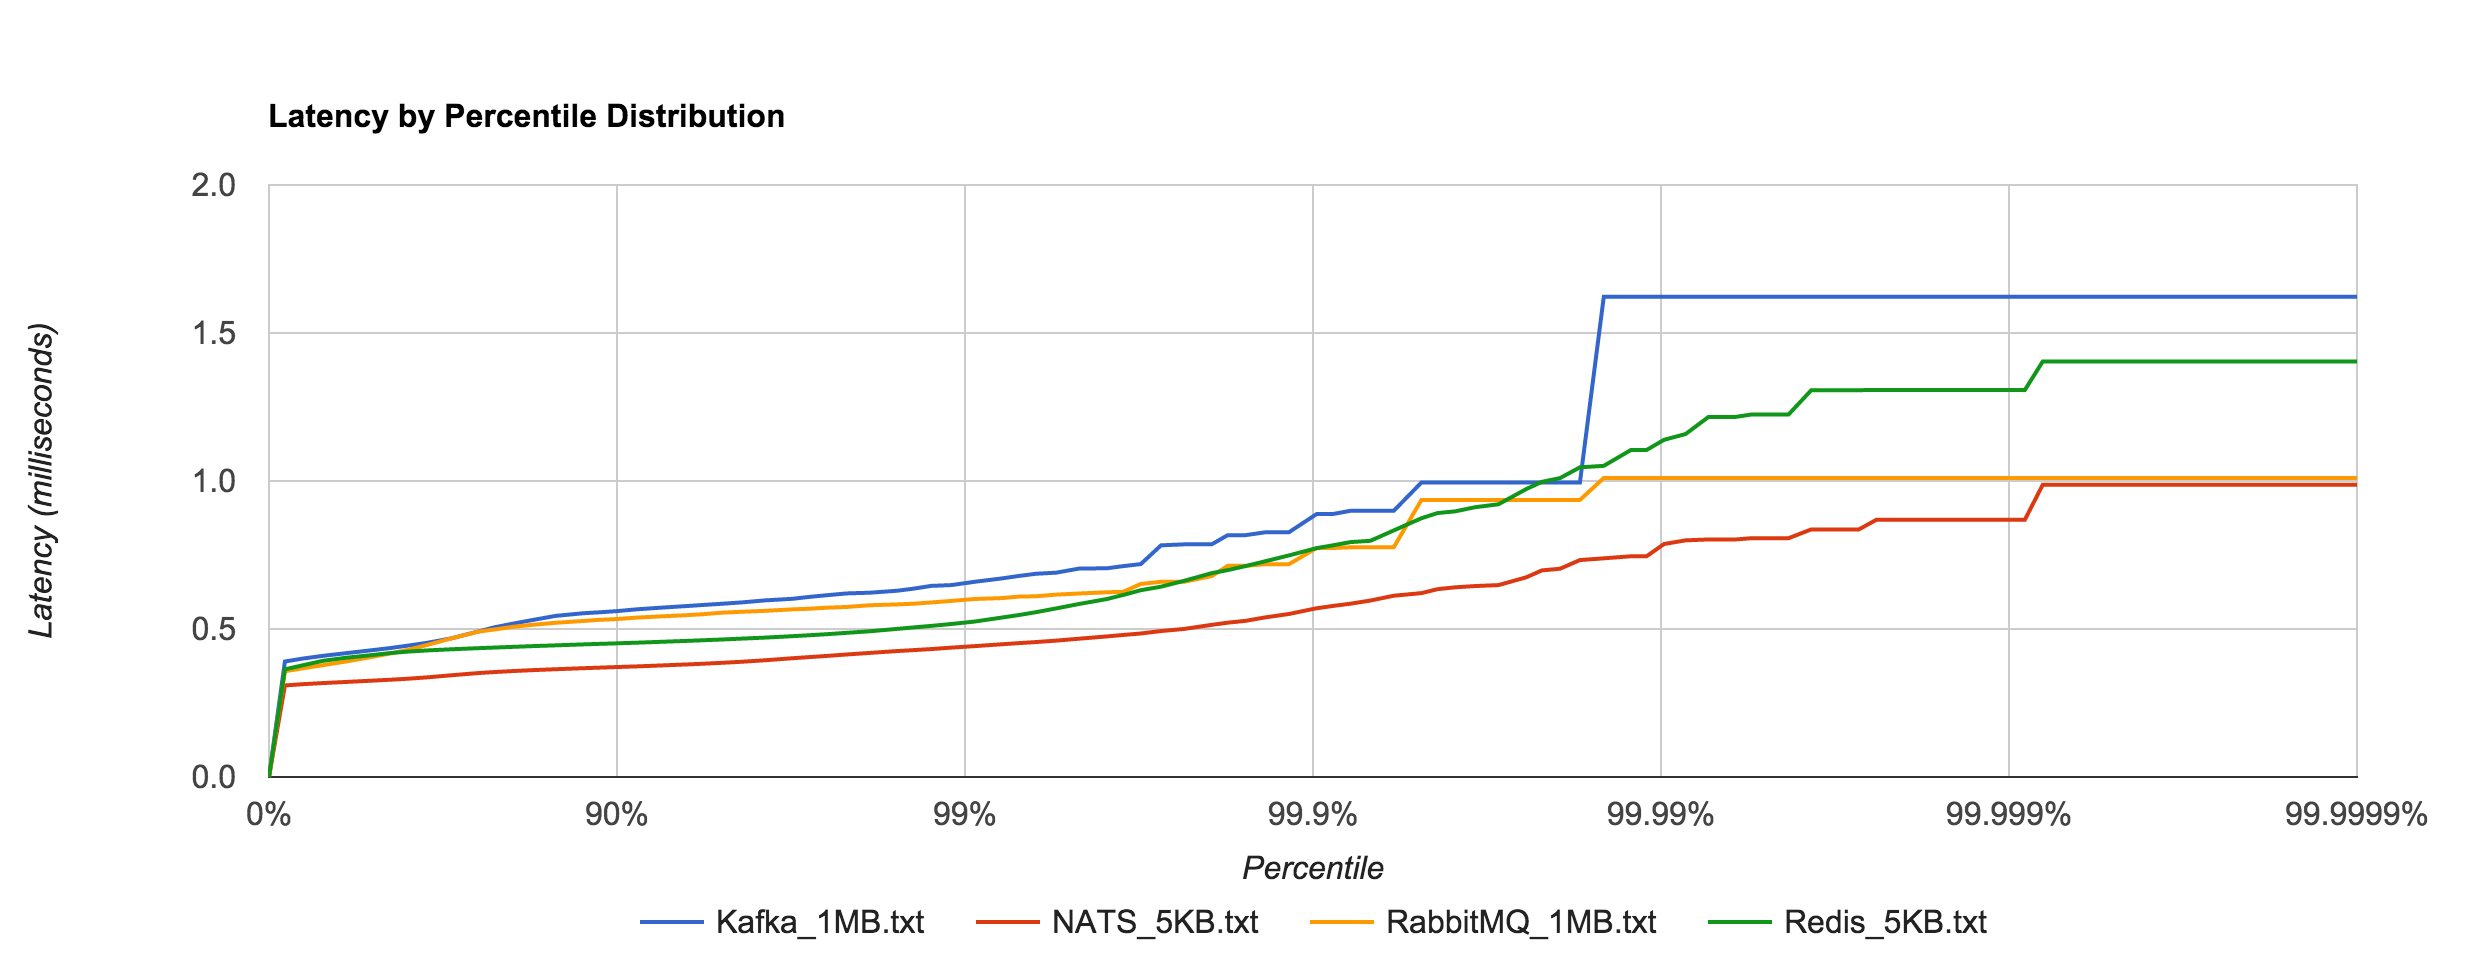
To show just how staggering the difference is, we can plot Kafka 0.8.2.2 and RabbitMQ 1MB latencies alongside Redis and NATS 5KB latencies. They are all within the same ballpark. Whatever the case may be, both RabbitMQ and Kafka appear to handle large messages extremely well in contrast to Redis and NATS.

RabbitMQ_Kafka_NATS_Redis_latency

This leads me to believe you’ll see better overall throughput, in terms of raw data, with RabbitMQ and Kafka, but more predictable, tighter tail latencies with Redis and NATS. Where SLAs are important, it’s hard to beat NATS. Of course, it’s unfair to compare Kafka with something like NATS or Redis or even RabbitMQ since they are very different (and sometimes complementary), but it’s also worth pointing out that the former is much more operationally complex.

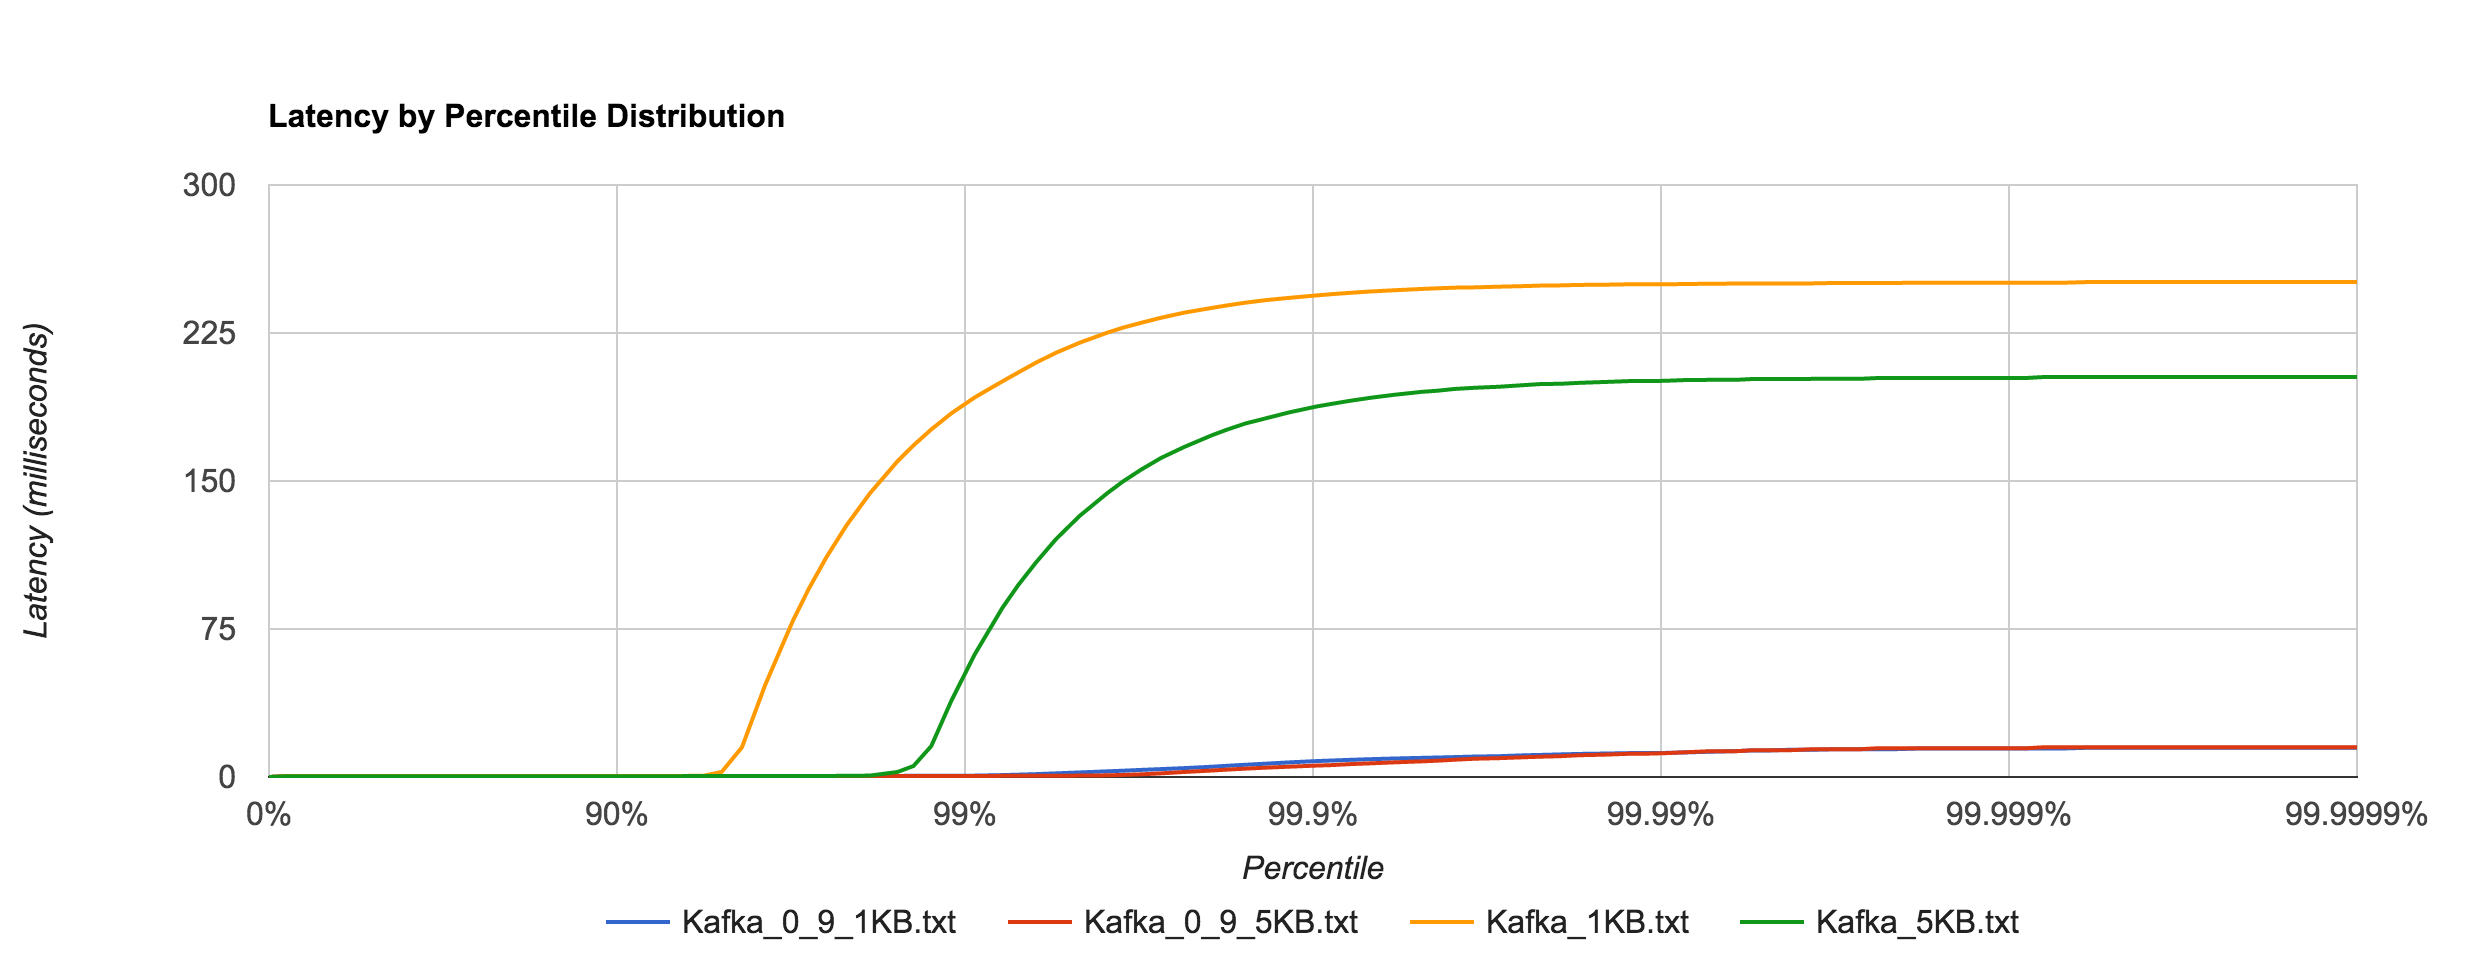
However, benchmarking Kafka 0.9.0.0 (blue and red) shows an astounding difference in tail latencies compared to 0.8.2.2 (orange and green).

Kafka_0_8_0_9_latency

Kafka 0.9’s performance is much more in line with RabbitMQ’s at high percentiles as seen below.

RabbitMQ_Kafka_0_9_latency

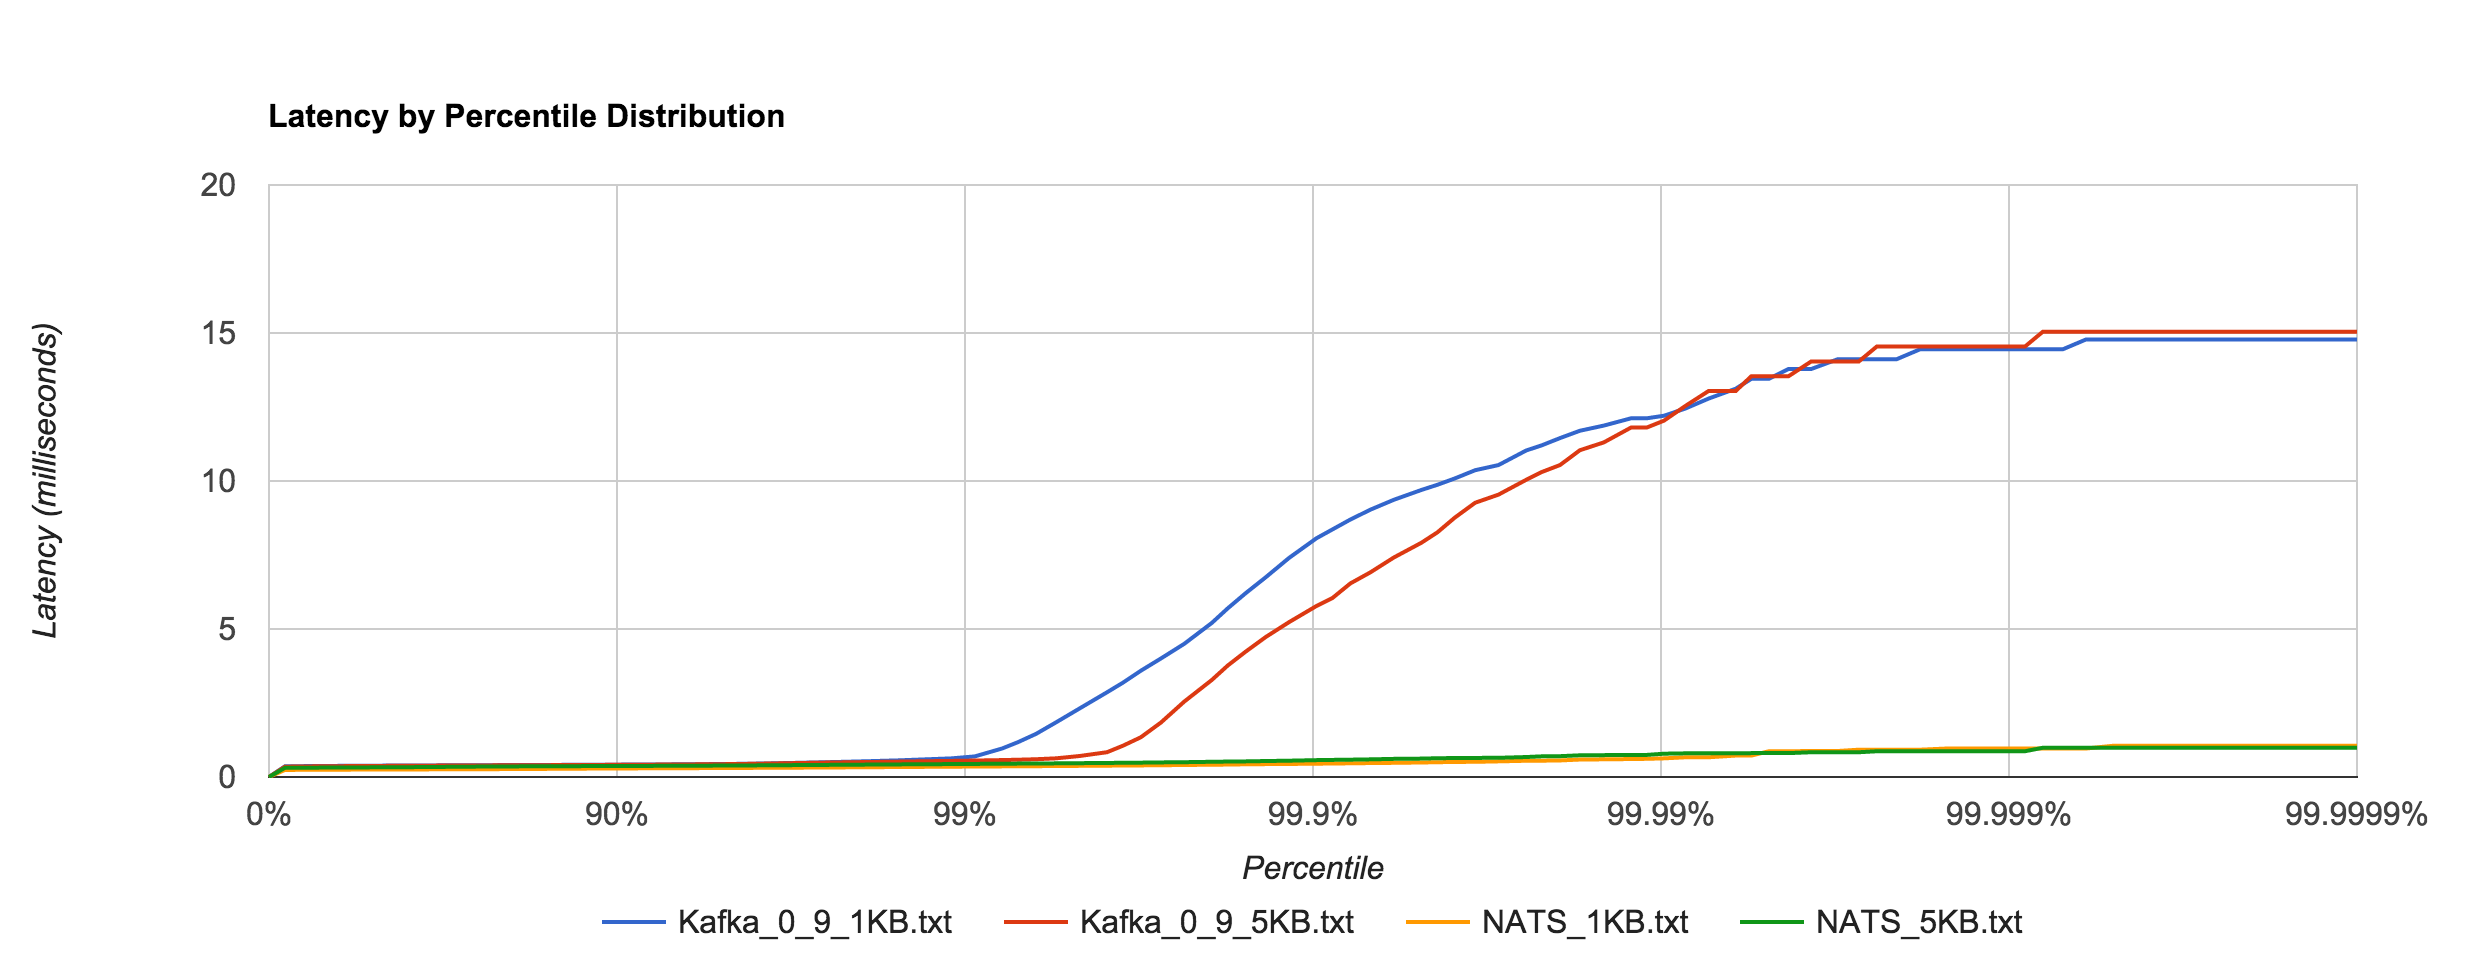
Likewise, it’s a much closer comparison to NATS when looking at the 1KB and 5KB runs.

Kafka_NATS_latency

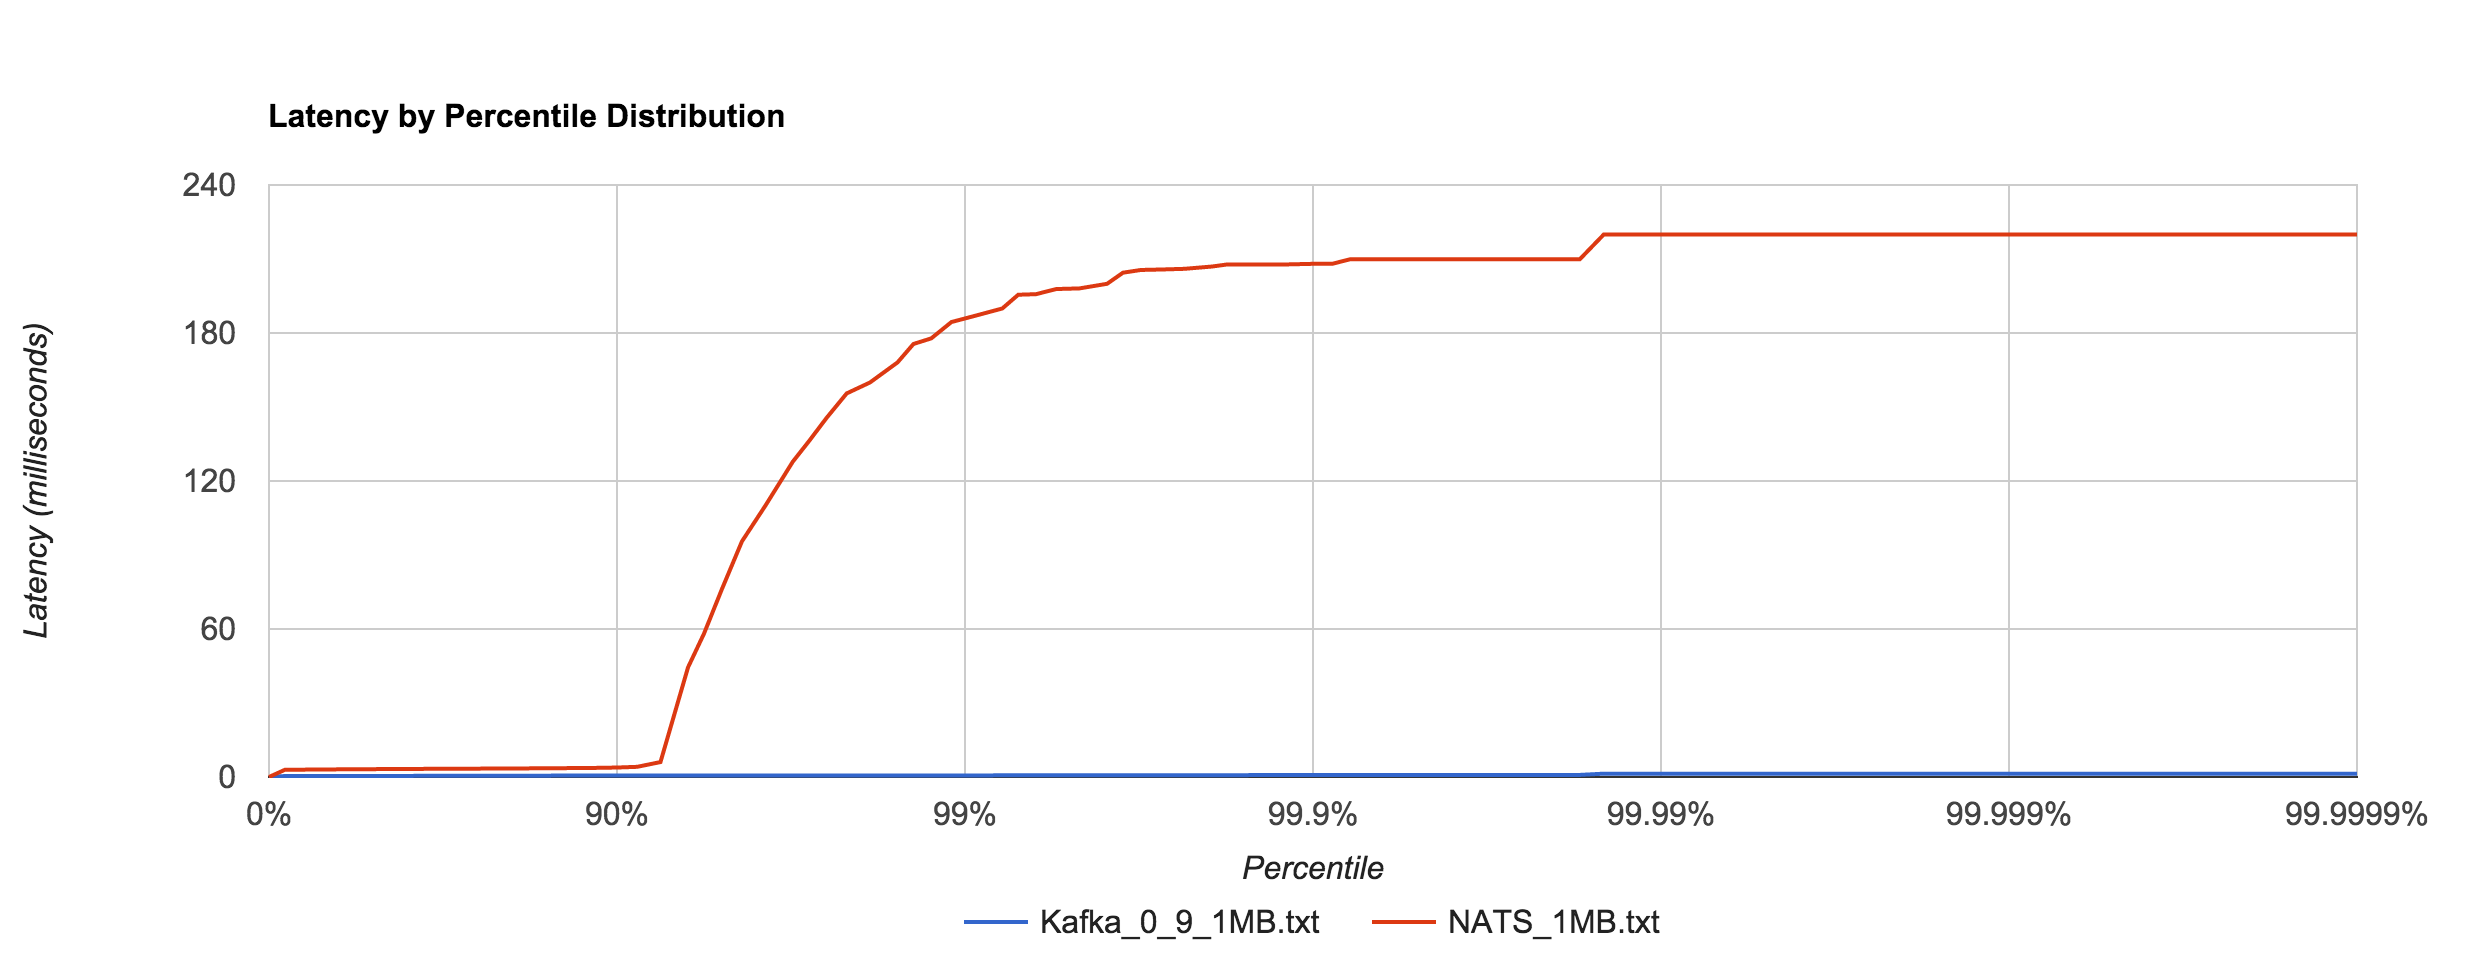
As with 0.8, Kafka 0.9 does an impressive job dealing with 1MB messages in comparison to NATS, especially when looking at the 92nd percentile and beyond. It’s hard to decipher in the graph below, but Kafka 0.9’s 99th, 99.9th, and 99.99th percentile latencies are 0.66, 0.78, and 1.35 ms, respectively.

Kafka_0_9_NATS_1MB

My initial thought was that the difference between Kafka 0.8 and 0.9 was attributed to a change in fsync behavior. To quote the Kafka documentation:

Kafka always immediately writes all data to the filesystem and supports the ability to configure the flush policy that controls when data is forced out of the OS cache and onto disk using the and flush. This flush policy can be controlled to force data to disk after a period of time or after a certain number of messages has been written.

However, there don’t appear to be any changes in the default flushing configuration between 0.8 and 0.9. The default configuration disables application fsync entirely, instead relying on the OS’s background flush. Jay Kreps indicates it’s a result of several “high percentile latency issues” that were fixed in 0.9. After scanning the 0.9 release notes, I was unable to determine specifically what those fixes might be. Either way, the difference is certainly not something to scoff at.

Conclusion

As always, interpret these benchmark results with a critical eye and perform your own tests if you’re evaluating these systems. This was more an exercise in benchmark methodology and tooling than an actual system analysis (and, as always, there’s still a lot of room for improvement). If anything, I think these results show how much we can miss by not looking beyond the 99th percentile. In almost all cases, everything looks pretty good up to that point, but after that things can get really bad. This is important to be conscious of when discussing SLAs.

I think the key takeaway is to consider your expected load in production, benchmark configurations around that, determine your allowable service levels, and iterate or provision more resources until you’re within those limits. The other important takeaway with respect to benchmarking is to look at the complete latency distribution. Otherwise, you’re not getting a clear picture of how your system actually behaves.

From the Ground Up: Reasoning About Distributed Systems in the Real World

The rabbit hole is deep. Down and down it goes. Where it ends, nobody knows. But as we traverse it, patterns appear. They give us hope, they quell the fear.

Distributed systems literature is abundant, but as a practitioner, I often find it difficult to know where to start or how to synthesize this knowledge without a more formal background. This is a non-academic’s attempt to provide a line of thought for rationalizing design decisions. This piece doesn’t necessarily contribute any new ideas but rather tries to provide a holistic framework by studying some influential existing ones. It includes references which provide a good starting point for thinking about distributed systems. Specifically, we look at a few formal results and slightly less formal design principles to provide a basis from which we can argue about system design.

This is your last chance. After this, there is no turning back. I wish I could say there is no red-pill/blue-pill scenario at play here, but the world of distributed systems is complex. In order to make sense of it, we reason from the ground up while simultaneously stumbling down the deep and cavernous rabbit hole.

Guiding Principles

In order to reason about distributed system design, it’s important to lay out some guiding principles or theorems used to establish an argument. Perhaps the most fundamental of which is the Two Generals Problem originally introduced by Akkoyunlu et al. in Some Constraints and Trade-offs in the Design of Network Communications and popularized by Jim Gray in Notes on Data Base Operating Systems in 1975 and 1978, respectively. The Two Generals Problem demonstrates that it’s impossible for two processes to agree on a decision over an unreliable network. It’s closely related to the binary consensus problem (“attack” or “don’t attack”) where the following conditions must hold:

  • Termination: all correct processes decide some value (liveness property).
  • Validity: if all correct processes decide v, then v must have been proposed by some correct process (non-triviality property).
  • Integrity: all correct processes decide at most one value v, and is the “right” value (safety property).
  • Agreement: all correct processes must agree on the same value (safety property).

It becomes quickly apparent that any useful distributed algorithm consists of some intersection of both liveness and safety properties. The problem becomes more complicated when we consider an asynchronous network with crash failures:

  • Asynchronous: messages may be delayed arbitrarily long but will eventually be delivered.
  • Crash failure: processes can halt indefinitely.

Considering this environment actually leads us to what is arguably one of the most important results in distributed systems theory: the FLP impossibility result introduced by Fischer, Lynch, and Patterson in their 1985 paper Impossibility of Distributed Consensus with One Faulty Process. This result shows that the Two Generals Problem is provably impossible. When we do not consider an upper bound on the time a process takes to complete its work and respond in a crash-failure model, it’s impossible to make the distinction between a process that is crashed and one that is taking a long time to respond. FLP shows there is no algorithm which deterministically solves the consensus problem in an asynchronous environment when it’s possible for at least one process to crash. Equivalently, we say it’s impossible to have a perfect failure detector in an asynchronous system with crash failures.

When talking about fault-tolerant systems, it’s also important to consider Byzantine faults, which are essentially arbitrary faults. These include, but are not limited to, attacks which might try to subvert the system. For example, a security attack might try to generate or falsify messages. The Byzantine Generals Problem is a generalized version of the Two Generals Problem which describes this fault model. Byzantine fault tolerance attempts to protect against these threats by detecting or masking a bounded number of Byzantine faults.

Why do we care about consensus? The reason is it’s central to so many important problems in system design. Leader election implements consensus allowing you to dynamically promote a coordinator to avoid single points of failure. Distributed databases implement consensus to ensure data consistency across nodes. Message queues implement consensus to provide transactional or ordered delivery. Distributed init systems implement consensus to coordinate processes. Consensus is fundamentally an important problem in distributed programming.

It has been shown time and time again that networks, whether local-area or wide-area, are often unreliable and largely asynchronous. As a result, these proofs impose real and significant challenges to system design.

The implications of these results are not simply academic: these impossibility results have motivated a proliferation of systems and designs offering a range of alternative guarantees in the event of network failures.

L. Peter Deutsch’s fallacies of distributed computing are a key jumping-off point in the theory of distributed systems. It presents a set of incorrect assumptions which many new to the space frequently make, of which the first is “the network is reliable.”

  1. The network is reliable.
  2. Latency is zero.
  3. Bandwidth is infinite.
  4. The network is secure.
  5. Topology doesn’t change.
  6. There is one administrator.
  7. Transport cost is zero.
  8. The network is homogeneous.

The CAP theorem, while recently the subject of scrutiny and debate over whether it’s overstated or not, is a useful tool for establishing fundamental trade-offs in distributed systems and detecting vendor sleight of hand. Gilbert and Lynch’s Perspectives on the CAP Theorem lays out the intrinsic trade-off between safety and liveness in a fault-prone system, while Fox and Brewer’s Harvest, Yield, and Scalable Tolerant Systems characterizes it in a more pragmatic light. I will continue to say unequivocally that the CAP theorem is important within the field of distributed systems and of significance to system designers and practitioners.

A Renewed Hope

Following from the results detailed earlier would imply many distributed algorithms, including those which implement linearizable operations, serializable transactions, and leader election, are a hopeless endeavor. Is it game over? Fortunately, no. Carefully designed distributed systems can maintain correctness without relying on pure coincidence.

First, it’s important to point out that the FLP result does not indicate consensus is unreachable, just that it’s not always reachable in bounded time. Second, the system model FLP uses is, in some ways, a pathological one. Synchronous systems place a known upper bound on message delivery between processes and on process computation. Asynchronous systems have no fixed upper bounds. In practice, systems tend to exhibit partial synchrony, which is described as one of two models by Dwork and Lynch in Consensus in the Presence of Partial Synchrony. In the first model of partial synchrony, fixed bounds exist but they are not known a priori. In the second model, the bounds are known but are only guaranteed to hold starting at unknown time T. Dwork and Lynch present fault-tolerant consensus protocols for both partial-synchrony models combined with various fault models.

Chandra and Toueg introduce the concept of unreliable failure detectors in Unreliable Failure Detectors for Reliable Distributed Systems. Each process has a local, external failure detector which can make mistakes. The detector monitors a subset of the processes in the system and maintains a list of those it suspects to have crashed. Failures are detected by simply pinging each process periodically and suspecting any process which doesn’t respond to the ping within twice the maximum round-trip time for any previous ping. The detector makes a mistake when it erroneously suspects a correct process, but it may later correct the mistake by removing the process from its list of suspects. The presence of failure detectors, even unreliable ones, makes consensus solvable in a slightly relaxed system model.

While consensus ensures processes agree on a value, atomic broadcast ensures processes deliver the same messages in the same order. This same paper shows that the problems of consensus and atomic broadcast are reducible to each other, meaning they are equivalent. Thus, the FLP result and others apply equally to atomic broadcast, which is used in coordination services like Apache ZooKeeper.

In Introduction to Reliable and Secure Distributed Programming, Cachin, Guerraoui, and Rodrigues suggest most practical systems can be described as partially synchronous:

Generally, distributed systems appear to be synchronous. More precisely, for most systems that we know of, it is relatively easy to define physical time bounds that are respected most of the time. There are, however, periods where the timing assumptions do not hold, i.e., periods during which the system is asynchronous. These are periods where the network is overloaded, for instance, or some process has a shortage of memory that slows it down. Typically, the buffer that a process uses to store incoming and outgoing messages may overflow, and messages may thus get lost, violating the time bound on the delivery. The retransmission of the messages may help ensure the reliability of the communication links but introduce unpredictable delays. In this sense, practical systems are partially synchronous.

We capture partial synchrony by assuming timing assumptions only hold eventually without stating exactly when. Similarly, we call the system eventually synchronous. However, this does not guarantee the system is synchronous forever after a certain time, nor does it require the system to be initially asynchronous then after a period of time become synchronous. Instead it implies the system has periods of asynchrony which are not bounded, but there are periods where the system is synchronous long enough for an algorithm to do something useful or terminate. The key thing to remember with asynchronous systems is that they contain no timing assumptions.

Lastly, On the Minimal Synchronism Needed for Distributed Consensus by Dolev, Dwork, and Stockmeyer describes a consensus protocol as t-resilient if it operates correctly when at most t processes fail. In the paper, several critical system parameters and synchronicity conditions are identified, and it’s shown how varying them affects the t-resiliency of an algorithm. Consensus is shown to be provably possible for some models and impossible for others.

Fault-tolerant consensus is made possible by relying on quorums. The intuition is that as long as a majority of processes agree on every decision, there is at least one process which knows about the complete history in the presence of faults.

Deterministic consensus, and by extension a number of other useful algorithms, is impossible in certain system models, but we can model most real-world systems in a way that circumvents this. Nevertheless, it shows the inherent complexities involved with distributed systems and the rigor needed to solve certain problems.

Theory to Practice

What does all of this mean for us in practice? For starters, it means distributed systems are usually a harder problem than they let on. Unfortunately, this is often the cause of improperly documented trade-offs or, in many cases, data loss and safety violations. It also suggests we need to rethink the way we design systems by shifting the focus from system properties and guarantees to business rules and application invariants.

One of my favorite papers is End-To-End Arguments in System Design by Saltzer, Reed, and Clark. It’s an easy read, but it presents a compelling design principle for determining where to place functionality in a distributed system. The principle idea behind the end-to-end argument is that functions placed at a low level in a system may be redundant or of little value when compared to the cost of providing them at that low level. It follows that, in many situations, it makes more sense to flip guarantees “inside out”—pushing them outwards rather than relying on subsystems, middleware, or low-level layers of the stack to maintain them.

To illustrate this, we consider the problem of “careful file transfer.” A file is stored by a file system on the disk of computer A, which is linked by a communication network to computer B. The goal is to move the file from computer A’s storage to computer B’s storage without damage and in the face of various failures along the way. The application in this case is the file-transfer program which relies on storage and network abstractions. We can enumerate just a few of the potential problems an application designer might be concerned with:

  1. The file, though originally written correctly onto the disk at host A, if read now may contain incorrect data, perhaps because of hardware faults in the disk storage system.
  2. The software of the file system, the file transfer program, or the data communication system might make a mistake in buffering and copying the data of the file, either at host A or host B.
  3. The hardware processor or its local memory might have a transient error while doing the buffering and copying, either at host A or host B.
  4. The communication system might drop or change the bits in a packet, or lose a packet or deliver a packet more than once.
  5. Either of the hosts may crash part way through the transaction after performing an unknown amount (perhaps all) of the transaction.

Many of these problems are Byzantine in nature. When we consider each threat one by one, it becomes abundantly clear that even if we place countermeasures in the low-level subsystems, there will still be checks required in the high-level application. For example, we might place checksums, retries, and sequencing of packets in the communication system to provide reliable data transmission, but this really only eliminates threat four. An end-to-end checksum and retry mechanism at the file-transfer level is needed to guard against the remaining threats.

Building reliability into the low level has a number of costs involved. It takes a non-trivial amount of effort to build it. It’s redundant and, in fact, hinders performance by reducing the frequency of application retries and adding unneeded overhead. It also has no actual effect on correctness because correctness is determined and enforced by the end-to-end checksum and retries. The reliability and correctness of the communication system is of little importance, so going out of its way to ensure resiliency does not reduce any burden on the application. In fact, ensuring correctness by relying on the low level might be altogether impossible since threat number two requires writing correct programs, but not all programs involved may be written by the file-transfer application programmer.

Fundamentally, there are two problems with placing functionality at the lower level. First, the lower level is not aware of the application needs or semantics, which means logic placed there is often insufficient. This leads to duplication of logic as seen in the example earlier. Second, other applications which rely on the lower level pay the cost of the added functionality even when they don’t necessarily need it.

Saltzer, Reed, and Clark propose the end-to-end principle as a sort of “Occam’s razor” for system design, arguing that it helps guide the placement of functionality and organization of layers in a system.

Because the communication subsystem is frequently specified before applications that use the subsystem are known, the designer may be tempted to “help” the users by taking on more function than necessary. Awareness of end-to end arguments can help to reduce such temptations.

However, it’s important to note that the end-to-end principle is not a panacea. Rather, it’s a guideline to help get designers to think about their solutions end to end, acknowledge their application requirements, and consider their failure modes. Ultimately, it provides a rationale for moving function upward in a layered system, closer to the application that uses the function, but there are always exceptions to the rule. Low-level mechanisms might be built as a performance optimization. Regardless, the end-to-end argument contends that lower levels should avoid taking on any more responsibility than necessary. The “lessons” section from Google’s Bigtable paper echoes some of these same sentiments:

Another lesson we learned is that it is important to delay adding new features until it is clear how the new features will be used. For example, we initially planned to support general-purpose transactions in our API. Because we did not have an immediate use for them, however, we did not implement them. Now that we have many real applications running on Bigtable, we have been able to examine their actual needs, and have discovered that most applications require only single-row transactions. Where people have requested distributed transactions, the most important use is for maintaining secondary indices, and we plan to add a specialized mechanism to satisfy this need. The new mechanism will be less general than distributed transactions, but will be more efficient (especially for updates that span hundreds of rows or more) and will also interact better with our scheme for optimistic cross-datacenter replication.

We’ll see the end-to-end argument as a common theme throughout the remainder of this piece.

Whose Guarantee Is It Anyway?

Generally, we rely on robust algorithms, transaction managers, and coordination services to maintain consistency and application correctness. The problem with these is twofold: they are often unreliable and they impose a massive performance bottleneck.

Distributed coordination algorithms are difficult to get right. Even tried-and-true protocols like two-phase commit are susceptible to crash failures and network partitions. Protocols which are more fault tolerant like Paxos and Raft generally don’t scale well beyond small clusters or across wide-area networks. Consensus systems like ZooKeeper own your availability, meaning if you depend on one and it goes down, you’re up a creek. Since quorums are often kept small for performance reasons, this might be less rare than you think.

Coordination systems become a fragile and complex piece of your infrastructure, which seems ironic considering they are usually employed to reduce fragility. On the other hand, message-oriented middleware largely use coordination to provide developers with strong guarantees: exactly-once, ordered, transactional delivery and the like.

From transmission protocols to enterprise message brokers, relying on delivery guarantees is an anti-pattern in distributed system design. Delivery semantics are a tricky business. As such, when it comes to distributed messaging, what you want is often not what you need. It’s important to look at the trade-offs involved, how they impact system design (and UX!), and how we can cope with them to make better decisions.

Subtle and not-so-subtle failure modes make providing strong guarantees exceedingly difficult. In fact, some guarantees, like exactly-once delivery, aren’t even really possible to achieve when we consider things like the Two Generals Problem and the FLP result. When we try to provide semantics like guaranteed, exactly-once, and ordered message delivery, we usually end up with something that’s over-engineered, difficult to deploy and operate, fragile, and slow. What is the upside to all of this? Something that makes your life easier as a developer when things go perfectly well, but the reality is things don’t go perfectly well most of the time. Instead, you end up getting paged at 1 a.m. trying to figure out why RabbitMQ told your monitoring everything is awesome while proceeding to take a dump in your front yard.

If you have something that relies on these types of guarantees in production, know that this will happen to you at least once sooner or later (and probably much more than that). Eventually, a guarantee is going to break down. It might be inconsequential, it might not. Not only is this a precarious way to go about designing things, but if you operate at a large scale, care about throughput, or have sensitive SLAs, it’s probably a nonstarter.

The performance implications of distributed transactions are obvious. Coordination is expensive because processes can’t make progress independently, which in turn limits throughput, availability, and scalability. Peter Bailis gave an excellent talk called Silence is Golden: Coordination-Avoiding Systems Design which explains this in great detail and how coordination can be avoided. In it, he explains how distributed transactions can result in nearly a 400x decrease in throughput in certain situations.

Avoiding coordination enables infinite scale-out while drastically improving throughput and availability, but in some cases coordination is unavoidable. In Coordination Avoidance in Database Systems, Bailis et al. answer a key question: when is coordination necessary for correctness? They present a property, invariant confluence (I-confluence), which is necessary and sufficient for safe, coordination-free, available, and convergent execution. I-confluence essentially works by pushing invariants up into the business layer where we specify correctness in terms of application semantics rather than low-level database operations.

Without knowledge of what “correctness” means to your app (e.g., the invariants used in I-confluence), the best you can do to preserve correctness under a read/write model is serializability.

I-confluence can be determined given a set of transactions and a merge function used to reconcile divergent states. If I-confluence holds, there exists a coordination-free execution strategy that preserves invariants. If it doesn’t hold, no such strategy exists—coordination is required. I-confluence allows us to identify when we can and can’t give up coordination, and by pushing invariants up, we remove a lot of potential bottlenecks from areas which don’t require it.

If we recall, “synchrony” within the context of distributed computing is really just making assumptions about time, so synchronization is basically two or more processes coordinating around time. As we saw, a system which performs no coordination will have optimal performance and availability since everyone can proceed independently. However, a distributed system which performs zero coordination isn’t particularly useful or possible as I-confluence shows. Christopher Meiklejohn’s Strange Loop talk, Distributed, Eventually Consistent Computations, provides an interesting take on coordination with the parable of the car. A car requires friction to drive, but that friction is limited to very small contact points. Any other friction on the car causes problems or inefficiencies. If we think about physical time as friction, we know we can’t eliminate it altogether because it’s essential to the problem, but we want to reduce the use of it in our systems as much as possible. We can typically avoid relying on physical time by instead using logical time, for example, with the use of Lamport clocks or other conflict-resolution techniques. Lamport’s Time, Clocks, and the Ordering of Events in a Distributed System is the classical introduction to this idea.

Often, systems simply forgo coordination altogether for latency-sensitive operations, a perfectly reasonable thing to do provided the trade-off is explicit and well-documented. Sadly, this is frequently not the case. But we can do better. I-confluence provides a useful framework for avoiding coordination, but there’s a seemingly larger lesson to be learned here. What it really advocates is reexamining how we design systems, which seems in some ways to closely parallel our end-to-end argument.

When we think low level, we pay the upfront cost of entry—serializable transactions, linearizable reads and writes, coordination. This seems contradictory to the end-to-end principle. Our application doesn’t really care about atomicity or isolation levels or linearizability. It cares about two users sharing the same ID or two reservations booking the same room or a negative balance in a bank account, but the database doesn’t know that. Sometimes these rules don’t even require any expensive coordination.

If all we do is code our business rules and constraints into the language our infrastructure understands, we end up with a few problems. First, we have to know how to translate our application semantics into these low-level operations while avoiding any impedance mismatch. In the context of messaging, guaranteed delivery doesn’t really mean anything to our application which cares about what’s done with the messages. Second, we preclude ourselves from using a lot of generalized solutions and, in some cases, we end up having to engineer specialized ones ourselves. It’s not clear how well this scales in practice. Third, we pay a performance penalty that could otherwise be avoided (as I-confluence shows). Lastly, we put ourselves at the mercy of our infrastructure and hope it makes good on its promises—it often doesn’t.

Working on a messaging platform team, I’ve had countless conversations which resemble the following exchange:

Developer: “We need fast messaging.”
Me: “Is it okay if messages get dropped occasionally?”
Developer: “What? Of course not! We need it to be reliable.”
Me: “Okay, we’ll add a delivery ack, but what happens if your application crashes before it processes the message?”
Developer: “We’ll ack after processing.”
Me: “What happens if you crash after processing but before acking?”
Developer: “We’ll just retry.”
Me: “So duplicate delivery is okay?”
Developer: “Well, it should really be exactly-once.”
Me: “But you want it to be fast?”
Developer: “Yep. Oh, and it should maintain message ordering.”
Me: “Here’s TCP.”

If, instead, we reevaluate the interactions between our systems, their APIs, their semantics, and move some of that responsibility off of our infrastructure and onto our applications, then maybe we can start to build more robust, resilient, and performant systems. With messaging, does our infrastructure really need to enforce FIFO ordering? Preserving order with distributed messaging in the presence of failure while trying to simultaneously maintain high availability is difficult and expensive. Why rely on it when it can be avoided with commutativity? Likewise, transactional delivery requires coordination which is slow and brittle while still not providing application guarantees. Why rely on it when it can be avoided with idempotence and retries? If you need application-level guarantees, build them into the application level. The infrastructure can’t provide it.

I really like Gregor Hohpe’s “Your Coffee Shop Doesn’t Use Two-Phase Commit” because it shows how simple solutions can be if we just model them off of the real world. It gives me hope we can design better systems, sometimes by just turning things on their head. There’s usually a reason things work the way they do, and it often doesn’t even involve the use of computers or complicated algorithms.

Rather than try to hide complexities by using flaky and heavy abstractions, we should engage directly by recognizing them in our design decisions and thinking end to end. It may be a long and winding path to distributed systems zen, but the best place to start is from the beginning.

I’d like to thank Tom Santero for reviewing an early draft of this writing. Any inaccuracies or opinions expressed are mine alone.