Disclaimer (10/29/20) – The benchmarks and performance analysis presented in this post should not be relied on. This post was written roughly six years ago, and at the time, was just the result of my exploration of various messaging systems. The benchmarks are not implemented in a meaningful way, which I discussed in a follow-up post. This post will remain for posterity and learning purposes, but I do not claim that this information is accurate or useful.
Continuing my series on message queues, I spent this weekend dissecting various libraries for performing distributed messaging. In this analysis, I look at a few different aspects, including API characteristics, ease of deployment and maintenance, and performance qualities. The message queues have been categorized into two groups: brokerless and brokered. Brokerless message queues are peer-to-peer such that there is no middleman involved in the transmission of messages, while brokered queues have some sort of server in between endpoints.
The systems I’ll be analyzing are:
**Brokerless
**nanomsg
ZeroMQ
**Brokered
**ActiveMQ
NATS
Kafka
Kestrel
NSQ
RabbitMQ
Redis
ruby-nats
To start, let’s look at the performance metrics since this is arguably what people care the most about. I’ve measured two key metrics: throughput and latency. All tests were run on a MacBook Pro 2.6 GHz i7, 16GB RAM. These tests are evaluating a publish-subscribe topology with a single producer and single consumer. This provides a good baseline. It would be interesting to benchmark a scaled-up topology but requires more instrumentation.
The code used for benchmarking, written in Go, is available on GitHub. The results below shouldn’t be taken as gospel as there are likely optimizations that can be made to squeeze out performance gains. Pull requests are welcome.
Throughput Benchmarks
Throughput is the number of messages per second the system is able to process, but what’s important to note here is that there is no single “throughput” that a queue might have. We’re sending messages between two different endpoints, so what we observe is a “sender” throughput and a “receiver” throughput—that is, the number of messages that can be sent per second and the number of messages that can be received per second.
This test was performed by sending 1,000,000 1KB messages and measuring the time to send and receive on each side. Many performance tests tend to use smaller messages in the range of 100 to 500 bytes. I chose 1KB because it’s more representative of what you might see in a production environment, although this varies case by case. For message-oriented middleware systems, only one broker was used. In most cases, a clustered environment would yield much better results.
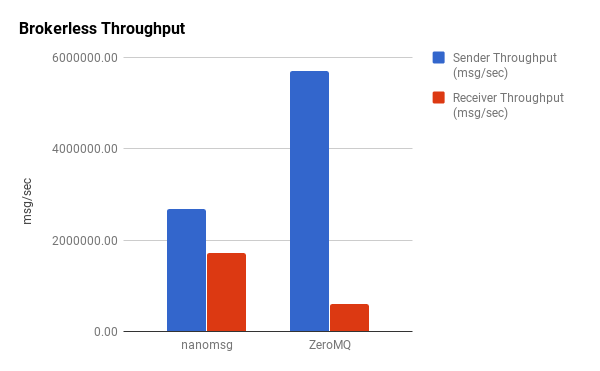
Unsurprisingly, there’s higher throughput on the sending side. What’s interesting, however, is the disparity in the sender-to-receiver ratios. ZeroMQ is capable of sending over 5,000,000 messages per second but is only able to receive about 600,000/second. In contrast, nanomsg sends shy of 3,000,000/second but can receive almost 2,000,000.
Now let’s take a look at the brokered message queues.
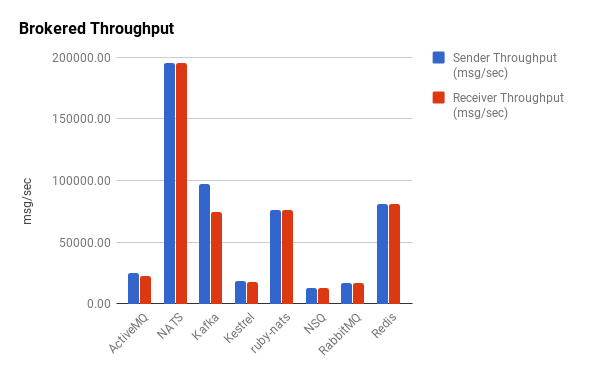
Intuitively, we observe that brokered message queues have dramatically less throughput than their brokerless counterparts by a couple orders of magnitude for the most part. Half the brokered queues have a throughput below 25,000 messages/second. The numbers for Redis might be a bit misleading though. Despite providing pub/sub functionality, it’s not really designed to operate as a robust messaging queue. In a similar fashion to ZeroMQ, Redis disconnects slow clients, and it’s important to point out that it was not able to reliably handle this volume of messaging. As such, we consider it an outlier. Kafka and ruby-nats have similar performance characteristics to Redis but were able to reliably handle the message volume without intermittent failures. The Go implementation of NATS, gnatsd, has exceptional throughput for a brokered message queue.
Outliers aside, we see that the brokered queues have fairly uniform throughputs. Unlike the brokerless libraries, there is little-to-no disparity in the sender-to-receiver ratios, which themselves are all very close to one.
Latency Benchmarks
The second key performance metric is message latency. This measures how long it takes for a message to be transmitted between endpoints. Intuition might tell us that this is simply the inverse of throughput, i.e. if throughput is messages/second, latency is seconds/message. However, by looking closely at this image borrowed from a ZeroMQ white paper, we can see that this isn’t quite the case.

The reality is that the latency per message sent over the wire is not uniform. It can vary wildly for each one. In truth, the relationship between latency and throughput is a bit more involved. Unlike throughput, however, latency is not measured at the sender or the receiver but rather as a whole. But since each message has its own latency, we will look at the averages of all of them. Going further, we will see how the average message latency fluctuates in relation to the number of messages sent. Again, intuition tells us that more messages means more queueing, which means higher latency.
As we did before, we’ll start by looking at the brokerless systems.
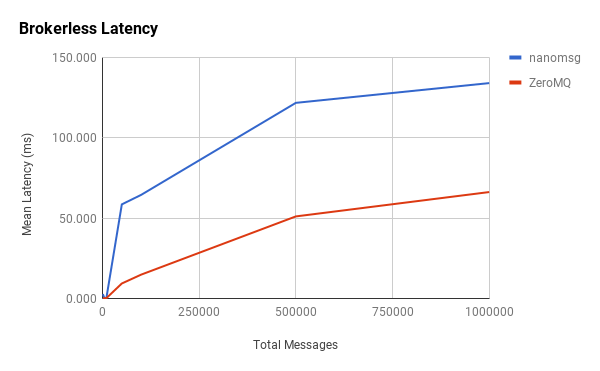
In general, our hypothesis proves correct in that, as more messages are sent through the system, the latency of each message increases. What’s interesting is the tapering at the 500,000-point in which latency appears to increase at a slower rate as we approach 1,000,000 messages. Another interesting observation is the initial spike in latency between 1,000 and 5,000 messages, which is more pronounced with nanomsg. It’s difficult to pinpoint causation, but these changes might be indicative of how message batching and other network-stack traversal optimizations are implemented in each library. More data points may provide better visibility.
We see some similar patterns with brokered queues and also some interesting new ones.
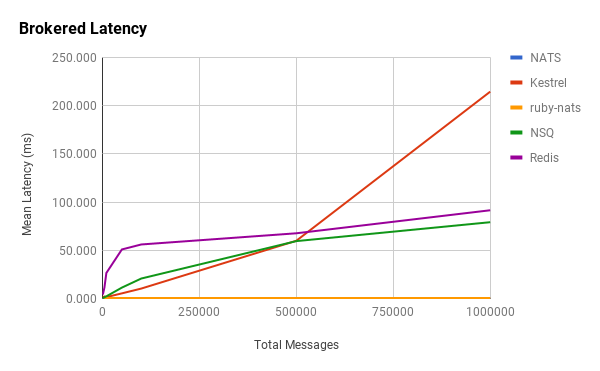
Redis behaves in a similar manner as before, with an initial latency spike and then a quick tapering off. It differs in that the tapering becomes essentially constant right after 5,000 messages. NSQ doesn’t exhibit the same spike in latency and behaves, more or less, linearly. Kestrel fits our hypothesis.
Notice that ruby-nats and NATS hardly even register on the chart. They exhibited surprisingly low latencies and unexpected relationships with the number of messages.
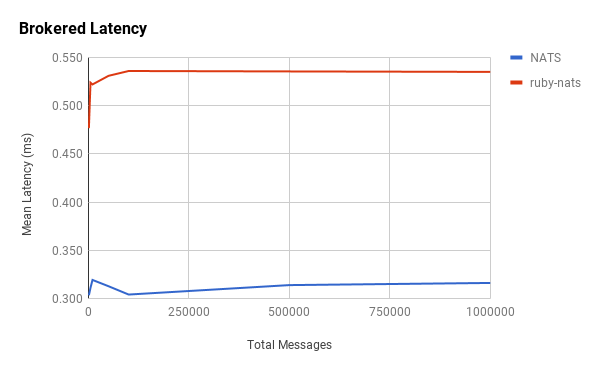
Interestingly, the message latencies for ruby-nats and NATS appear to be constant. This is counterintuitive to our hypothesis.
You may have noticed that Kafka, ActiveMQ, and RabbitMQ were absent from the above charts. This was because their latencies tended to be orders-of-magnitude higher than the other brokered message queues, so ActiveMQ and RabbitMQ were grouped into their own AMQP category. I’ve also included Kafka since it’s in the same ballpark.
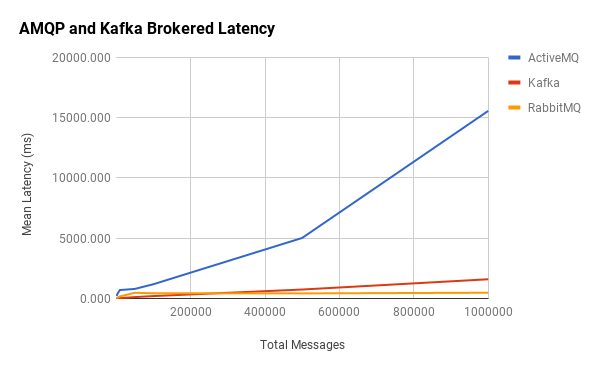
Here we see that RabbitMQ’s latency is constant, while ActiveMQ and Kafka are linear. What’s unclear is the apparent disconnect between their throughput and mean latencies.
Qualitative Analysis
Now that we’ve seen some empirical data on how these different libraries perform, I’ll take a look at how they work from a pragmatic point of view. Message throughput and speed is important, but it isn’t very practical if the library is difficult to use, deploy, or maintain.
ZeroMQ and Nanomsg
Technically speaking, nanomsg isn’t a message queue but rather a socket-style library for performing distributed messaging through a variety of convenient patterns. As a result, there’s nothing to deploy aside from embedding the library itself within your application. This makes deployment a non-issue.
Nanomsg is written by one of the ZeroMQ authors, and as I discussed before, works in a very similar way to that library. From a development standpoint, nanomsg provides an overall cleaner API. Unlike ZeroMQ, there is no notion of a context in which sockets are bound to. Furthermore, nanomsg provides pluggable transport and messaging protocols, which make it more open to extension. Its additional built-in scalability protocols also make it quite appealing.
Like ZeroMQ, it guarantees that messages will be delivered atomically intact and ordered but does not guarantee the delivery of them. Partial messages will not be delivered, and it’s possible that some messages won’t be delivered at all. The library’s author, Martin Sustrik, makes this abundantly clear:
Guaranteed delivery is a myth. Nothing is 100% guaranteed. That’s the nature of the world we live in. What we should do instead is to build an internet-like system that is resilient in face of failures and routes around damage.
The philosophy is to use a combination of topologies to build resilient systems that add in these guarantees in a best-effort sort of way.
On the other hand, nanomsg is still in beta and may not be considered production-ready. Consequently, there aren’t a lot of resources available and not much of a development community around it.
ZeroMQ is a battle-tested messaging library that’s been around since 2007. Some may perceive it as a predecessor to nanomsg, but what nano lacks is where ZeroMQ thrives—a flourishing developer community and a deluge of resources and supporting material. For many, it’s the de facto tool for building fast, asynchronous distributed messaging systems that scale.
Like nanomsg, ZeroMQ is not a message-oriented middleware and simply operates as a socket abstraction. In terms of usability, it’s very much the same as nanomsg, although its API is marginally more involved.
ActiveMQ and RabbitMQ
ActiveMQ and RabbitMQ are implementations of AMQP. They act as brokers which ensure messages are delivered. ActiveMQ and RabbitMQ support both persistent and non-persistent delivery. By default, messages are written to disk such that they survive a broker restart. They also support synchronous and asynchronous sending of messages with the former having substantial impact on latency. To guarantee delivery, these brokers use message acknowledgements which also incurs a massive latency penalty.
As far as availability and fault tolerance goes, these brokers support clustering through shared storage or shared nothing. Queues can be replicated across clustered nodes so there is no single point of failure or message loss.
AMQP is a non-trivial protocol which its creators claim to be over-engineered. These additional guarantees are made at the expense of major complexity and performance trade-offs. Fundamentally, clients are more difficult to implement and use.
Since they’re message brokers, ActiveMQ and RabbitMQ are additional moving parts that need to be managed in your distributed system, which brings deployment and maintenance costs. The same is true for the remaining message queues being discussed.
NATS and Ruby-NATS
NATS (gnatsd) is a pure Go implementation of the ruby-nats messaging system. NATS is distributed messaging rethought to be less enterprisey and more lightweight (this is in direct contrast to systems like ActiveMQ, RabbitMQ, and others). Apcera’s Derek Collison, the library’s author and former TIBCO architect, describes NATS as “more like a nervous system” than an enterprise message queue. It doesn’t do persistence or message transactions, but it’s fast and easy to use. Clustering is supported so it can be built on top of with high availability and failover in mind, and clients can be sharded. Unfortunately, TLS and SSL are not yet supported in NATS (they are in the ruby-nats) but on the roadmap.
As we observed earlier, NATS performs far better than the original Ruby implementation. Clients can be used interchangeably with NATS and ruby-nats.
Kafka
Originally developed by LinkedIn, Kafka implements publish-subscribe messaging through a distributed commit log. It’s designed to operate as a cluster that can be consumed by large amounts of clients. Horizontal scaling is done effortlessly using ZooKeeper so that additional consumers and brokers can be introduced seamlessly. It also transparently takes care of cluster rebalancing.
Kafka uses a persistent commit log to store messages on the broker. Unlike other durable queues which usually remove persisted messages on consumption, Kafka retains them for a configured period of time. This means that messages can be “replayed” in the event that a consumer fails.
ZooKeeper makes managing Kafka clusters relatively easy, but it does introduce yet another element that needs to be maintained. That said, Kafka exposes a great API and Shopify has an excellent Go client called Sarama that makes interfacing with Kafka very accessible.
Kestrel
Kestrel is a distributed message queue open sourced by Twitter. It’s intended to be fast and lightweight. Because of this, it has no concept of clustering or failover. While Kafka is built from the ground up to be clustered through ZooKeeper, the onus of message partitioning is put upon the clients of Kestrel. There is no cross-communication between nodes. It makes this trade-off in the name of simplicity. It features durable queues, item expiration, transactional reads, and fanout queues while operating over Thrift or memcache protocols.
Kestrel is designed to be small, but this means that more work must be done by the developer to build out a robust messaging system on top of it. Kafka seems to be a more “all-in-one” solution.
NSQ
NSQ is a messaging platform built by Bitly. I use the word platform because there’s a lot of tooling built around NSQ to make it useful for real-time distributed messaging. The daemon that receives, queues, and delivers messages to clients is called nsqd. The daemon can run standalone, but NSQ is designed to run in as a distributed, decentralized topology. To achieve this, it leverages another daemon called nsqlookupd. Nsqlookupd acts as a service-discovery mechanism for nsqd instances. NSQ also provides nsqadmin, which is a web UI that displays real-time cluster statistics and acts as a way to perform various administrative tasks like clearing queues and managing topics.
By default, messages in NSQ are not durable. It’s primarily designed to be an in-memory message queue, but queue sizes can be configured such that after a certain point, messages will be written to disk. Despite this, there is no built-in replication. NSQ uses acknowledgements to guarantee message delivery, but the order of delivery is not guaranteed. Messages can also be delivered more than once, so it’s the developer’s responsibility to introduce idempotence.
Similar to Kafka, additional nodes can be added to an NSQ cluster seamlessly. It also exposes both an HTTP and TCP API, which means you don’t actually need a client library to push messages into the system. Despite all the moving parts, it’s actually quite easy to deploy. Its API is also easy to use and there are a number of client libraries available.
Redis
Last up is Redis. While Redis is great for lightweight messaging and transient storage, I can’t advocate its use as the backbone of a distributed messaging system. Its pub/sub is fast but its capabilities are limited. It would require a lot of work to build a robust system. There are solutions better suited to the problem, such as those described above, and there are also some scaling concerns with it.
These matters aside, Redis is easy to use, it’s easy to deploy and manage, and it has a relatively small footprint. Depending on the use case, it can be a great choice for real-time messaging as I’ve explored before.
Conclusion
The purpose of this analysis is not to present some sort of “winner” but instead showcase a few different options for distributed messaging. There is no “one-size-fits-all” option because it depends entirely on your needs. Some use cases require fast, fire-and-forget messages, others require delivery guarantees. In fact, many systems will call for a combination of these. My hope is that this dissection will offer some insight into which solutions work best for a given problem so that you can make an intelligent decision.
Comments
Comments are from this blog's WordPress era and are preserved read-only.
Thanks for this! Sorry if I missed this somewhere in your post, but just to be clear — were you testing RabbitMQ with persistent delivery on? (I’m specifically interested in the latency tests.)
Good catch—no message persistence.
I think your Kafka throughput numbers are well below what we’ve measured as well as what the community has measured. For example, see https://engineering.linkedin.com/kafka/benchmarking-apache-kafka-2-million-writes-second-three-cheap-machines. Kafka can easily hit hundreds of thousands of messages per second.
You have stated for RabbitMQ, “As far as availability and fault tolerance goes, these brokers support clustering through shared storage or shared nothing. Queues can be replicated across clustered nodes so there is no single point of failure or message loss.”
Unfortunately, RabbitMQ has problems with handling network partitions that can result in significant message loss. See, https://www.rabbitmq.com/partitions.html and
http://aphyr.com/posts/315-call-me-maybe-rabbitmq for some more details.
I had the same thought. It’s not really meaningful to compare a system like GNATS with no persistence at all to a system like Kafka which has nothing but persisted messages. They’re both “message queues” but they’re effectively apples and oranges in that space.
The author didn’t post the hard drive specs of the laptop, but I’m willing to be that’s a significant contributor to the low throughput.
The numbers could almost certainly be improved, which is why I’m open to anybody looking at the code and submitting tweaks. As I said, these results shouldn’t be taken as gospel—this is just a first pass using the frameworks out of the box.
Hi Tyler, one of the authors of Sarama here; yes, your Kafka numbers look very low, probably in part because you are sending one-message-at-a-time and waiting for a response each time. The typical use case of Kafka is to batch many messages together and receive responses asynchronously, only blocking if an error occurs. I have submitted a PR to this effect.
Feel free to contact me if you have any questions.
Thanks, Evan. I will take a look at that this afternoon.
Glad to see you’ve updated the kafka throughput numbers, but also the latency numbers. This is basically a trade-off choice in kafka; if you asynchronously batch messages together then latency goes up a bit as the producer constructs batches over short intervals before sending each one. However, fewer round-trips means much better throughput. If you do synchronous sends however (or very small batches) then you lose a bit of throughput but improve latency because messages get send to the broker much sooner, using more round-trips.
What about Beanstalkd?
The initial numbers:
https://twitter.com/tyler_treat/status/487081673251516416
https://twitter.com/tyler_treat/status/487081779845533697
On a side note, I think beanstalk is more a work-distribution queue than a message queue. Some subtleties there.
Hi,
did you get these results by using persistence ? (-b option)
Some pages are claiming that beanstakld is faster. Not sure what is cause of this difference. http://adam.herokuapp.com/past/2010/4/24/beanstalk_a_simple_and_fast_queueing_backend/
Hi,
Great article. Do you have some specific reason to not include Apache QPID brokers (Java and C++) in the test?
Thanks.
No particular reason. It would be easy enough to implement benchmarks for them with the framework I’ve written.
Very interesting. Thanks for doing this.
As you said, it would be interesting to benchmark a scaled up topology with multiple producers and multiple consumers. Interesting metrics in the scaled up topology would be latency and throughput but combined with number of producers and consumers.
Yep, I’m hoping to do this at some point, possibly by spinning up Docker containers each running many clients. I’ll be sure to post results if I do.
There are two messaging platforms developed in Go very interesting:
== NSQ
http://nsq.io/
https://github.com/bitly/nsq
== Iris
http://iris.karalabe.com/
https://github.com/project-iris/iris
and kiteq an new message queue wirtten in Go
github.com/blackbeans/kiteq
Also interesting to read is the CERN middleware evaluation from 2011 at http://cds.cern.ch/record/1391410?ln=en , slightly older but still a good read and points to a few other options.
I appreciate that you’ve included qualitative aspects, and that you haven’t chosen a single winner.
For one thing, with a given architecture, it’s often easy to profile and optimize, and improve the performance without changing the architecture much.
My follow-up would be, then, to extend the qualitative section. You mention deployment and maintainability, but don’t seem to really address these. How many people are working on these? Are they well structured? Are they well documented?
These things affect how a program changes over time. Being 50% faster today doesn’t mean much to me if the code is an undocumented mess of spaghetti code with 10,000 lines of x86 assembly in the middle of it, and only one maintainer.
cheers!
Great post. Do you think that gnatsd is good for a similar use case as redis then? Redis is widely used (generally for its speed and simplicity) but gnats looks like an even faster alternative with a similar API. Would love to get input from anyone that has played around with them more.
So I’ve used both, Redis more so (beyond this brief survey) and it really depends on what your use case is (big surprise). NATS/gnatsd doesn’t do persistence, period—no disk, no in-memory caching. It’s completely ephemeral. Redis is more versatile, but I would be more inclined to use it for what it was designed as—a simple key-value store. I would tend to use NATS for cases where I need super fast messaging with no guaranteed delivery. They both support partitioning, but I haven’t had a chance to setup and try out a NATS cluster.
The advantage of using Redis is you get a lot more for “free”—caching, snapshot persistence, op logging/playback, transactions, etc. NATS is much more lightweight. It doesn’t do any of those things.
Just wanted to let you know that the graphs were all cut off on the iPhone. There seems to be some half responsive design going on that works great for the text but not the charts. I could only read the left half.
Thanks for sharing such great post. But I think the extreme high numbers of zeromq and nanomsg may not be correct.
I tried to benchmark these MQs on my MacBook Air, and got high numbers of c-based MQs as the post showed. Then I made a new bench case that using zeromq or nanomsg as a broker to transfer data from one client to another, but I happened to find received done before sent done. I guess it would be the ‘dont wait’ flag and then received nothing. So I changed the original benchmark code in this post (the code omits errs when receiving) to get recv errors and printed out. It was really the reason (the error is ‘resource temporarily unavailable’).
I added this code below to avoid the problem :
if err != nil {
continue
}
Then I got numbers of zeromq and nanomsg, which are just a little faster than gnatsd (I used a small message count because if the count is set to large the benchmark won’t stop of messages loss).
I’m not sure it is appropriate to draw this conclusion, but zeromq and nanomsg are too fast to believe.
I realized after looking at the benchmark code for gnatsd, that the reason for the “surprisingly low latencies and unexpected relationships with the number of messages” is because the code heavily throttles the message rate. For example, the code currently sleeps whenever gnatsd is 10 messages behind. This is apparent when you send 1M messages using the latency benchmark. It will take minutes to send the 1M.
In other MQ implementations with no artificial throttling, they buffer the messages as they come in, and thus the latency is much higher due to the buffering time. This means the average latency you have for gnatsd is really the average of 10 messages.
I suspect if you run your latency benchmark with only 10 messages, you will see the latency numbers to be much smaller for the other MQs as well. I also suspect that the line for gnatsd looks much more like NSQ if you increase the message rate.
Regardless, gnatsd definitely has very high throughput and it’s a great piece of software.
Yes, this is completely true. Frankly, the benchmarks in general aren’t representative of what you would see in any sort of production configuration (i.e. the producer and consumer are running in the same process). Also, latencies don’t follow a normal distribution, so the mean isn’t a terribly useful metric. These benchmarks aren’t really scientific. That said, I will accept pull requests.
Do you think the jumps in the Mean Latency vs Total messages for Brokerless Systems might have to do with L1, L2, L3 caches of your CPU?
Interesting and useful comparison. I was wondering what was the batching size which was used in your test. This usually makes a good difference and the latencies change a lot with this setting. Kafka for example has a default batch size of 100. Can you please shed some light on this and check if all the brokers / systems where transmitting messages of the same batch size?
I’d like to see comparison with Aeron (http://highscalability.com/blog/2014/11/17/aeron-do-we-really-need-another-messaging-system.html)
great post, would be interesting to compare with erlang based broker (apart from RabbitMQ) such as emqtt, especially on the latency.
Hi,
this is really an excellent benchmark that you put out there!
I just want to double-check whether I’m reading the charts correctly. The latency charts of, e.g., ZeroMQ indicate that at 500000 messages/second the mean latency reaches 40.000 ms. That’s a huge 40 seconds in a range that is well below the sending throughput and still somewhat below the receiving throughput from your first chart.
The other latency numbers appear equally high.
Can you comment on this?
The 40.000 ms isn’t a translation as 40 thousand ms or 40 seconds, but instead an even flat rate of 40 ms (40 0/1000 ms).
Oh, I see. The “.” is for decimals. It’s obvious now :/
Thanks for pointing it out.
Great conclusion for all the commonly used messaging Queue even I just have some Kafka experiences. Whereas it could really benefit them to have a whole picture and make the trade off during the design phase
Great conclusion for all the commonly used messaging Queue even I just have some Kafka experiences. Whereas it could really benefit us to have a whole picture and make the trade off during the design phase..
Not sure whether the last post is successful or not.
Versions are missing
I am going to go nuts if I can’t find an answer on Kafka in the context of Microservices. Is there any way I can contact you to discuss?
Hello Everyone.
We are looking at using an asynch msg queue. In short we have 1 mill+ mobile devices as txn sources on one side and 50+ txn processor-interfaces on the other. The routing is based on 4 data-values and some stored data. A crucial req is dialog life-cycle. For each msg from a mobile-device the response must be sent back (to the correct client device). Persistence / logging is must as well.
As I understand it the 50 processor-interfaces can each be a ‘topic’ so each gets its message (only) and process it. How do we ensure the response goes back to the right original-sender (finally to the mobile-device) – I guess each process-interface must ‘publish’ the response back so the original-sender can get it. Here should each sender-mobile-id be a ‘topic’as well (1 million+ topics and 1 mill+ processes running)? Or is it better to have one Java (thats our language) class name as the ‘topic’ and this class handles msgs ‘published-back’ (responds to the mobile-device) one after another. I guess this class can be multi-thread implemented. Is this issue similar to Node vs Apache Tomcat scenario.
Also (pls pardon my very very imited understanding of this), in this pubsub scenario do the receiver Java classes have to ‘poll’ msg queues or does the ESB/broker ‘call/invoke’ the receiver (and the receiver can do the needful)?
I had another question (apologies if this is the wrong forum/thread for it).
Our system implements business-logic as a series of configurable components (example emvCryptoVerifier, availableBalanceChecker etc). We pass app-data from component-to-component using “Data-Type, Length, Byte-Stream” tuples in a Java Hashtable (not XML or JSON). Each middleware component accepts and spit-outs this Hashtable and knows what ‘Data-Type/s’ it handles. Database-side edge-components do SQL and client-side edge-components do JSON also. Does it make sense to use JSON/XML for our inter-component messaging also (and add parsing overhead)?
Appreciate the help.
Alok Arora
Hi Alok:
I don’t agree that each topic for one device should work for your scenario, there are some reasons to support my idea, even I don’t know the type of Message queue you are using.
1. Retaining so many topics that definitely improve the brokers overhead cost, however a few messages are kept in each topic. Especially for the middleware like Kafka, its backend storage kept one single sequential file in separated file, reading so many small files could significantly reduce the throuphout of the whole cluster.
2. If each client keeps one keepalive connection dedicated to wait for feedback, it’s awkward to waste precious CPU via constant poll from broker to obtain some unpredicted messages. And meanwhile, keeping so many sockets could easily crash the servers.
3. Metadata exchange during the cluster is different, especially some node fails due to hardware issue, that needs a long time to rebalance the cluster and make them ready.
Why not do any minor updates to your original MessageBody, like adding some new fields to signify the sender device id? Once receiver finishes to handle this message, the same information must be attached back, that’s easy to keep them via your API if possible.
while the response is ready, one more isolated module like FeedService can be introduced to meet this.
Regarding another question, you know, JSON and XML have better interoperability across different platforms, that’s the exactly why they have become one standard fashion of data exchange, whereas HashTable is Java language-specific which can not be understood by other platforms. As the overhead of encoding/decoding, that should not be a problem.
On github your usage. Usage: go run main.go subject [test_latency] [num_messages] [message_size]
a) In the graphics/resultats I don’t see the parameter message_size. The size of each message in bytes is crucial in the throughput (bytes/per second). Are you sending a lot of small messages or big messages?
b) As Soyee writes it also makes a difference which format you use (json, xml, csv).
c) For ActiveMQ you used AMQP. ActiveMQ supports lots of other protocols/technologies like JMS and MQTT. Did you test as well? Are these results the same?
How did you measure latency? Why these numbers don’t fit into the formula occupancy(number of requests in pipe) = latency * throughput ? For example In NSQ case the max default number of messages in the buffer = 10000 (Lookup mem-queue-size in http://nsq.io/components/nsqd.html) and the throughput is 12512 so the latency = 10000/12512 = 0.799 seconds thats like 800ms but your graphs certainly doesn’t show that. Where am I doing wrong?
Check http://blog.digiqt.com/index.php/2017/04/23/how-you-scale-infrastructure-with-distributed-messaging/
Are these numbers for different messaging products still relevant?
7slots giriş twitter Büyük jackpot ödülleriyle şansınızı deneyin.
Abe Bet casino https://fourgreatinventions.com/ Ücretsiz deneme oyunları, yeni başlayanlar için casino dünyasıyla tanışmanın harika bir yoludur.