“Pets versus cattle” has become something of a standard vernacular for describing the shift in how we build systems. It alludes to the elastic and dynamic nature of these (typically, but not necessarily) container-based systems with on-demand scaling and more transparent fault-tolerance. I’ve talked before about this transition before and specifically how it relates to monitoring. In particular, with these more dynamic, microservice-based systems, the conversation starts to shift away from traditional monitoring toward observability. In this series, I’ll describe that distinction, explain why it matters, and share some concrete tactical items for implementing observability in a microservice environment.
In the past, I’ve used the term “cloud-native” to describe these types of systems, but this buzzword has conflated so many different concepts that it’s been relegated to the likes of “DevOps”—entirely arbitrary and context-dependent. Depending on who you ask, cloud-native means containers, microservices, Kubernetes, elasticity, serverless, automation, or any number of other ideas. The truth, however, is that you can do many of these things on-prem just as much as in the cloud, the difference being largely CapEx versus OpEx. I think the spirit of “cloud-native” really just means architecting systems to take advantage of cloud capabilities, namely higher-level managed services (which may not even have on-prem equivalents), improved elasticity and fault-tolerance (which may or may not mean containers), and reduced operations investment (in part by leveraging managed services).
Because there are so many confounding and interrelated-yet-different ideas, I’m going to focus this discussion on elastic microservice architectures. Elastic meaning services that automatically scale up and down as needed (in contrast to static infrastructures), and microservice simply meaning applications comprised of many different—usually smaller—services (in contrast to monoliths or systems comprising just a few coarse-grained services).
Static Monolithic Architectures
With static monolithic architectures, monitoring is a reasonably well-understood problem. With a monolith, the system is typically in one of two states, up or down, and we can conceivably correlate this to customer impact. Bugs aside, when the monolith is down, we likely have a good idea of how this behavior manifests itself to the user. We can set up Nagios checks and get some meaningful signals out of it. Uptime is mostly a single data point.
With a monolith, it’s not unreasonable for ops teams to manage the day-to-day operations of the system and do so effectively. These teams tend to quickly develop a good intuition and “muscle memory” for the application when it’s the only thing they are responsible for, especially when it’s a single deployable unit. Logs can be grepped from a single log file, and if something is wrong with the application, operators might simply SSH into the box to poke at it. Runbooks and standard operating procedures are also common here.
With a monolith, we likely have a single runtime such as the JVM, which makes it easier to collect rich telemetry in a centralized way, all the way down to the code level. Tools like Dynatrace and AppDynamics can instrument the JVM itself to collect information on busy and idle threads, garbage collection stats, and request metrics. And because we have just a single deployed artifact running on a handful of static servers, this data can actually be useful and correlated back to customer impact and business metrics.
Elastic Microservice Architectures
With elastic microservice architectures, things start to change dramatically. Applications consist of dozens of different microservices. The system is no longer in one of two states but more like one of n-factorial states. In reality, it’s much more because in production you might have different versions of the same service running at the same time as you introduce more sophisticated deployment strategies and rollbacks. Integration testing can’t possibly account for all of these combinations. We can no longer easily correlate system behavior to actual customer impact because system behavior is much more emergent. It can be difficult to pinpoint how the behavior of a given service affects the user’s experience as the system operates in varying states of partial failure and services interact in unique ways. If it’s slow, which part is slow? The frontend service? An upstream service? The database? Some combination of these? Uptime is no longer a single data point but rather a composite of many different data points, but more importantly, what does “up” even mean in the context of a complex microservice architecture?
With microservices, it becomes intractable for a single ops team to manage dozens of heterogeneous services beyond anything but in a first-responder, incident-router capacity. There is too much context and specific knowledge needed since microservices are literally the embodiment of the specialization of teams.
With microservices, it’s no longer practical or even feasible to grep log files or SSH into the box to debug a problem. There might not even be a box to SSH into if it’s a container that has since been descheduled or a managed serverless runtime. With heterogeneous services, we might have half a dozen languages and runtimes to support, each with differing types of runtime instrumentation. Moreover, because we now have dozens or even hundreds of nodes running many different instances of our services, the value of this low-level, summarized data starts to diminish. It makes for pretty dashboards and can help in answering very specific, predefined questions, but that’s about it. It’s no use for proactive monitoring because it’s too much noise, and it’s no use for reactive debugging because it’s pre-aggregated. There’s not much you can do when all you have are rolled-up time-series metrics, and it’s just as difficult to correlate this data back to customer impact.
Monitoring and Observability
With a complex system, relying on this type of data along with logs can often lead to a deadend when tracking down a particularly insidious bug. And this is where observability comes into play. It picks up where monitoring leaves off.
While monitoring and observability have been getting conflated a lot lately, there’s actually an important distinction to make. Monitoring tends to focus on the overall health of system and business metrics—questions we know in advance. Observability is about providing more granular insights into the behavior of systems and richer context. It’s the difference between “post hoc” versus “ad hoc.”
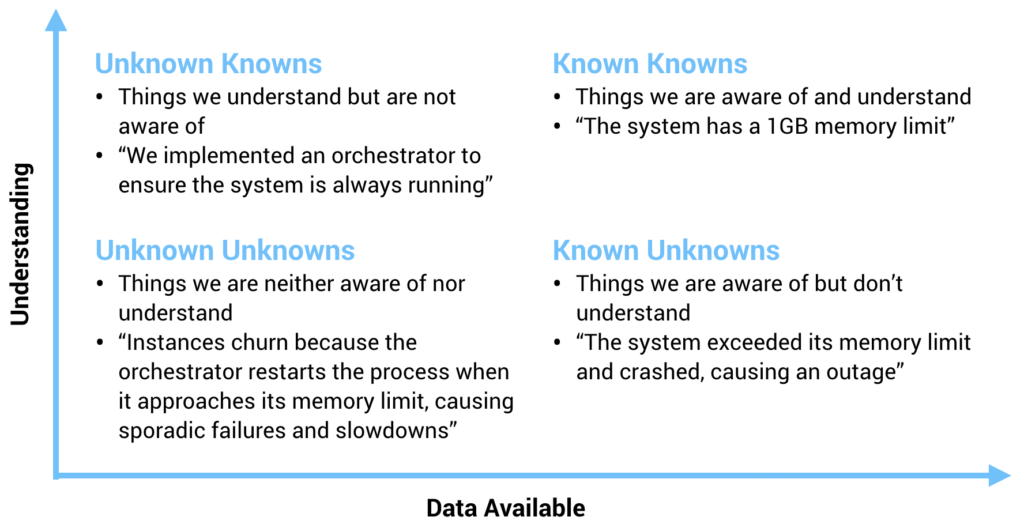
In the top-right corner, we have known knowns. These are things of which we have a high degree of understanding and a large amount of data on, i.e. the things we are aware of and understand. For example, “the system has a 1GB memory limit.” As the designers of this system, this is something that we’re acutely aware of and understand. We know that we know how much memory the system can use before it moves outside of its operating boundaries and bad things happen.
In the bottom-right corner, we have known unknowns. These are things we are generally aware of but don’t necessarily understand. For example, “the system exceeded its memory limit and crashed, causing an outage.” As system designers, memory usage is something we know is important and affects system behavior. We can monitor it in production in order to gather lots of data on it, but just having that data often doesn’t help us to understand why memory is being consumed or even how that data manifests itself as system behavior.
In the top-left corner, we have unknown knowns, which are things we understand but are not completely aware of. This sounds like a strange, almost oxymoron-like categorization, but it’s basically the things that are gut instinct or intuition. It’s often things we know or think we know without even consciously realizing it. For example, “we implemented an orchestrator to ensure the system is always running.” Intuition tells us that if the process isn’t running, the system isn’t available, so we make sure that it gets restarted when something goes wrong. We might, however, be unaware of the unintended side effects of this decision, and it might be based more on theory and conjecture than data.
Which leads us to the bottom-left corner: unknown unknowns. These are the things we are neither aware of nor understand. The events we can’t even predict or foresee happening because if we could foresee them, they wouldn’t be unknown unknowns, they’d be known unknowns. For example, “instances churn because the orchestrator restarts the process when it approaches its memory limit, causing sporadic failures and slowdowns.” This was an unforeseen consequence of our orchestrator implementation. As a result, we could not have tested for it or looked for it with our monitoring tools. Instead, it’s something that happens, we learn from it, and quickly classify it as a known unknown—something we know to look for going forward.
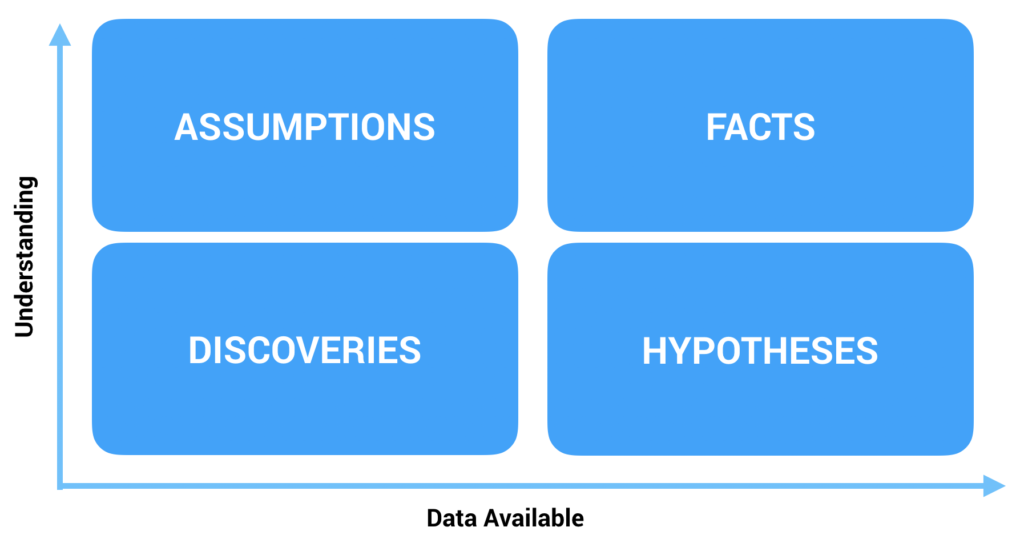
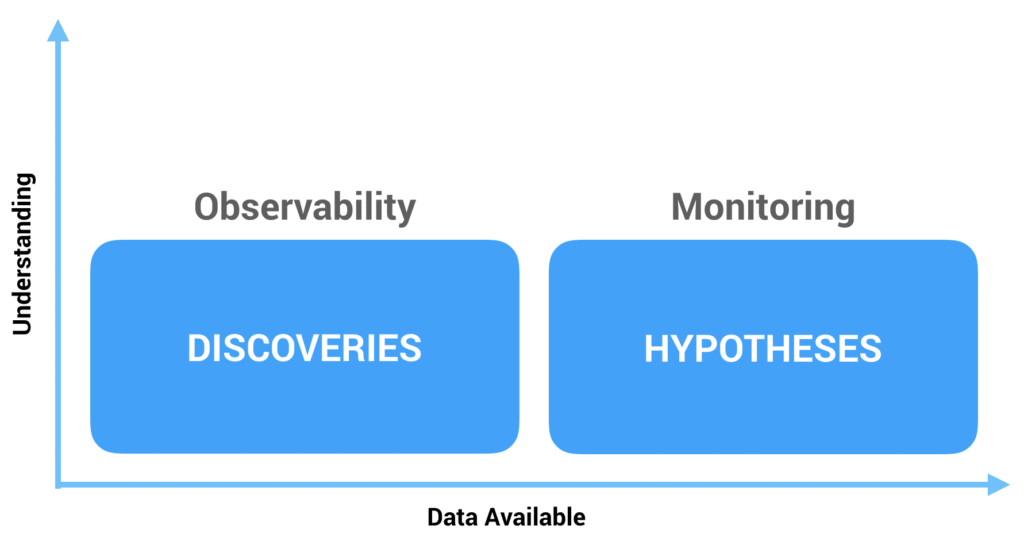
In a sense, the known knowns are facts, the known unknowns are hypotheses, the unknown knowns are assumptions, and the unknown unknowns are discoveries. Through this lens, the distinction between observability and monitoring becomes clear. Monitoring is about testing hypotheses and observability is about exploring new discoveries. We monitor known unknowns because these are the things we know to look for, but unknown unknowns are, by definition, unpredictable. We cannot monitor them because we do not know to even look for them in the first place! Instead, we ask questions of our systems in order to understand and categorize these unknown unknowns. Observability is the ability to interrogate our systems after the fact in a data-rich, high-fidelity way. Monitoring, on the other hand, is before the fact and much lower fidelity. These are the dashboards and alerts we set up which usually consist of pre-aggregated metrics. This is what I mean by post hoc versus ad hoc. Observability allows us to ask arbitrary questions of our systems, not questions predefined in advance.
With this definition, monitoring is a subset of observability, and observability encompasses many different types of data. For example, things like distributed traces, application logs, system logs, audit logs, and application metrics are all important observability signals. But when we boil it all down, it turns out everything is really just events, of which we want different lenses to view. Some of this data provides context for the event itself, such as logs and metrics, and some of it describes relationships between events, such as traces. It’s important we have a way to collect all this context and store it such that we can query and analyze it using these different lenses. Aggregated metrics alone aren’t enough—they don’t have the granularity nor the context needed. Dashboards are simply answers to specific questions known in advance. Observability needs to go much deeper than this.
In part two of this series, we’ll revisit the concept of an observability pipeline as a tactical approach to implementing observability in a microservice environment. As part of this, we’ll discuss some steps that can be taken to incrementally improve observability while iterating toward this pattern.
Comments
Comments are from this blog's WordPress era and are preserved read-only.
When is Part 2 coming?
Hopefully in the next month or so, stay tuned.
Good
Fantastic read, thanks! I appreciated the breakdown of “up/down” and the distinction between observability and monitoring.
This was an exceptional article on the topic and really helped me visualize the difference between observability and monitoring. I’m anxious to digest part two! Thanks!