Fast Topic Matching

A common problem in messaging middleware is that of efficiently matching message topics with interested subscribers. For example, assume we have a set of subscribers, numbered 1 to 3:

Subscriber Match Request
1 forex.usd
2 forex.*
3 stock.nasdaq.msft

And we have a stream of messages, numbered 1 to N:

Message Topic
1 forex.gbp
2 stock.nyse.ibm
3 stock.nyse.ge
4 forex.eur
5 forex.usd
N stock.nasdaq.msft

We are then tasked with routing messages whose topics match the respective subscriber requests, where a “*” wildcard matches any word. This is frequently a bottleneck for message-oriented middleware like ZeroMQ, RabbitMQ, ActiveMQ, TIBCO EMS, et al. Because of this, there are a number of well-known solutions to the problem. In this post, I’ll describe some of these solutions, as well as a novel one, and attempt to quantify them through benchmarking. As usual, the code is available on GitHub.

The Naive Solution

The naive solution is pretty simple: use a hashmap that maps topics to subscribers. Subscribing involves adding a new entry to the map (or appending to a list if it already exists). Matching a message to subscribers involves scanning through every entry in the map, checking if the match request matches the message topic, and returning the subscribers for those that do.

Inserts are approximately O(1) and lookups approximately O(n*m) where n is the number of subscriptions and m is the number of words in a topic. This means the performance of this solution is heavily dependent upon how many subscriptions exist in the map and also the access patterns (rate of reads vs. writes). Since most use cases are heavily biased towards searches rather than updates, the naive solution—unsurprisingly—is not a great option.
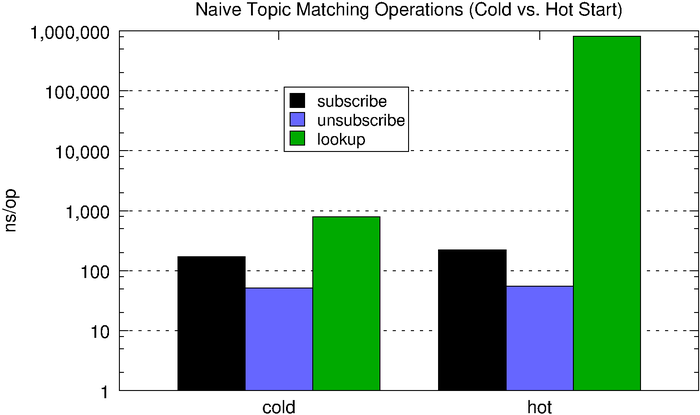
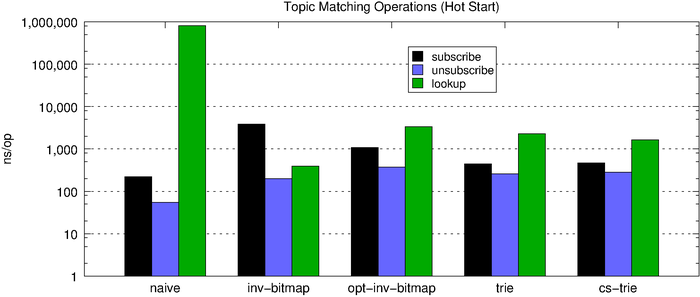
The microbenchmark below compares the performance of subscribe, unsubscribe, and lookup (matching) operations, first using an empty hashmap (what we call cold) and then with one containing 1,000 randomly generated 5-word topic subscriptions (what we call hot). With the populated subscription map, lookups are about three orders of magnitude slower, which is why we have to use a log scale in the chart below.

subscribe unsubscribe lookup
cold 172ns 51.2ns 787ns
hot 221ns 55ns 815,787ns


Inverted Bitmap

The inverted bitmap technique builds on the observation that lookups are more frequent than updates and assumes that the search space is finite. Consequently, it shifts some of the cost from the read path to the write path. It works by storing a set of bitmaps, one per topic, or criteria, in the search space. Subscriptions are then assigned an increasing number starting at 0. We analyze each subscription to determine the matching criteria and set the corresponding bits in the criteria bitmaps to 1. For example, assume our search space consists of the following set of topics:

  • forex.usd
  • forex.gbp
  • forex.jpy
  • forex.eur
  • stock.nasdaq
  • stock.nyse

We then have the following subscriptions:

  • 0 = forex.* (matches forex.usd, forex.gbp, forex.jpy, and forex.eur)
  • 1 = stock.nyse (matches stock.nyse)
  • 2 = *.* (matches everything)
  • 3 = stock.* (matches stock.nasdaq and stock.nyse)

When we index the subscriptions above, we get the following set of bitmaps:

 Criteria 0 1 2 3
forex.usd 1 0 1 0
forex.gbp 1 0 1 0
forex.jpy 1 0 1 0
forex.eur 1 0 1 0
stock.nasdaq 0 0 1 1
stock.nyse 0 1 1 1

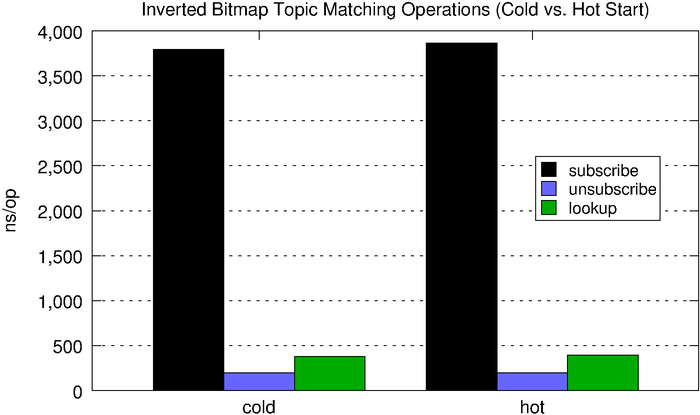
When we match a message, we simply need to lookup the corresponding bitmap and check the set bits. As we see below, subscribe and unsubscribe are quite expensive with respect to the naive solution, but lookups now fall well below half a microsecond, which is pretty good (the fact that the chart below doesn’t use a log scale like the one above should be an indictment of the naive hashmap-based solution).

subscribe unsubscribe lookup
cold 3,795ns 198ns 380ns
hot 3,863ns 198ns 395ns

The inverted bitmap is a better option than the hashmap when we have a read-heavy workload. One limitation is it requires us to know the search space ahead of time or otherwise requires reindexing which, frankly, is prohibitively expensive.

Optimized Inverted Bitmap

The inverted bitmap technique works well enough, but only if the topic space is fairly static. It also falls over pretty quickly when the topic space and number of subscriptions are large, say, millions of topics and thousands of subscribers. The main benefit of topic-based routing is it allows for faster matching algorithms in contrast to content-based routing, which can be exponentially slower. The truth is, to be useful, your topics probably consist of stock.nyse.ibm, stock.nyse.ge, stock.nasdaq.msft, stock.nasdaq.aapl, etc., not stock.nyse and stock.nasdaq. We could end up with an explosion of topics and, even with efficient bitmaps, the memory consumption tends to be too high despite the fact that most of the bitmaps are quite sparse.

Fortunately, we can reduce the amount of memory we consume using a fairly straightforward optimization. Rather than requiring the entire search space a priori, we simply require the max topic size, in terms of words, e.g. stock.nyse.ibm has a size of 3. We can handle topics of the max size or less, e.g. stock.nyse.bac, stock.nasdaq.txn, forex.usd, index, etc. If we see a message with more words than the max, we can safely assume there are no matching subscriptions.

The optimized inverted bitmap works by splitting topics into their constituent parts. Each constituent position has a set of bitmaps, and we use a technique similar to the one described above on each part. We end up with a bitmap for each constituent which we perform a logical AND on to give a resulting bitmap. Each 1 in the resulting bitmap corresponds to a subscription. This means if the max topic size is n, we only AND at most n bitmaps. Furthermore, if we come across any empty bitmaps, we can stop early since we know there are no matching subscribers.

Let’s say our max topic size is 2 and we have the following subscriptions:

  • 0 = forex.*
  • 1 = stock.nyse
  • 2 = index
  • 3 = stock.*

The inverted bitmap for the first constituent looks like the following:

forex.* stock.nyse index stock.*
null 0 0 0 0
forex 1 0 0 0
stock 0 1 0 1
index 0 0 1 0
other 0 0 0 0

And the second constituent bitmap:

forex.* stock.nyse index stock.*
null 0 0 1 0
nyse 0 1 0 0
other 1 0 0 1

The “null” and “other” rows are worth pointing out. “Null” simply means the topic has no corresponding constituent.  For example, “index” has no second constituent, so “null” is marked. “Other” allows us to limit the number of rows needed such that we only need the ones that appear in subscriptions.  For example, if messages are published on forex.eur, forex.usd, and forex.gbp but I merely subscribe to forex.*, there’s no need to index eur, usd, or gbp. Instead, we just mark the “other” row which will match all of them.

Let’s look at an example using the above bitmaps. Imagine we want to route a message published on forex.eur. We split the topic into its constituents: “forex” and “eur.” We get the row corresponding to “forex” from the first constituent bitmap, the one corresponding to “eur” from the second (other), and then AND the rows.

forex.* stock.nyse index stock.*
1 = forex 1 0 0 0
2 = other 1 0 0 1
AND 1 0 0 0

The forex.* subscription matches.

Let’s try one more example: a message published on stock.nyse.

forex.* stock.nyse index stock.*
1 = stock 0 1 0 1
2 = nyse 0 1 0 1
AND 0 1 0 1

In this case, we also need to OR the “other” row for the second constituent. This gives us a match for stock.nyse and stock.*.

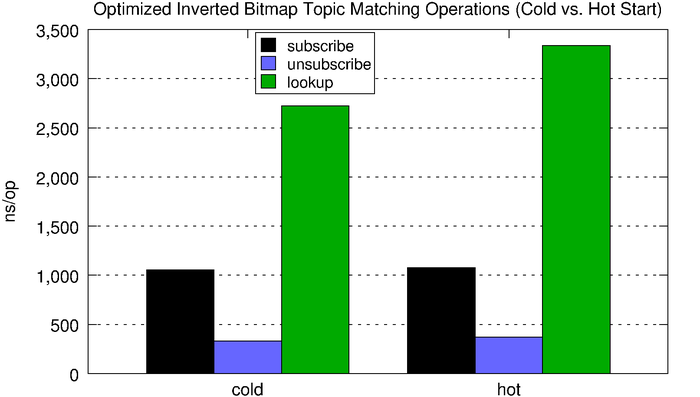
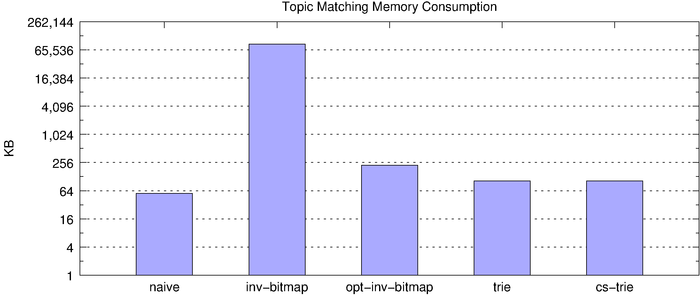
Subscribe operations are significantly faster with the space-optimized inverted bitmap compared to the normal inverted bitmap, but lookups are much slower. However, the optimized version consumes roughly 4.5x less memory for every subscription. The increased flexibility and improved scalability makes the optimized version a better choice for all but the very latency-sensitive use cases.

subscribe unsubscribe lookup
cold 1,053ns 330ns 2,724ns
hot 1,076ns 371ns 3,337ns

Trie

The optimized inverted bitmap improves space complexity, but it does so at the cost of lookup efficiency. Is there a way we can reconcile both time and space complexity? While inverted bitmaps allow for efficient lookups, they are quite wasteful for sparse sets, even when using highly compressed bitmaps like Roaring bitmaps.

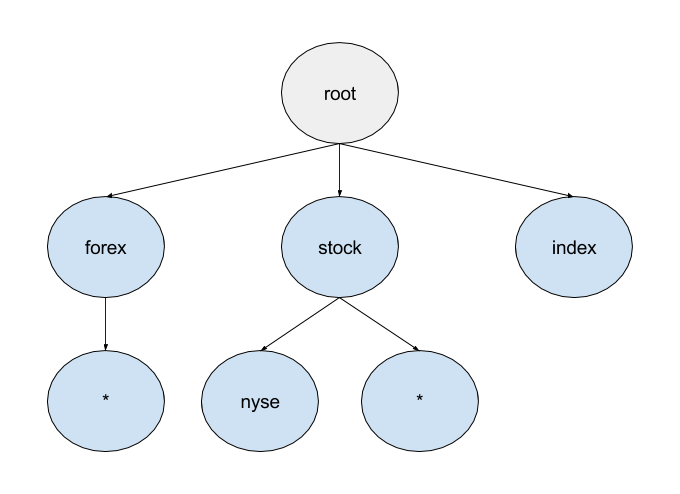
Tries can often be more space efficient in these circumstances. When we add a subscription, we descend the trie, adding nodes along the way as necessary, until we run out of words in the topic. Finally, we add some metadata containing the subscription information to the last node in the chain. To match a message topic, we perform a similar traversal. If a node doesn’t exist in the chain, we know there are no subscribers. One downside of this method is, in order to support wildcards, we must backtrack on a literal match and check the “*” branch as well.

For the given set of subscriptions, the trie would look something like the following:

  • forex.*
  • stock.nyse
  • index
  • stock.*

You might be tempted to ask: “why do we even need the “*” nodes? When someone subscribes to stock.*, just follow all branches after “stock” and add the subscriber.” This would indeed move the backtracking cost from the read path to the write path, but—like the first inverted bitmap we looked at—it only works if the search space is known ahead of time. It would also largely negate the memory-usage benefits we’re looking for since it would require pre-indexing all topics while requiring a finite search space.

It turns out, this trie technique is how systems like ZeroMQ and RabbitMQ implement their topic matching due to its balance between space and time complexity and overall performance predictability.

subscribe unsubscribe lookup
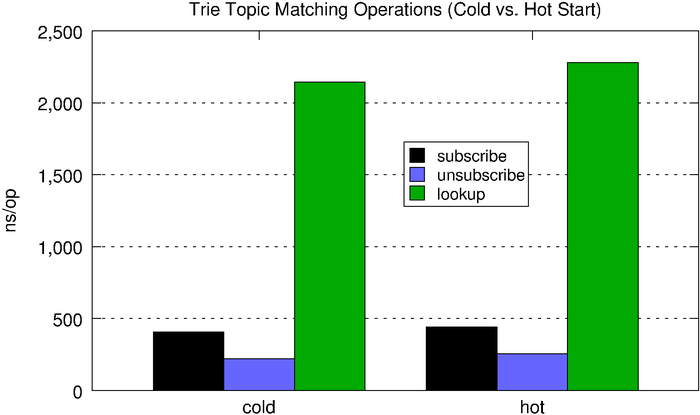
cold 406ns 221ns 2,145ns
hot 443ns 257ns 2,278ns

We can see that, compared to the optimized inverted bitmap, the trie performs much more predictably with relation to the number of subscriptions held.

Concurrent Subscription Trie

One thing we haven’t paid much attention to so far is concurrency. Indeed, message-oriented middleware is typically highly concurrent since they have to deal with heavy IO (reading messages from the wire, writing messages to the wire, reading messages from disk, writing messages to disk, etc.) and CPU operations (like topic matching and routing). Subscribe, unsubscribe, and lookups are usually all happening in different threads of execution. This is especially important when we want to talk advantage of multi-core processors.

It wasn’t shown, but all of the preceding algorithms used global locks to ensure thread safety between read and write operations, making the data structures safe for concurrent use. However, the microbenchmarks don’t really show the impact of this, which we will see momentarily.

Lock-freedom, which I’ve written about, allows us to increase throughput at the expense of increased tail latency.

Lock-free concurrency means that while a particular thread of execution may be blocked, all CPUs are able to continue processing other work. For example, imagine a program that protects access to some resource using a mutex. If a thread acquires this mutex and is subsequently preempted, no other thread can proceed until this thread is rescheduled by the OS. If the scheduler is adversarial, it may never resume execution of the thread, and the program would be effectively deadlocked. A key point, however, is that the mere lack of a lock does not guarantee a program is lock-free. In this context, “lock” really refers to deadlock, livelock, or the misdeeds of a malevolent scheduler.

The concurrent subscription trie, or CS-trie,  is a new take on the trie-based solution described earlier. It combines the idea of the topic-matching trie with that of a Ctrie, or concurrent trie, which is a non-blocking concurrent hash trie.

The fundamental problem with the trie, as it relates to concurrency, is it requires a global lock, which severely limits throughput. To address this, the CS-trie uses indirection nodes, or I-nodes, which remain present in the trie even as the nodes above and below change. Subscriptions are then added or removed by creating a copy of the respective node, and performing a CAS on its parent I-node. This allows us to add, remove, and lookup subscriptions concurrently and in a lock-free, linearizable manner.

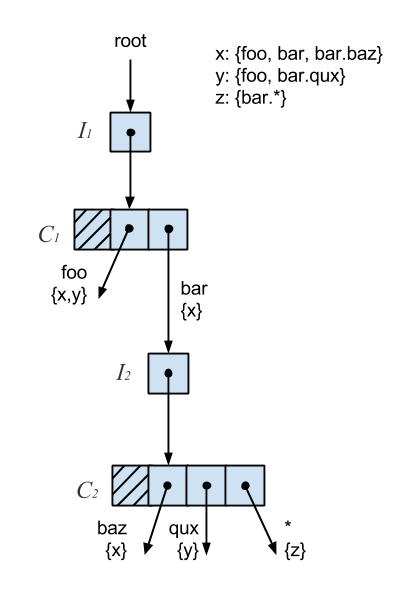
For the given set of subscribers, labeled x, y, and z, the CS-trie would look something like the following:

  • x = foo, bar, bar.baz
  • y = foo, bar.qux
  • z = bar.*

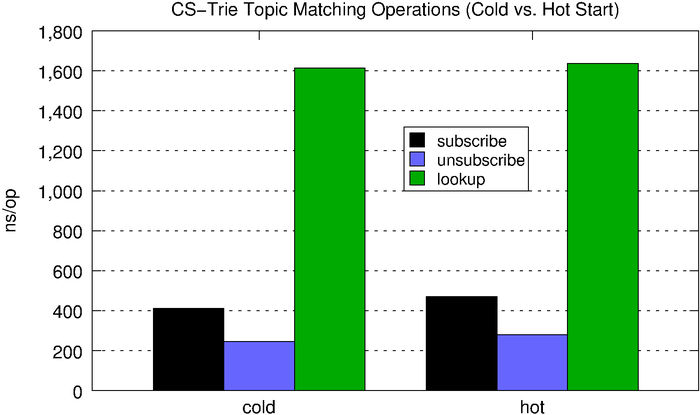
Lookups on the CS-trie perform, on average, better than the standard trie, and the CS-trie scales better with respect to concurrent operations.

subscribe unsubscribe lookup
cold 412ns 245ns 1,615ns
hot 471ns 280ns 1,637ns

Latency Comparison

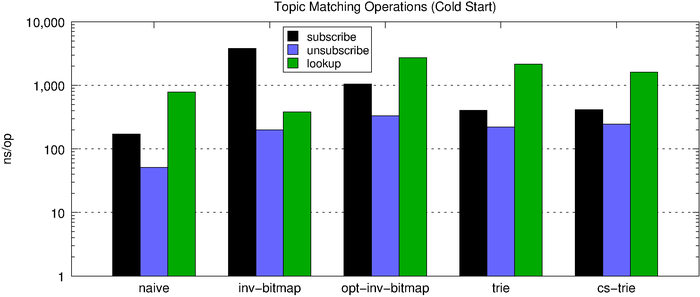
The chart below shows the topic-matching operation latencies for all of the algorithms side-by-side. First, we look at the performance of a cold start (no subscriptions) and then the performance of a hot start (1,000 subscriptions).

Throughput Comparison

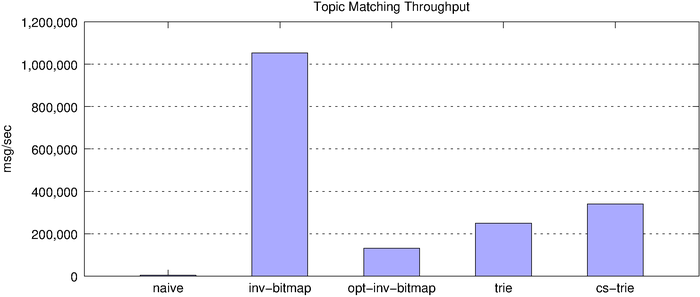
So far, we’ve looked at the latency of individual topic-matching operations. Next, we look at overall throughput of each of the algorithms and their memory footprint.

 algorithm msg/sec
naive  4,053.48
inverted bitmap  1,052,315.02
optimized inverted bitmap  130,705.98
trie  248,762.10
cs-trie  340,910.64

On the surface, the inverted bitmap looks like the clear winner, clocking in at over 1 million matches per second. However, we know the inverted bitmap does not scale and, indeed, this becomes clear when we look at memory consumption, underscored by the fact that the below chart uses a log scale.

Scalability with Respect to Concurrency

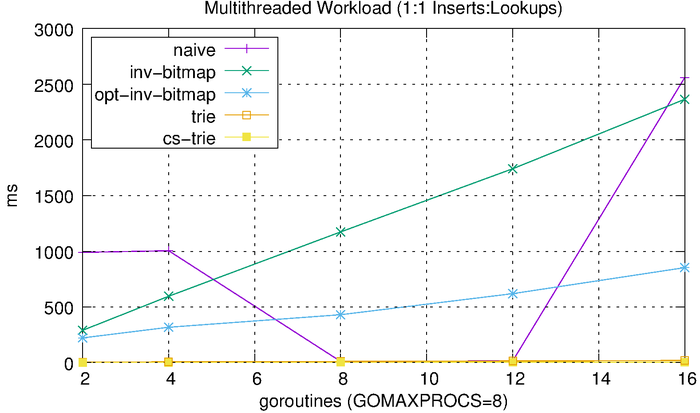
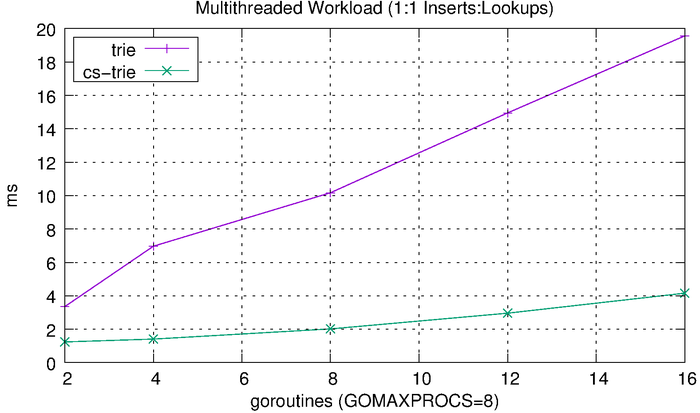
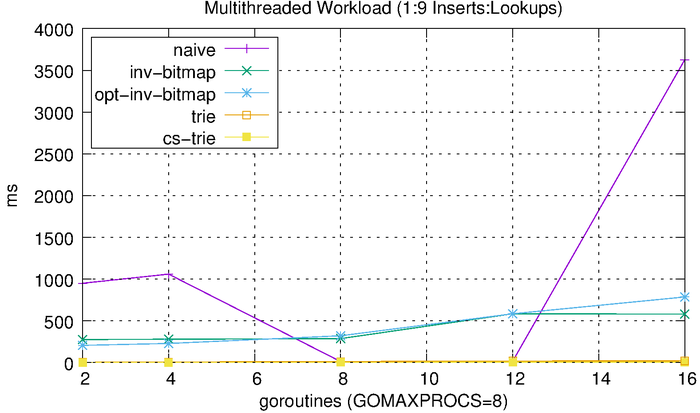
Lastly, we’ll look at how each of these algorithms scales with respect to concurrency. We do this by performing concurrent operations and varying the level of concurrency and number of operations. We start with a 50-50 split between reads and writes. We vary the number of goroutines from 2 to 16 (the benchmark was run using a 2.6 GHz Intel Core i7 processor with 8 logical cores). Each goroutine performs 1,000 reads or 1,000 writes. For example, the 2-goroutine benchmark performs 1,000 reads and 1,000 writes, the 4-goroutine benchmark performs 2,000 reads and 2,000 writes, etc. We then measure the total amount of time needed to complete the workload.

We can see that the tries hardly even register on the scale above, so we’ll plot them separately.

The tries are clearly much more efficient than the other solutions, but the CS-trie in particular scales well to the increased workload and concurrency.

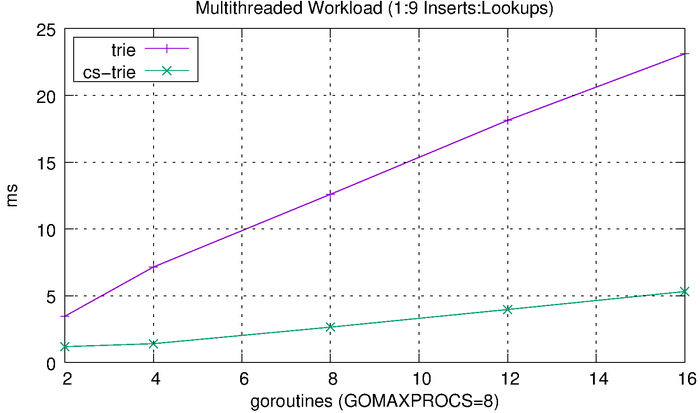
Since most workloads are heavily biased towards reads over writes, we’ll run a separate benchmark that uses a 90-10 split reads and writes. This should hopefully provide a more realistic result.

The results look, more or less, like what we would expect, with the reduced writes improving the inverted bitmap performance. The CS-trie still scales quite well in comparison to the global-lock trie.

Conclusion

As we’ve seen, there are several approaches to consider to implement fast topic matching. There are also several aspects to look at: read/write access patterns, time complexity, space complexity, throughput, and latency.

The naive hashmap solution is generally a poor choice due to its prohibitively expensive lookup time. Inverted bitmaps offer a better solution. The standard implementation is reasonable if the search space is finite, small, and known a priori, especially if read latency is critical. The space-optimized version is a better choice for scalability, offering a good balance between read and write performance while keeping a small memory footprint. The trie is an even better choice, providing lower latency than the optimized inverted bitmap and consuming less memory. It’s particularly good if the subscription tree is sparse and topics are not known a priori. Lastly, the concurrent subscription trie is the best option if there is high concurrency and throughput matters. It offers similar performance to the trie but scales better. The only downside is an increase in implementation complexity.

Benchmarking Commit Logs

In this article, we look at Apache Kafka and NATS Streaming, two messaging systems based on the idea of a commit log. We’ll compare some of the features of both but spend less time talking about Kafka since by now it’s quite well known. Similar to previous studies, we’ll attempt to quantify their general performance characteristics through careful benchmarking.

The purpose of this benchmark is to test drive the newly released NATS Streaming system, which was made generally available just in the last few months. NATS Streaming doesn’t yet support clustering, so we try to put its performance into context by looking at a similar configuration of Kafka.

Unlike conventional message queues, commit logs are an append-only data structure. This results in several nice properties like total ordering of messages, at-least-once delivery, and message-replay semantics. Jay Kreps’ blog post The Log is a great introduction to the concept and particularly why it’s so useful in the context of distributed systems and stream processing (his book I Heart Logs is an extended version of the blog post and is a quick read).
Kafka, which originated at LinkedIn, is by far the most popular and most mature implementation of the commit log (AWS offers their own flavor of it called Kinesis, and imitation is the sincerest form of flattery). It’s billed as a “distributed streaming platform for building real-time data pipelines and streaming apps.” The much newer NATS Streaming is actually a data-streaming layer built on top of Apcera’s high-performance publish-subscribe system NATS. It’s billed as “real-time streaming for Big Data, IoT, Mobile, and Cloud Native Applications.” Both have some similarities as well as some key differences.
Fundamental to the notion of a log is a way to globally order events. Neither NATS Streaming nor Kafka are actually a single log but many logs, each totally ordered using a sequence number or offset, respectively.

In Kafka, topics are partitioned into multiple logs which are then replicated across a number of servers for fault tolerance, making it a distributed commit log. Each partition has a server that acts as the leader. Cluster membership and leader election is managed by ZooKeeper.

NATS Streaming’s topics are called “channels” which are globally ordered. Unlike Kafka, NATS Streaming does not support replication or partitioning of channels, though my understanding is clustering support is slated for Q1 2017. Its message store is pluggable, so it can provide durability using a file-backed implementation, like Kafka, or simply an in-memory store.

NATS Streaming is closer to a hybrid of traditional message queues and the commit log. Like Kafka, it allows replaying the log from a specific offset, the beginning of time, or the newest offset, but it also exposes an API for reading from the log at a specific physical time offset, e.g. all messages from the last 30 seconds. Kafka, on the other hand, only has a notion of logical offsets (correction: Kafka added support for offset lookup by timestamp in 0.10.1.0) . Generally, relying on physical time is an anti-pattern in distributed systems due to clock drift and the fact that clocks are not always monotonic. For example, imagine a situation where a NATS Streaming server is restarted and the clock is changed. Messages are still ordered by their sequence numbers but their timestamps might not reflect that. Developers would need to be aware of this while implementing their business logic.

With Kafka, it’s strictly on consumers to track their offset into the log (or the high-level consumer which stores offsets in ZooKeeper (correction: Kafka itself can now store offsets which is used by the new Consumer API, meaning clients do not have to manage offsets directly or rely on ZooKeeper)). NATS Streaming allows clients to either track their sequence number or use a durable subscription, which causes the server to track the last acknowledged message for a client. If the client restarts, the server will resume delivery starting at the earliest unacknowledged message. This is closer to what you would expect from a traditional message-oriented middleware like RabbitMQ.

Lastly, NATS Streaming supports publisher and subscriber rate limiting. This works by configuring the maximum number of in-flight (unacknowledged) messages either from the publisher to the server or from the server to the subscriber. Starting in version 0.9, Kafka supports a similar rate limiting feature that allows producer and consumer byte-rate thresholds to be defined for groups of clients with its Quotas protocol.

Kafka was designed to avoid tracking any client state on the server for performance and scalability reasons. Throughput and storage capacity scale linearly with the number of nodes. NATS Streaming provides some additional features over Kafka at the cost of some added state on the server. Since clustering isn’t supported, there isn’t really any scale or HA story yet, so it’s unclear how that will play out. That said, once replication is supported, there’s a lot of work going into verifying its correctness (which is a major advantage Kafka has).

Benchmarks

Since NATS Streaming does not support replication at this time (0.3.1), we’ll compare running a single instance of it with file-backed persistence to running a single instance of Kafka (0.10.1.0). We’ll look at both latency and throughput running on commodity hardware (m4.xlarge EC2 instances) with load generation and consumption each running on separate instances. In all of these benchmarks, the systems under test have not been tuned at all and are essentially in their “off-the-shelf” configurations.

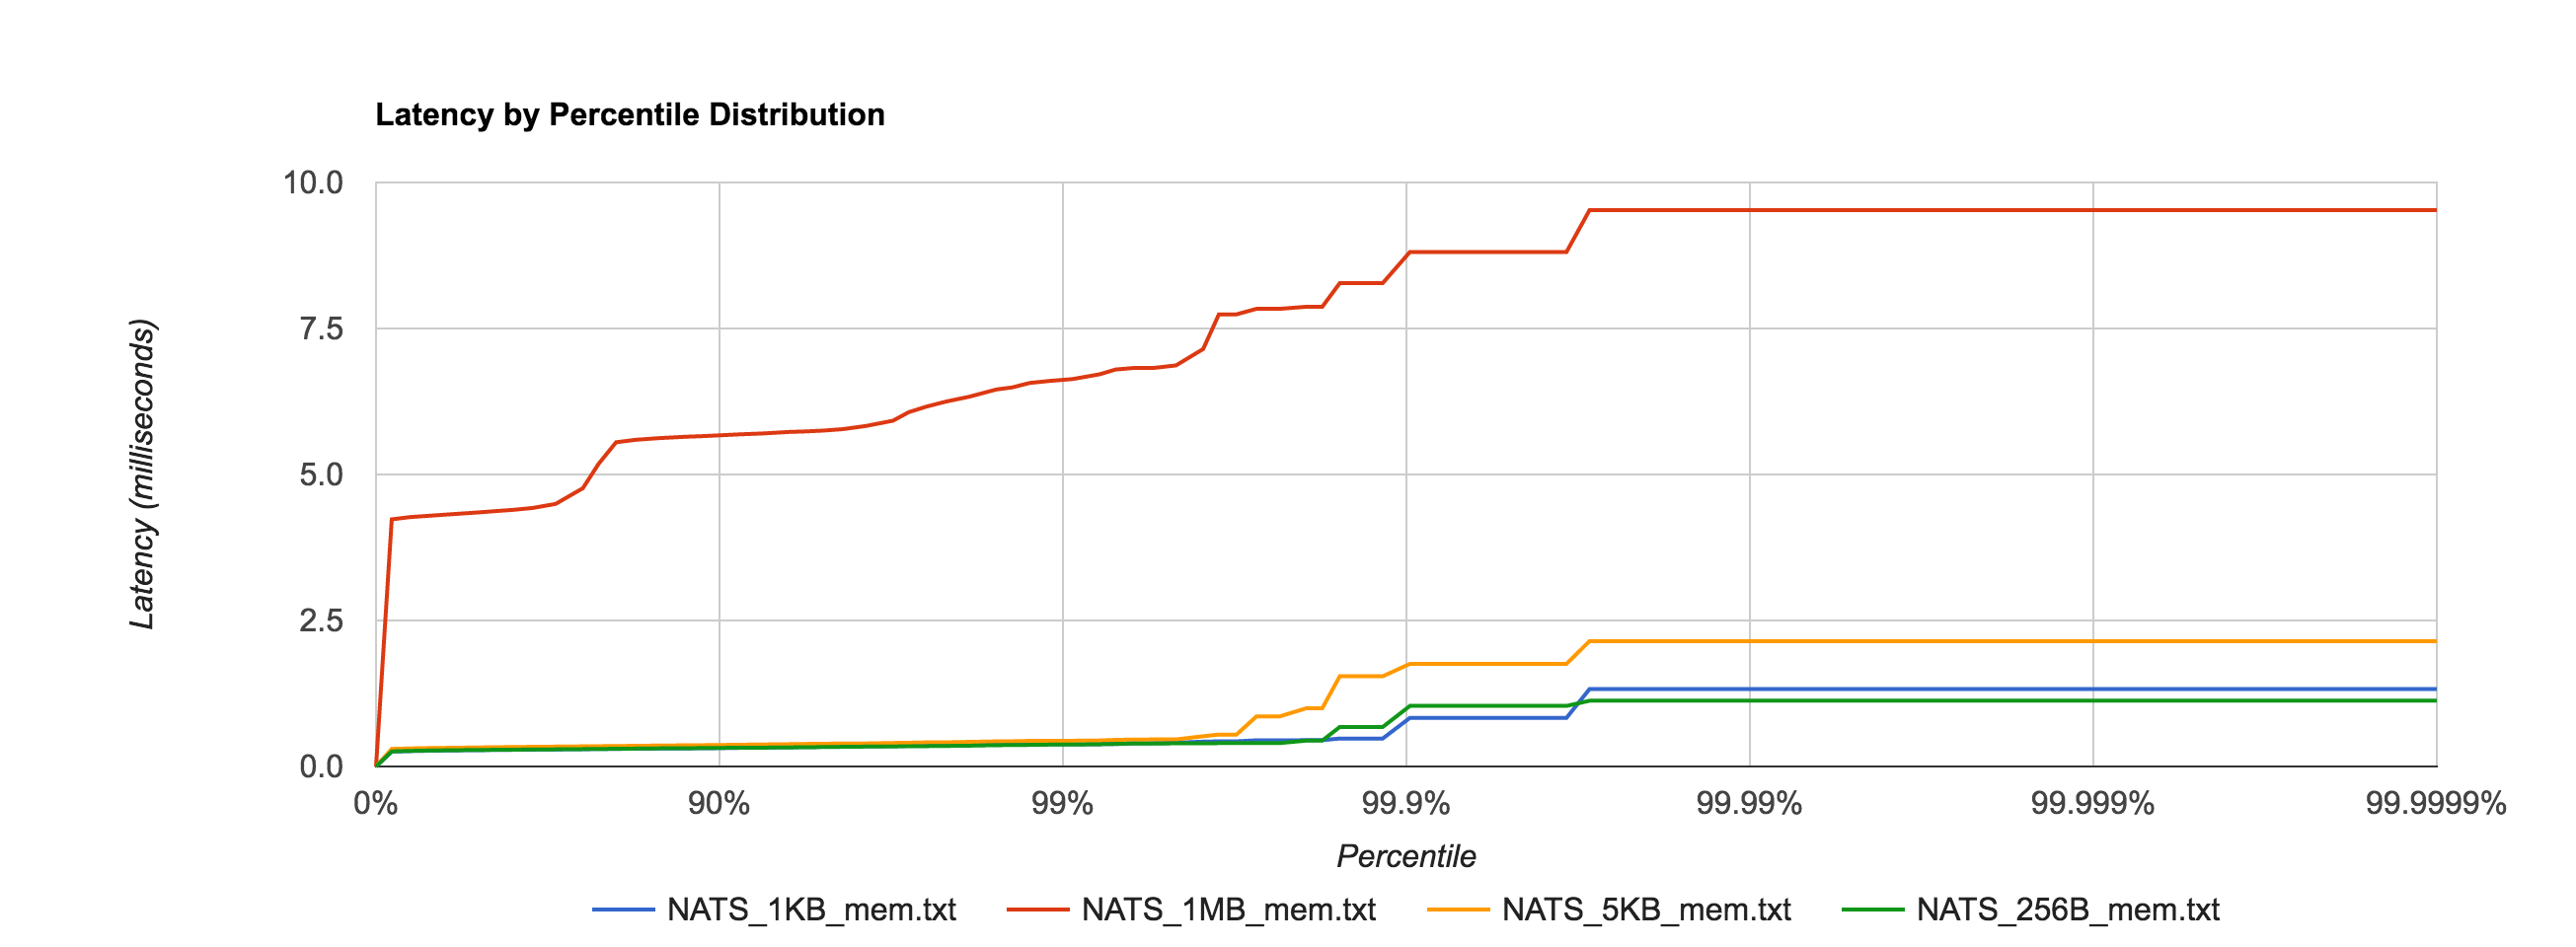
We’ll first look at latency by publishing messages of various sizes, ranging from 256 bytes to 1MB, at a fixed rate of 50 messages/second for 30 seconds. Message contents are randomized to account for compression. We then plot the latency distribution by percentile on a logarithmic scale from the 0th percentile to the 99.9999th percentile. Benchmarks are run several times in an attempt to produce a “normalized” result. The benchmark code used is open source.

First, to establish a baseline and later get a feel for the overhead added by the file system, we’ll benchmark NATS Streaming with in-memory storage, meaning messages are not written to disk.

Unsurprisingly, the 1MB configuration has much higher latencies than the other configurations, but everything falls within single-digit-millisecond latencies.nats_mem

NATS Streaming 0.3.1 (in-memory persistence)

 Size 99% 99.9% 99.99% 99.999% 99.9999% 
256B 0.3750ms 1.0367ms 1.1257ms 1.1257ms 1.1257ms
1KB 0.38064ms 0.8321ms 1.3260ms 1.3260ms 1.3260ms
5KB 0.4408ms 1.7569ms 2.1465ms 2.1465ms 2.1465ms
1MB 6.6337ms 8.8097ms 9.5263ms 9.5263ms 9.5263ms

Next, we look at NATS Streaming with file-backed persistence. This provides the same durability guarantees as Kafka running with a replication factor of 1. By default, Kafka stores logs under /tmp. Many Unix distributions mount /tmp to tmpfs which appears as a mounted file system but is actually stored in volatile memory. To account for this and provide as level a playing field as possible, we configure NATS Streaming to also store its logs in /tmp.

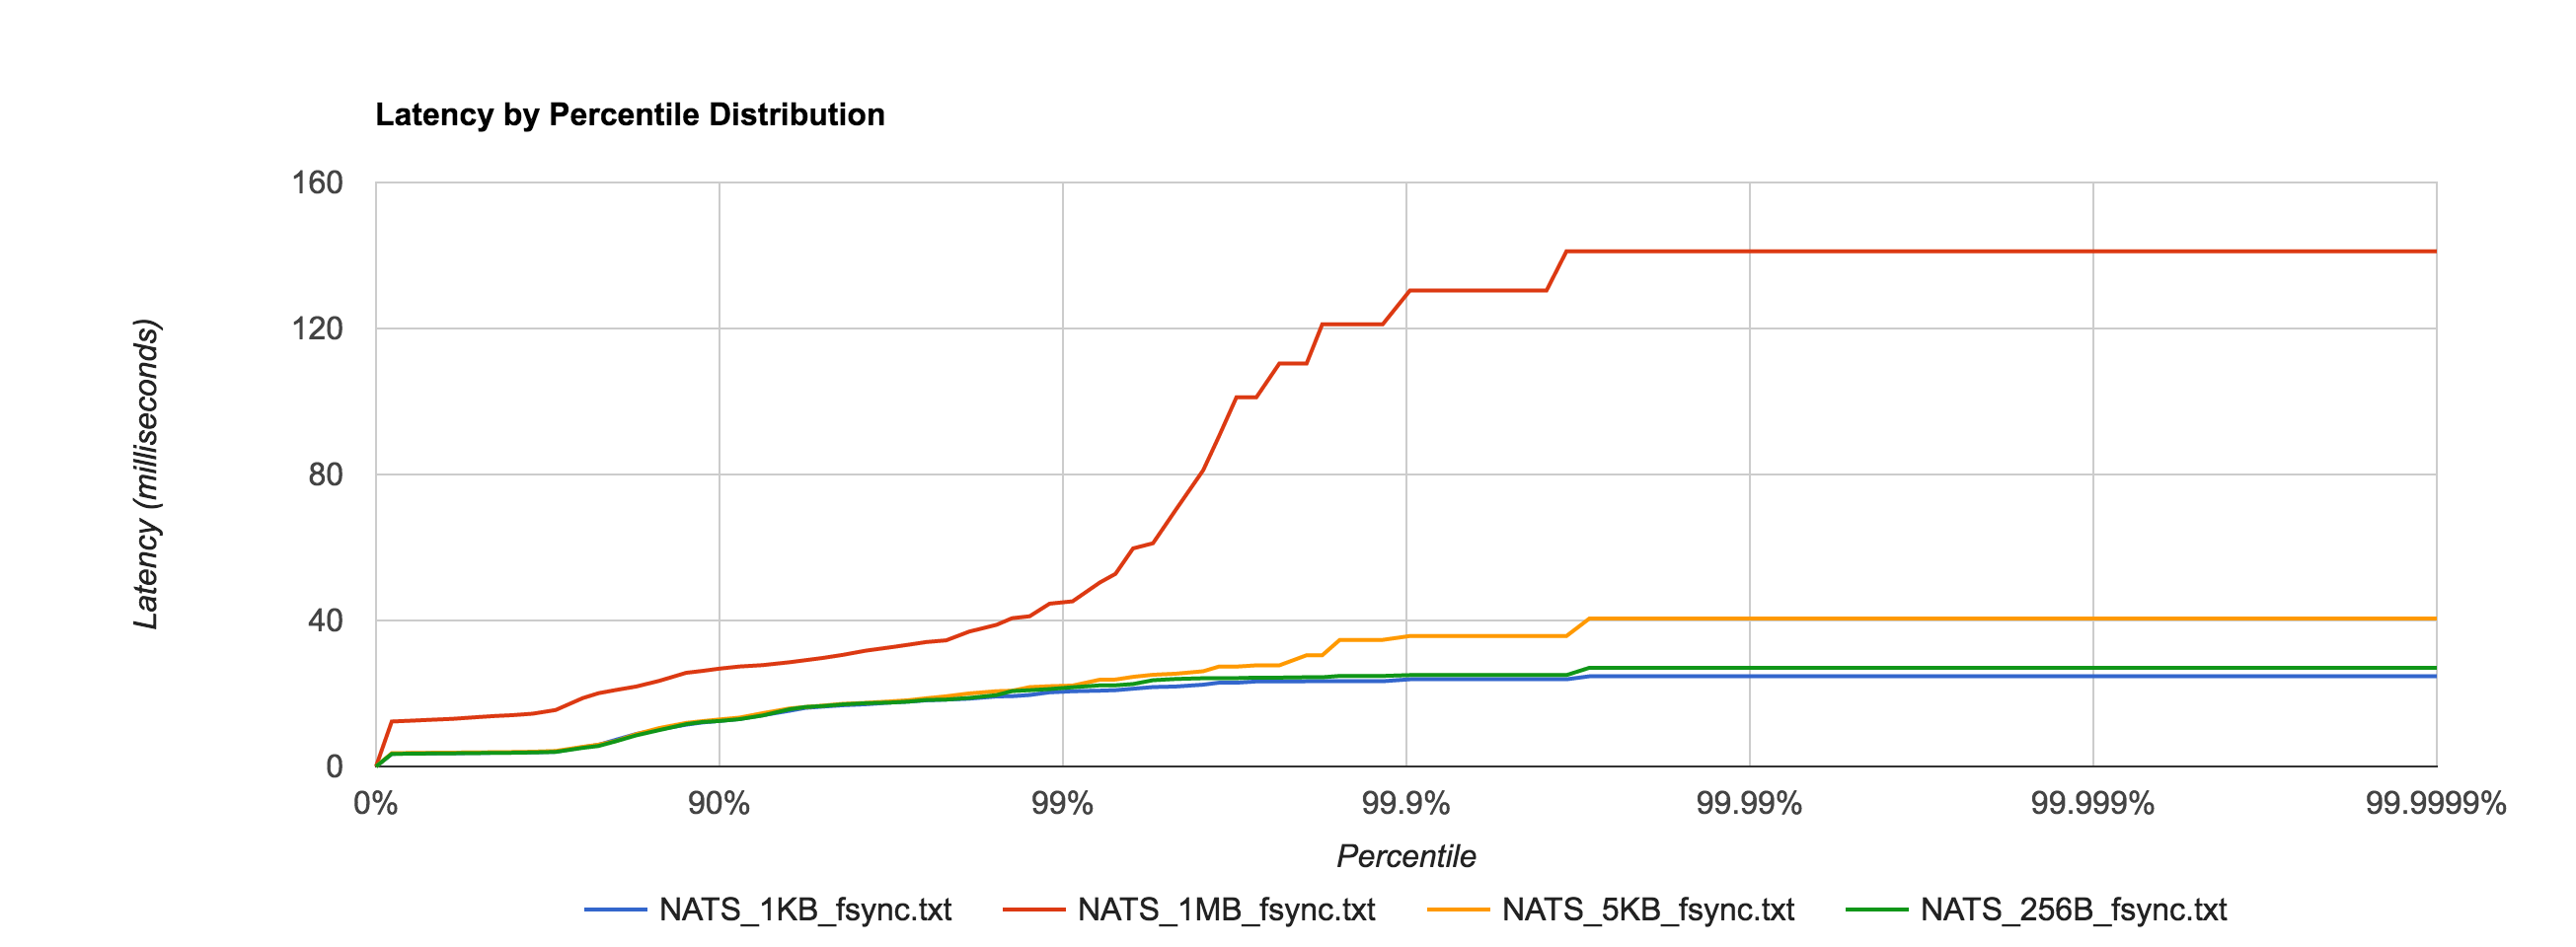
As expected, latencies increase by about an order of magnitude once we start going to disk.

nats_file_fsync

NATS Streaming 0.3.1 (file-backed persistence)

 Size 99% 99.9% 99.99% 99.999% 99.9999% 
256B 21.7051ms 25.0369ms 27.0524ms 27.0524ms 27.0524ms
1KB 20.6090ms 23.8858ms 24.7124ms 24.7124ms 24.7124ms
5KB 22.1692ms 35.7394ms 40.5612ms 40.5612ms 40.5612ms
1MB 45.2490ms 130.3972ms 141.1564ms 141.1564ms 141.1564ms

Since we will be looking at Kafka, there is an important thing to consider relating to fsync behavior. As of version 0.8, Kafka does not call fsync directly and instead relies entirely on the background flush performed by the OS. This is clearly indicated by their documentation:

We recommend using the default flush settings which disable application fsync entirely. This means relying on the background flush done by the OS and Kafka’s own background flush. This provides the best of all worlds for most uses: no knobs to tune, great throughput and latency, and full recovery guarantees. We generally feel that the guarantees provided by replication are stronger than sync to local disk, however the paranoid still may prefer having both and application level fsync policies are still supported.

However, NATS Streaming calls fsync every time a batch is written to disk by default. This can be disabled through the use of the –file_sync flag. By setting this flag to false, we put NATS Streaming’s persistence behavior closer in line with Kafka’s (again assuming a replication factor of 1).

As an aside, the comparison between NATS Streaming and Kafka still isn’t completely “fair”. Jay Kreps points out that Kafka relies on replication as the primary means of durability.

Kafka leaves [fsync] off by default because it relies on replication not fsync for durability, which is generally faster. If you don’t have replication I think you probably need fsync and maybe some kind of high integrity file system.

I don’t think we can provide a truly fair comparison until NATS Streaming supports replication, at which point we will revisit this.

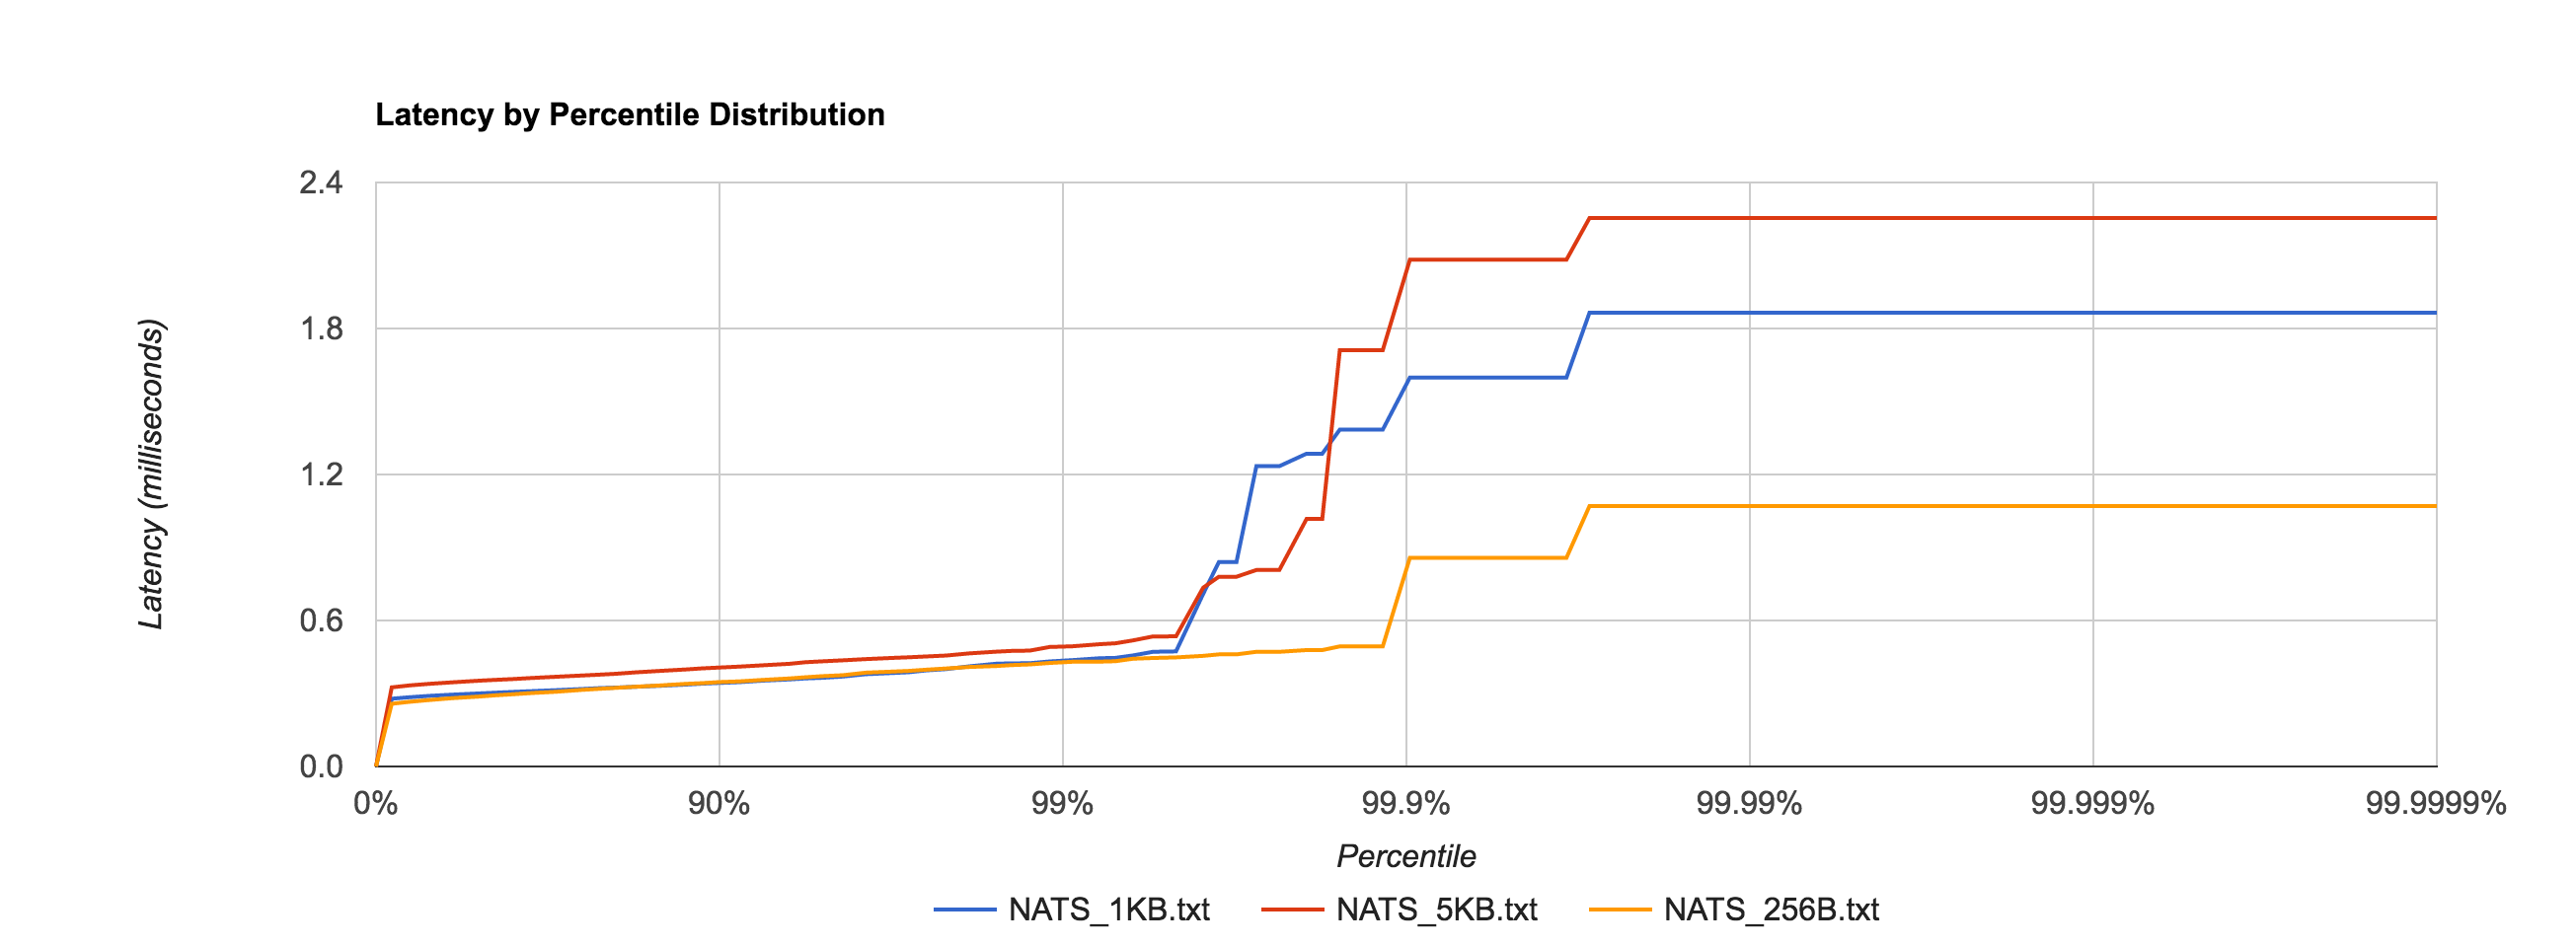
To no one’s surprise, setting –file_sync=false has a significant impact on latency, shown in the distribution below.

nats_file_no_fsync

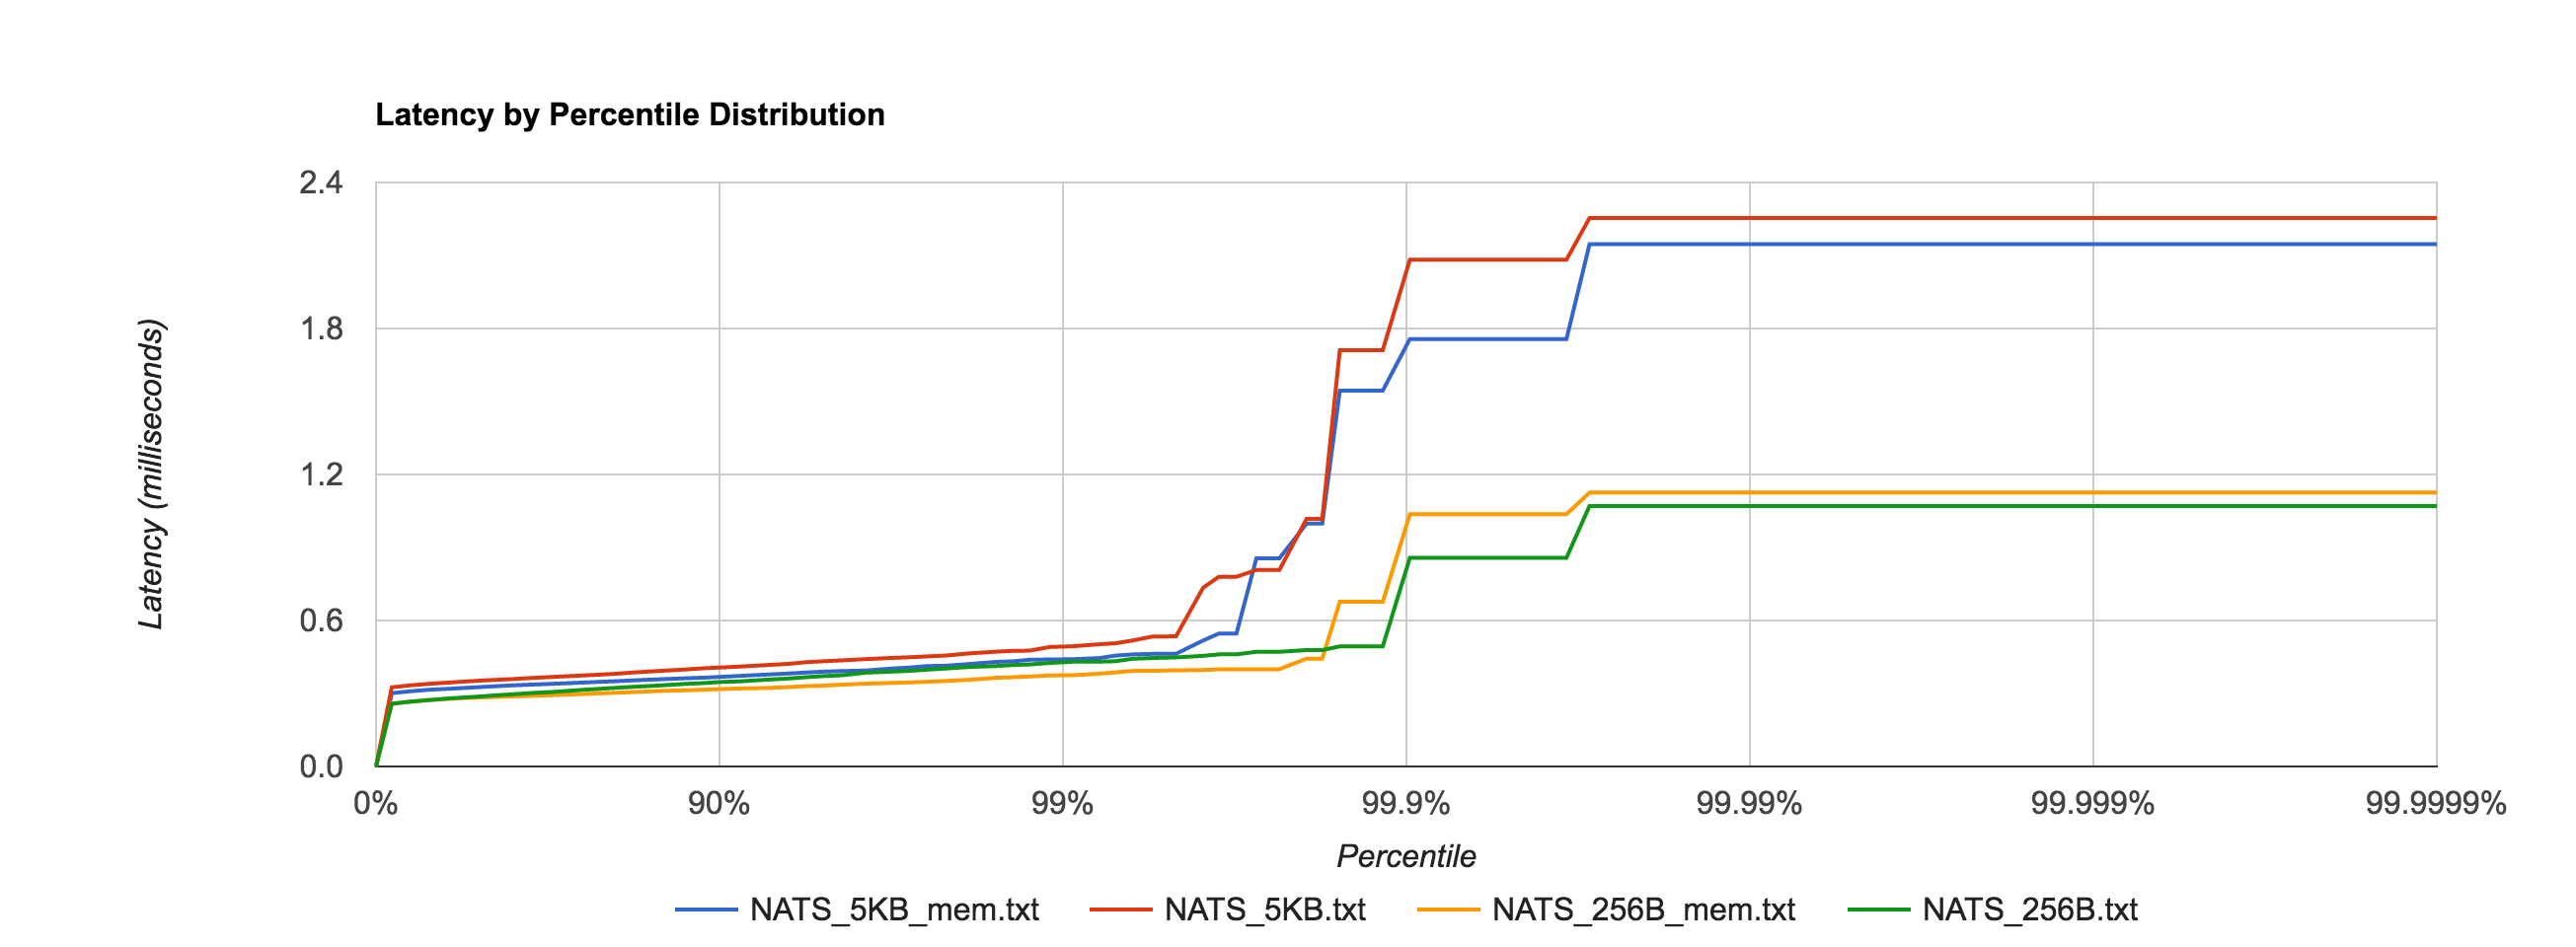
In fact, it’s now in line with the in-memory performance as before for 256B, 1KB, and 5KB messages, shown in the comparison below.

nats_file_mem

For a reason I have yet to figure out, the latency for 1MB messages is roughly an order of magnitude faster when fsync is enabled after the 95th percentile, which seems counterintuitive. If anyone has an explanation, I would love to hear it. I’m sure there’s a good debug story there. The distribution below shows the 1MB configuration for NATS Streaming with and without fsync enabled and just how big the difference is at the 95th percentile and beyond.

nats_file_mem_1mb

NATS Streaming 0.3.1 (file-backed persistence, –file_sync=false)

 Size 99% 99.9% 99.99% 99.999% 99.9999% 
256B 0.4304ms 0.8577ms 1.0706ms 1.0706ms 1.0706ms
1KB 0.4372ms 1.5987ms 1.8651ms 1.8651ms 1.8651ms
5KB 0.4939ms 2.0828ms 2.2540ms 2.2540ms 2.2540ms
1MB 1296.1464ms 1556.1441ms 1596.1457ms 1596.1457ms 1596.1457ms

Kafka with replication factor 1 tends to have higher latencies than NATS Streaming with –file_sync=false. There was one potential caveat here Ivan Kozlovic pointed out to me in that NATS Streaming uses a caching optimization for reads that may put it at an advantage.

Now, there is one side where NATS Streaming *may* be looking better and not fair to Kafka. By default, the file store keeps everything in memory once stored. This means look-ups will be fast. There is only a all-or-nothing mode right now, which means either cache everything or nothing. With caching disabled (–file_cache=false), every lookup will result in disk access (which when you have 1 to many subscribers will be bad). I am working on changing that. But if you do notice that in Kafka, consuming results in a disk read (given the other default behavior described above, they actually may not ;-)., then you could disable NATS Streaming file caching.

Fortunately, we can verify if Kafka is actually going to disk to read messages back from the log during the benchmark using iostat. We see something like this for the majority of the benchmark duration:

avg-cpu:  %user   %nice %system %iowait  %steal   %idle
          13.53    0.00   11.28    0.00    0.00   75.19

Device:    tps   Blk_read/s   Blk_wrtn/s   Blk_read   Blk_wrtn
xvda      0.00         0.00         0.00          0          0

Specifically, we’re interested in Blk_read, which indicates the total number of blocks read. It appears that Kafka does indeed make heavy use of the operating system’s page cache as Blk_wrtn and Blk_read rarely show any activity throughout the entire benchmark. As such, it seems fair to leave NATS Streaming’s –file_cache=true, which is the default.

One interesting point is Kafka offloads much of its caching to the page cache and outside of the JVM heap, clearly in an effort to minimize GC pauses. I’m not clear if the cache Ivan refers to in NATS Streaming is off-heap or not (NATS Streaming is written in Go which, like Java, is a garbage-collected language).

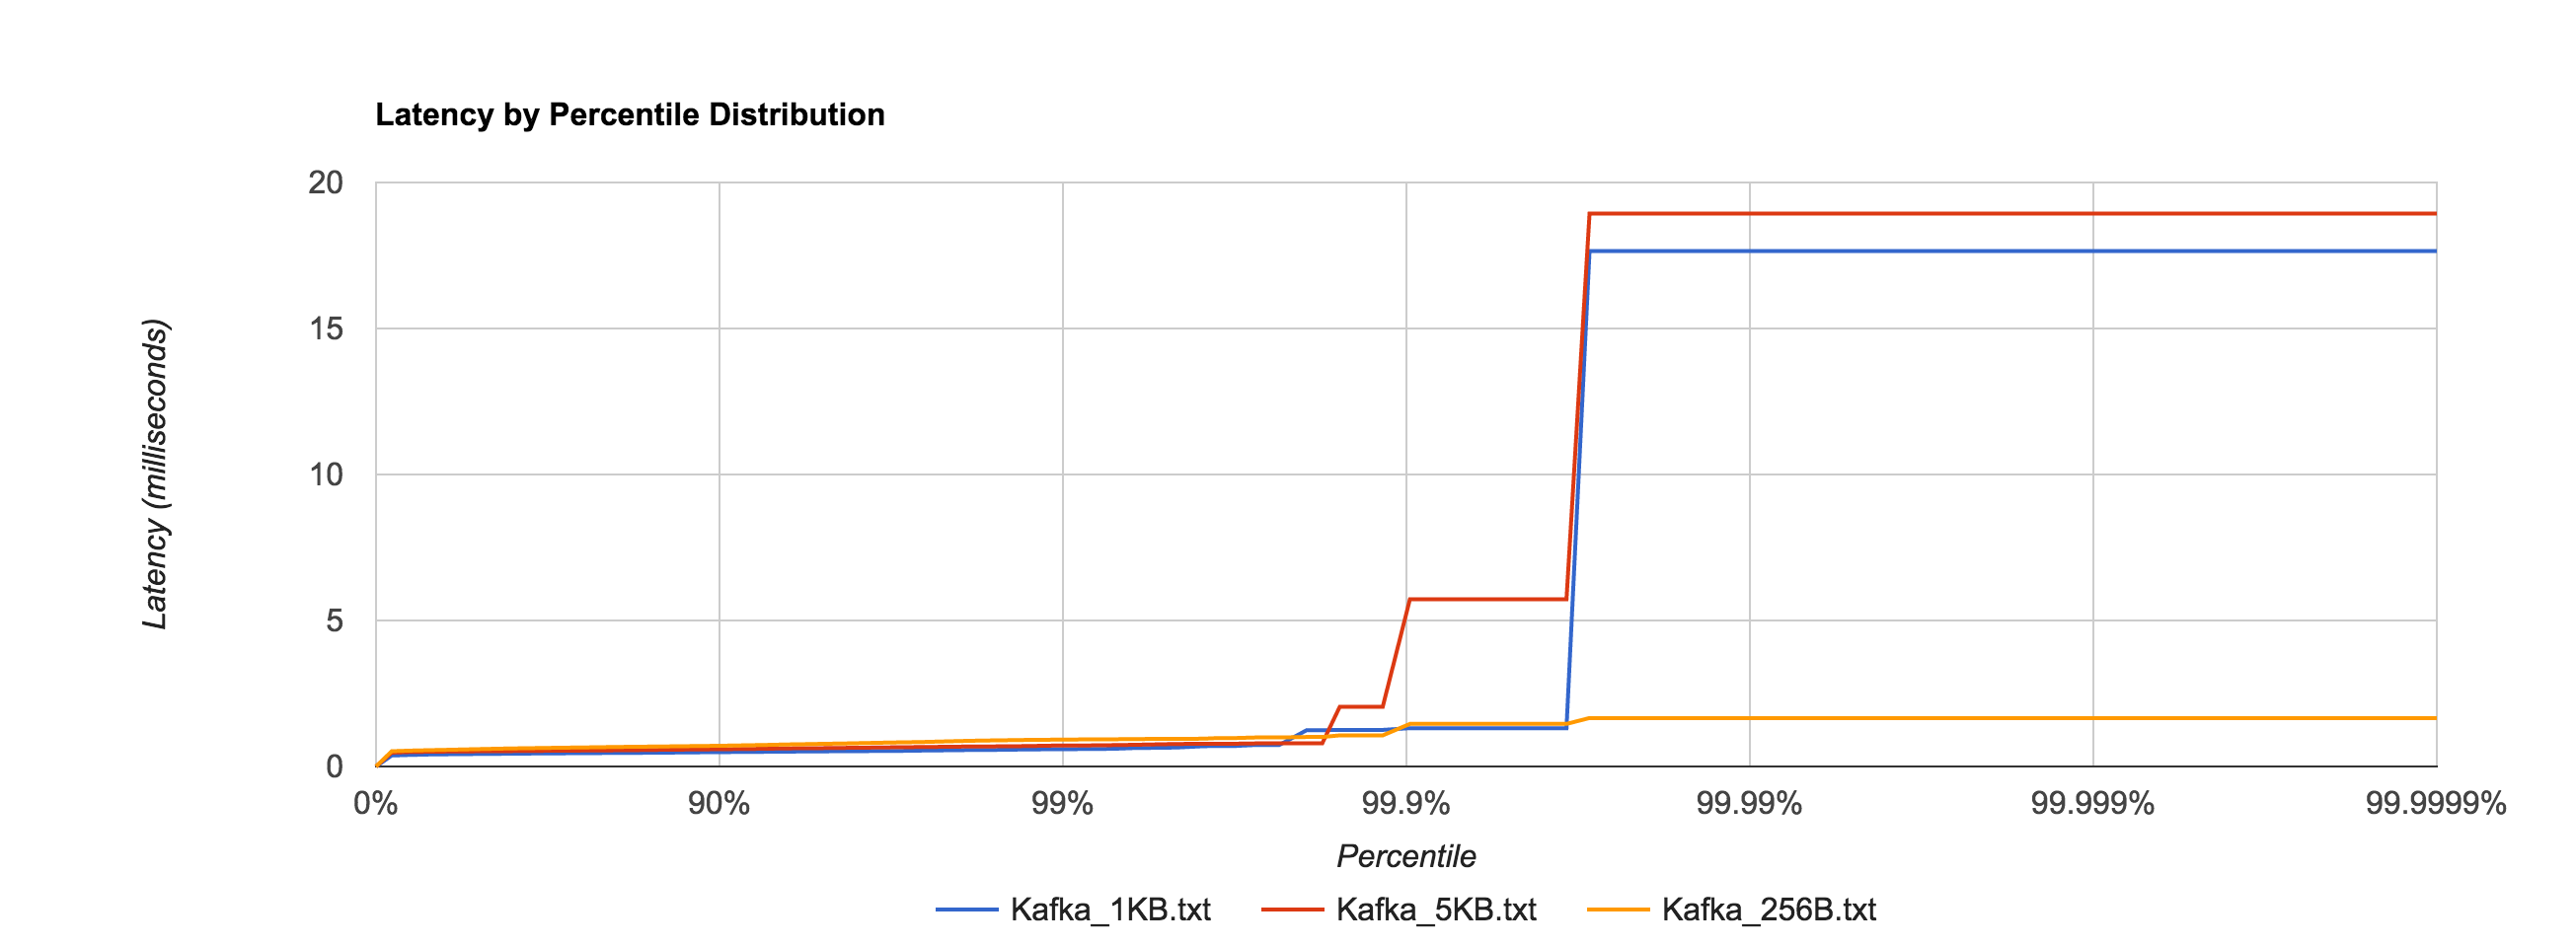
Below is the distribution of latencies for 256B, 1KB, and 5KB configurations in Kafka.

kafka

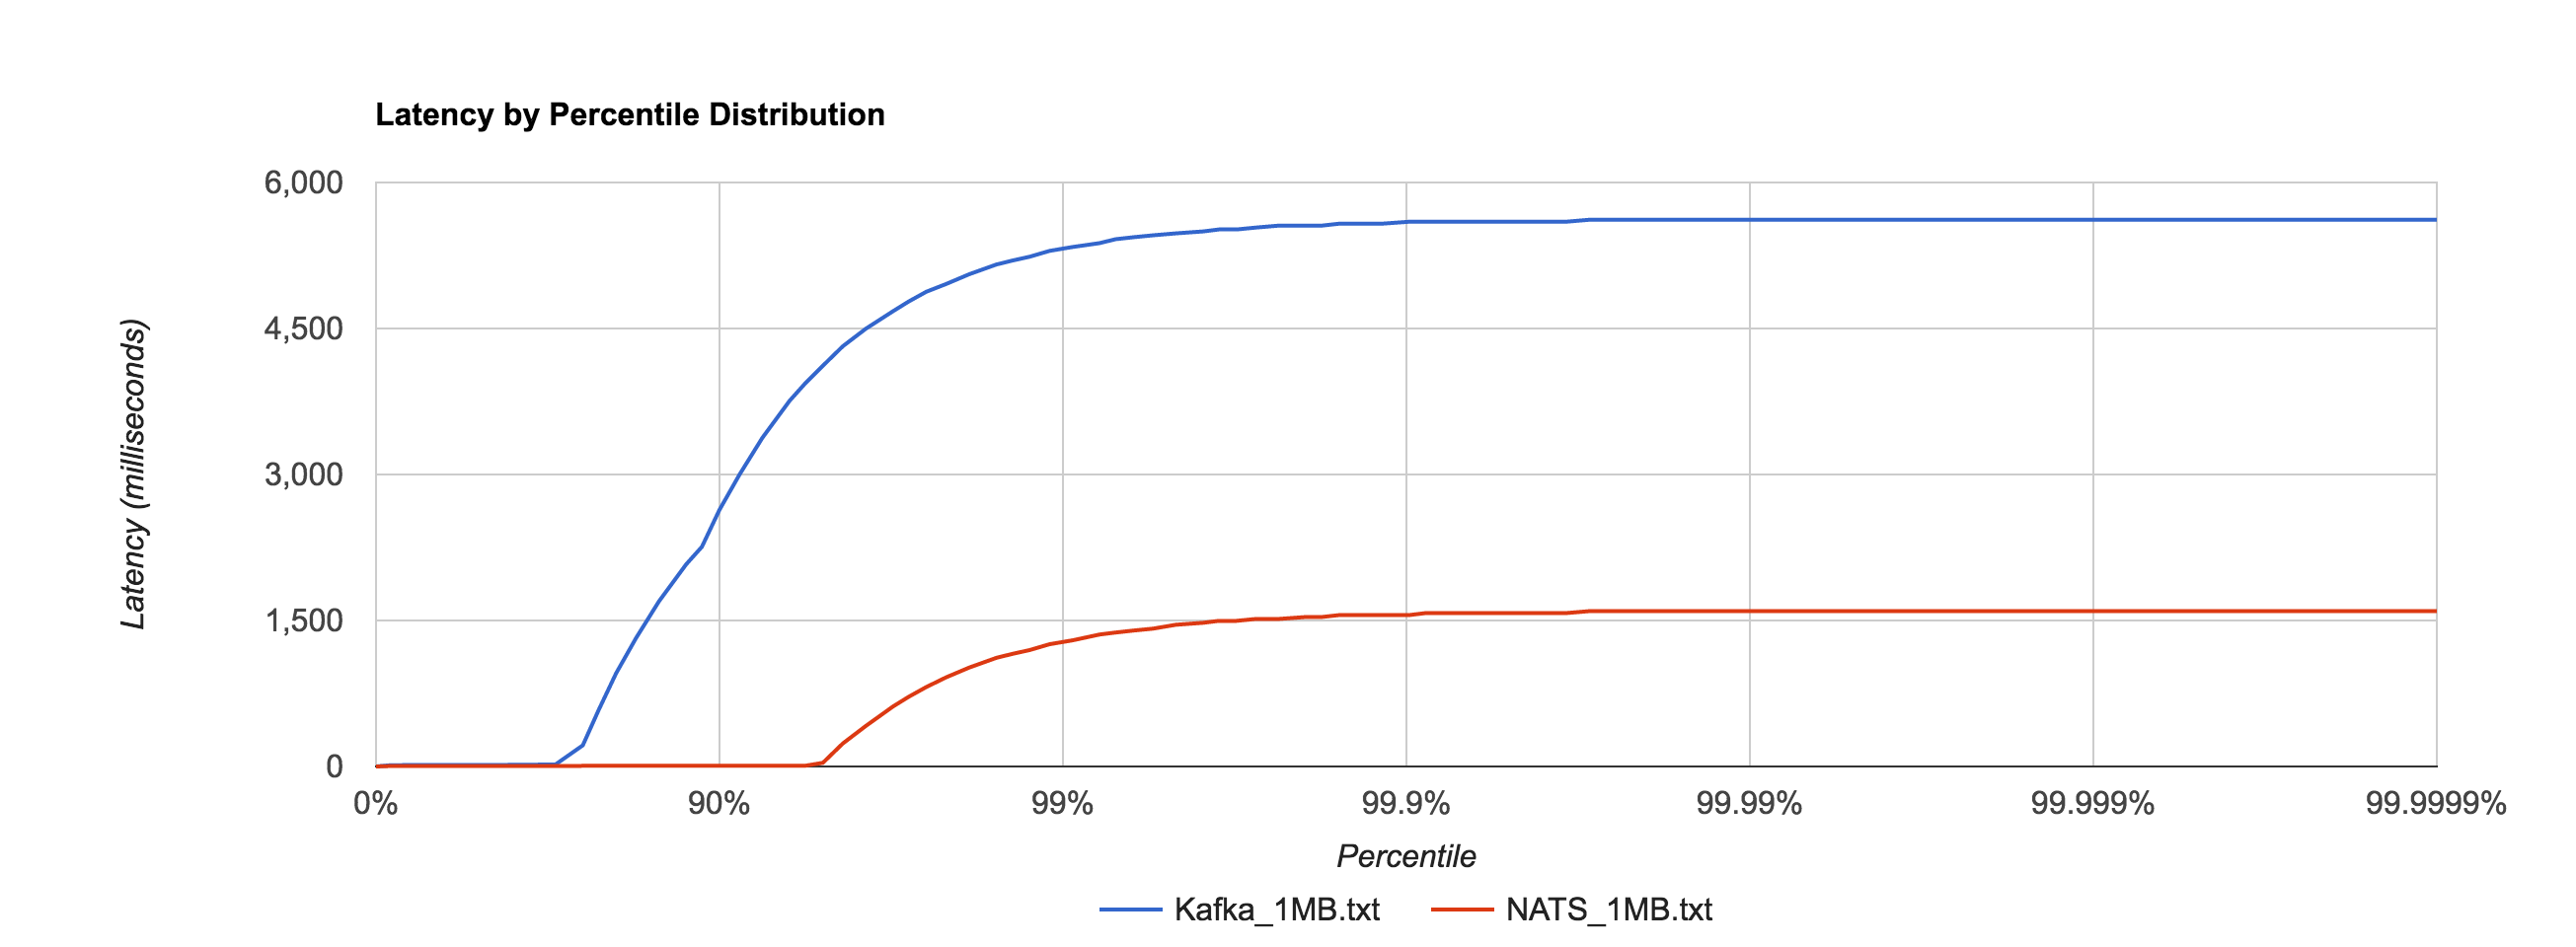
Similar to NATS Streaming, 1MB message latencies tend to be orders of magnitude worse after about the 80th percentile. The distribution below compares the 1MB configuration for NATS Streaming and Kafka.

nats_kafka_1mb

Kafka 0.10.1.0 (replication factor 1)

 Size 99% 99.9% 99.99% 99.999% 99.9999% 
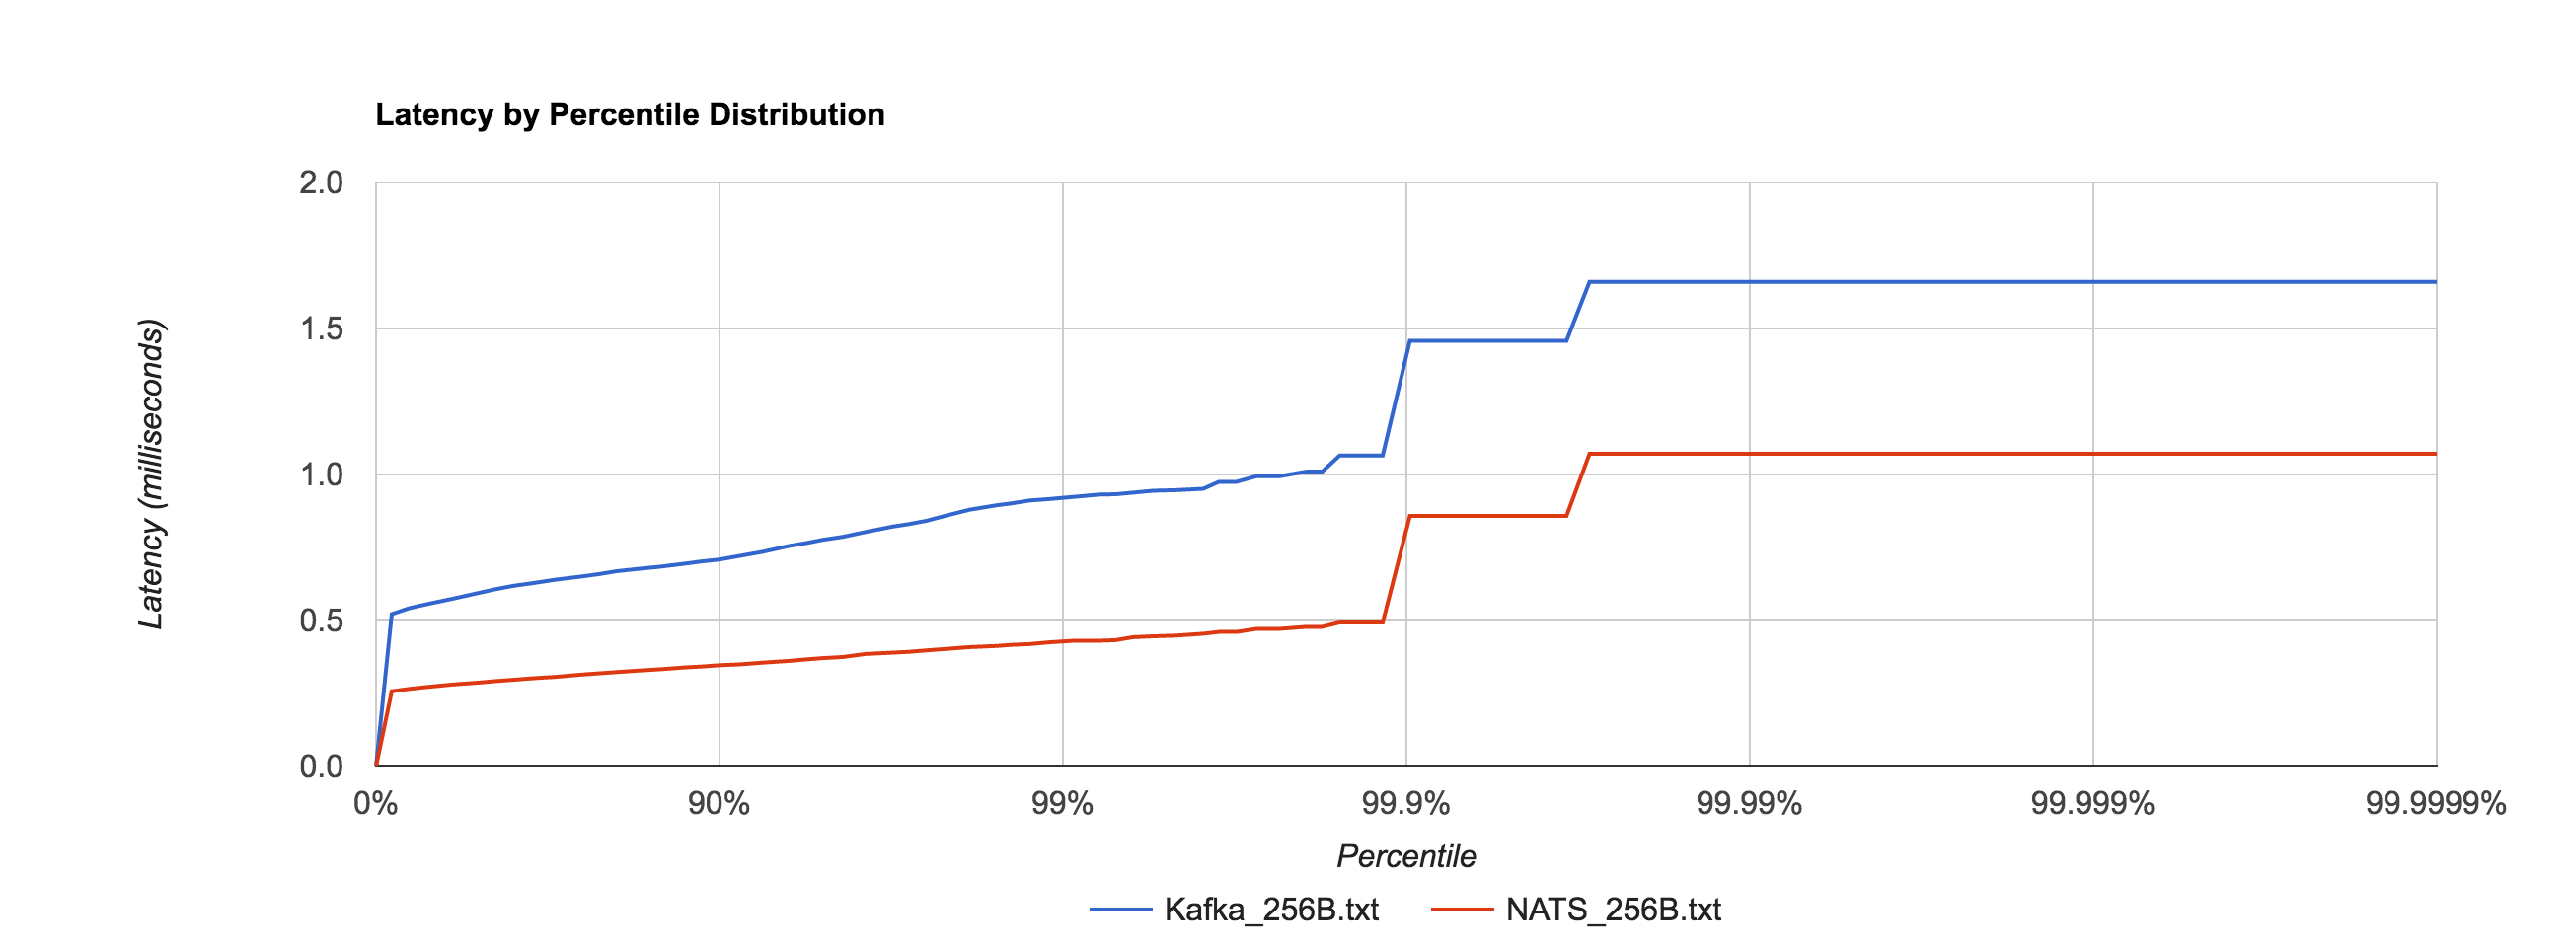
256B 0.9230ms 1.4575ms 1.6596ms 1.6596ms 1.6596ms
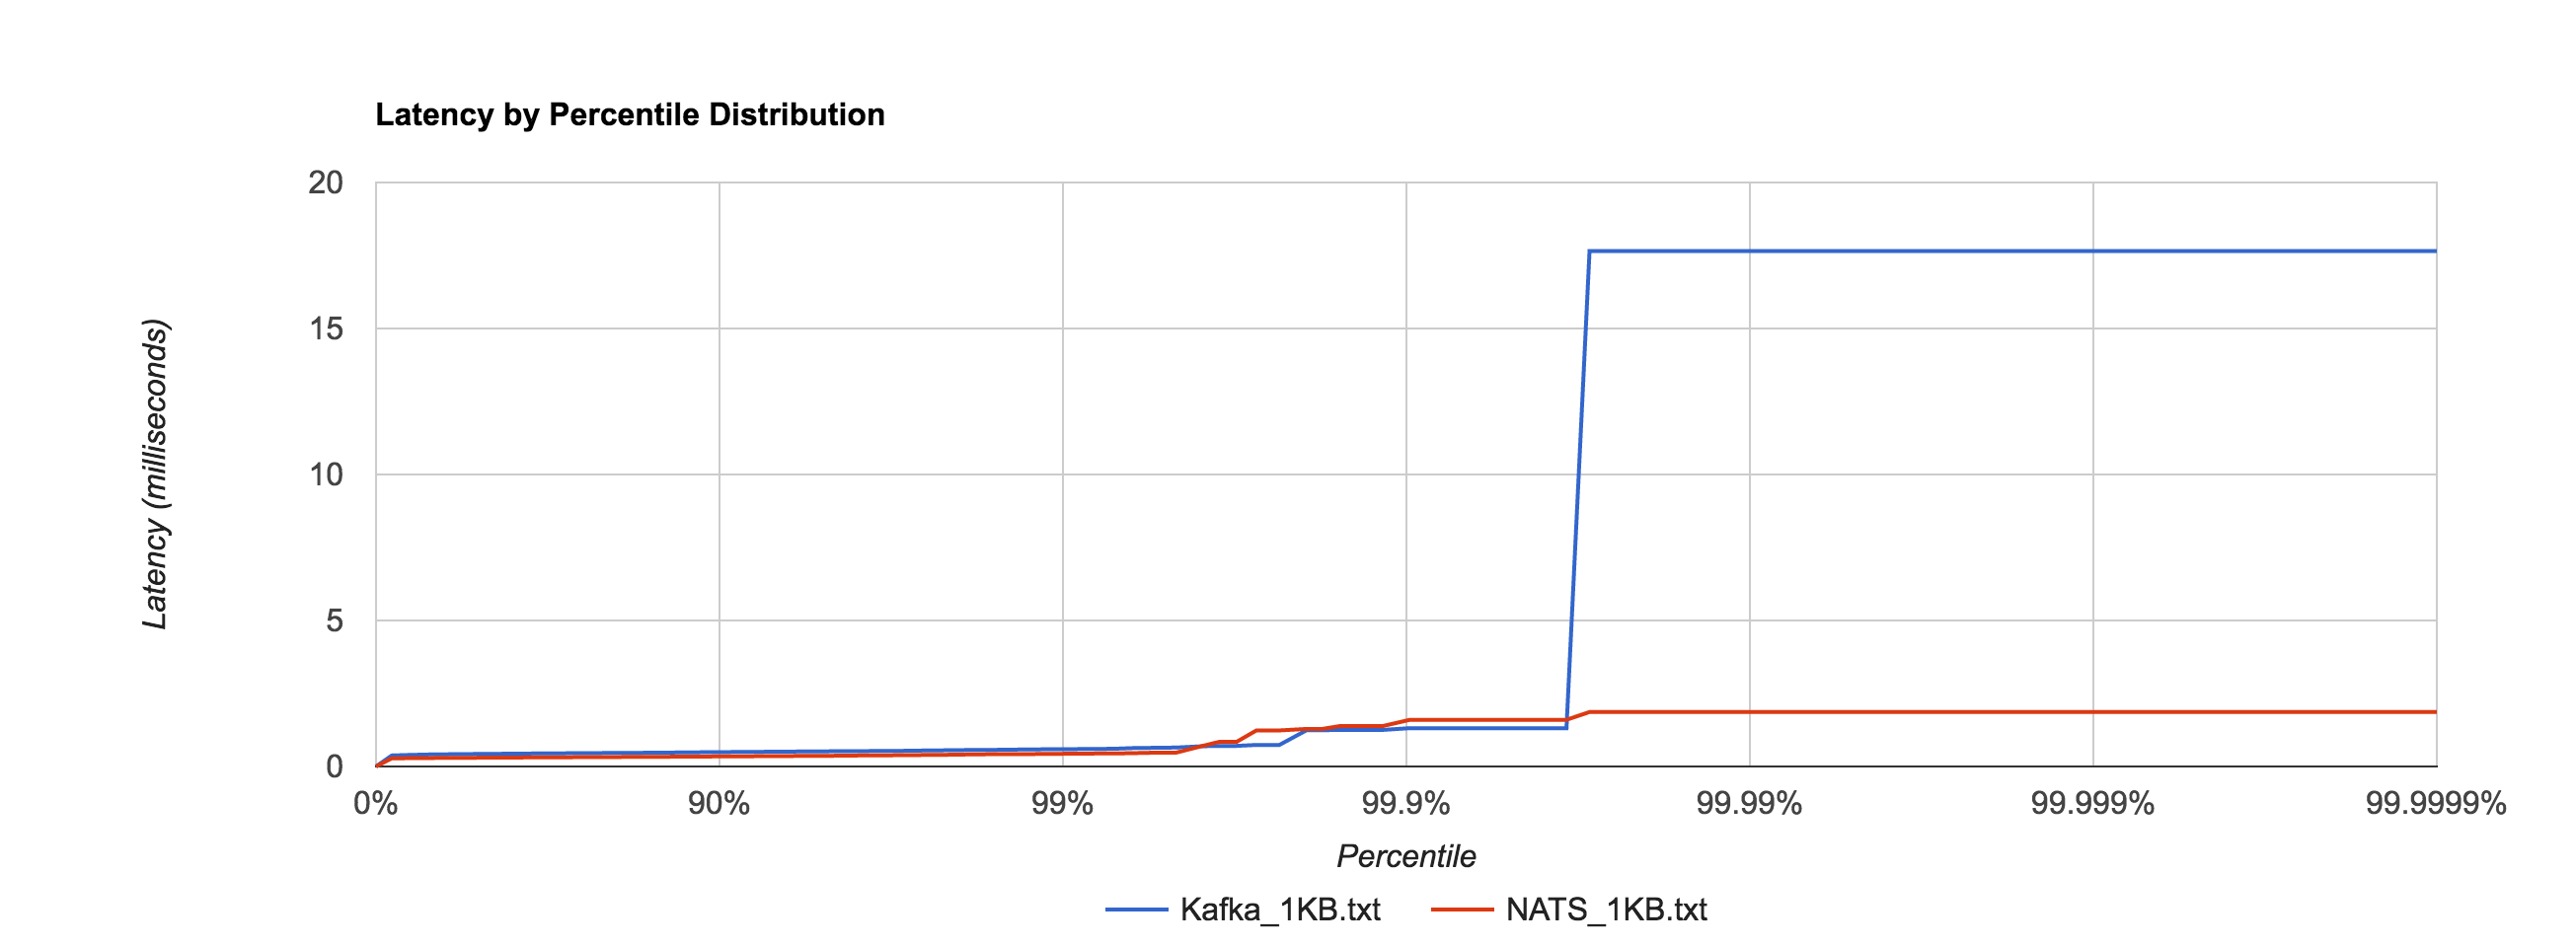
1KB 0.5942ms 1.3123ms 17.6556ms 17.6556ms 17.6556ms
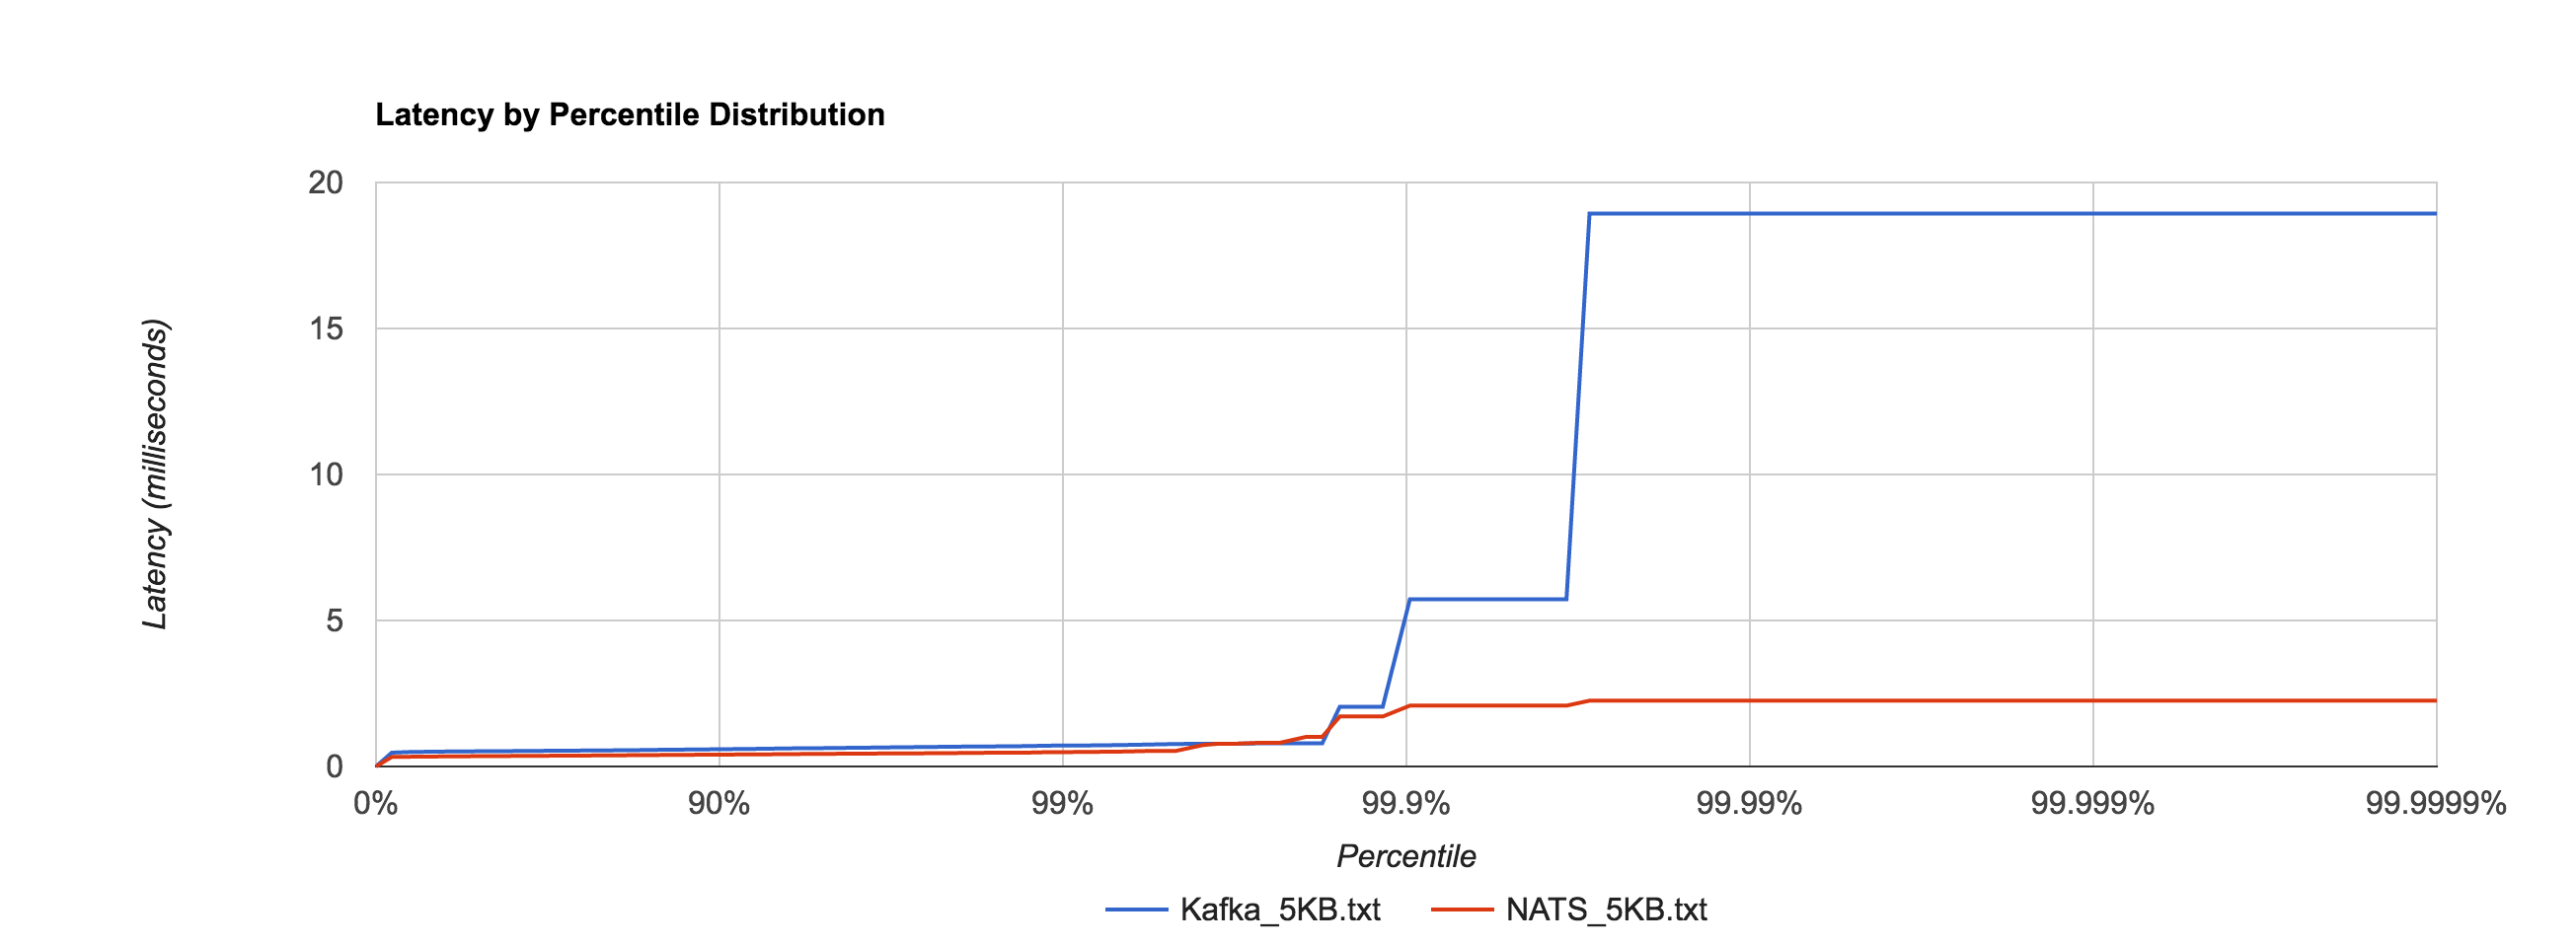
5KB 0.7203ms 5.7236ms 18.9334ms 18.9334ms 18.9334ms
1MB 5337.3174ms 5597.3315ms 5617.3199ms 5617.3199ms 5617.3199ms

The percentile distributions below compare NATS Streaming and Kafka for the 256B, 1KB, and 5KB configurations, respectively.

nats_kafka_256b

nats_kafka_1kb

nats_kafka_5kb

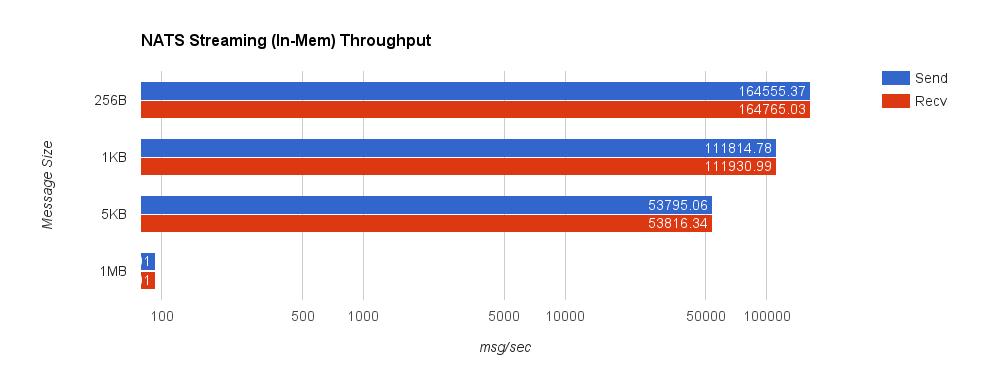
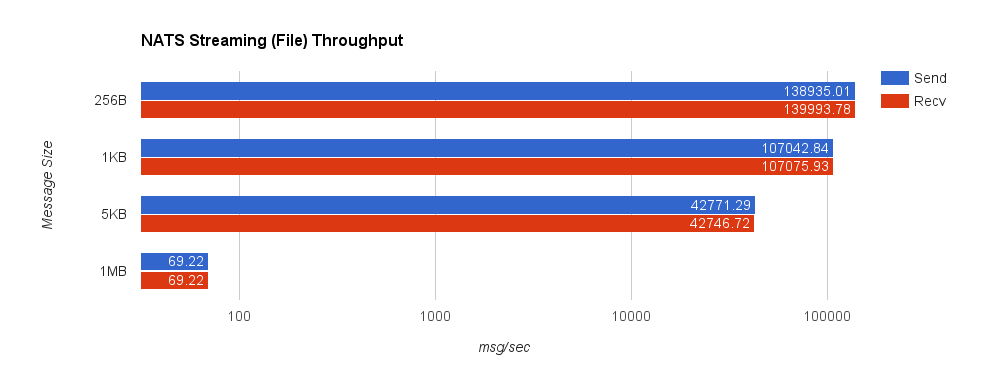
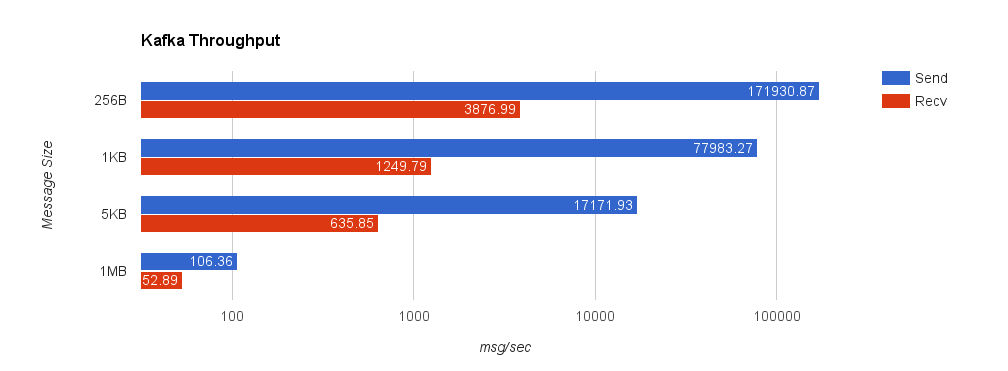
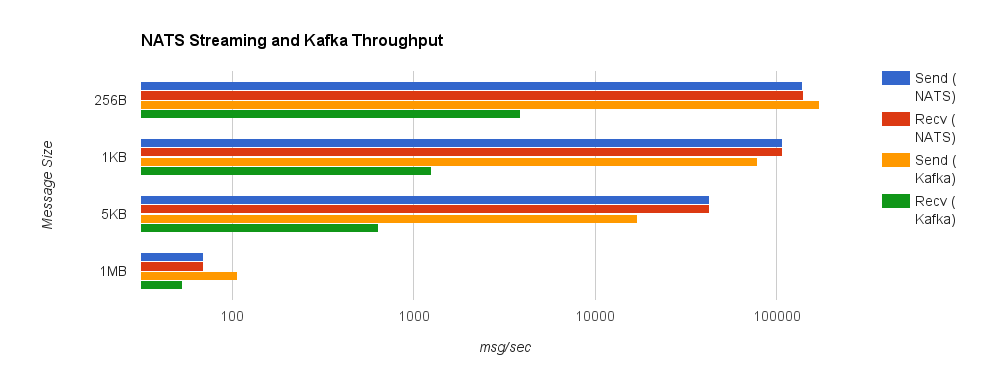
Next, we’ll look at overall throughput for the two systems. This is done by publishing 100,000 messages using the same range of sizes as before and measuring the elapsed time. Specifically, we measure throughput at the publisher and the subscriber.

Despite using an asynchronous publisher in both the NATS Streaming and Kafka benchmarks, we do not consider the publisher “complete” until it has received acks for all published messages from the server. In Kafka, we do this by setting request.required.acks to 1, which means the leader replica has received the data, and consuming the received acks. This is important because the default value is 0, which means the producer never waits for an ack from the broker. In NATS Streaming, we provide an ack callback on every publish. We use the same benchmark configuration as the latency tests, separating load generation and consumption on different EC2 instances. Note the log scale in the following charts.

Once again, we’ll start by looking at NATS Streaming using in-memory persistence. The truncated 1MB send and receive throughputs are 93.01 messages/second.

nats_mem_throughput

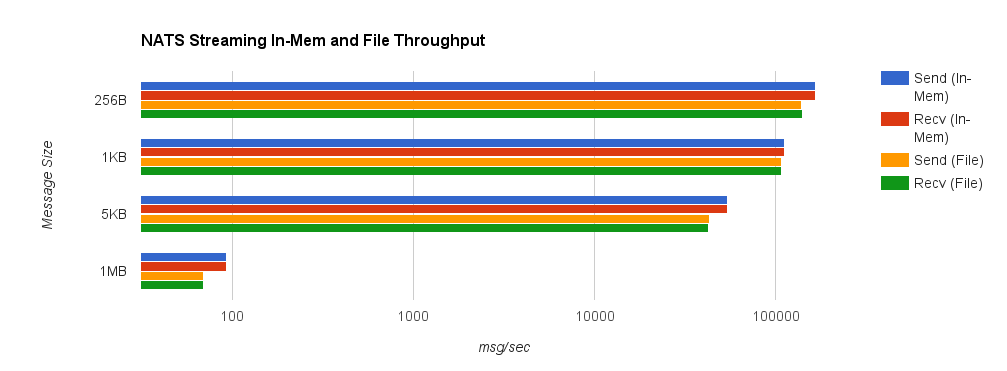
For comparison, we now look at NATS Streaming with file persistence and –file_sync=false. As before, this provides the closest behavior to Kafka’s default flush behavior. The second chart shows a side-by-side comparison between NATS Streaming with in-memory and file persistence.

nats_file_throughput

nats_compare_throughput

Lastly, we look at Kafka with replication factor 1. Throughput significantly deteriorates when we set request.required.acks = 1 since the producer must wait for all acks from the server. This is important though because, by default, the client does not require an ack from the server. If this were the case, the producer would have no idea how much data actually reached the server once it finished—it could simply be buffered in the client, in flight over the wire, or in the server but not yet on disk. Running the benchmark with request.required.acks = 0 yields much higher throughput on the sender but is basically an exercise in how fast you can write to a channel using the Sarama Go client—slightly misleading.

kafka_throughput

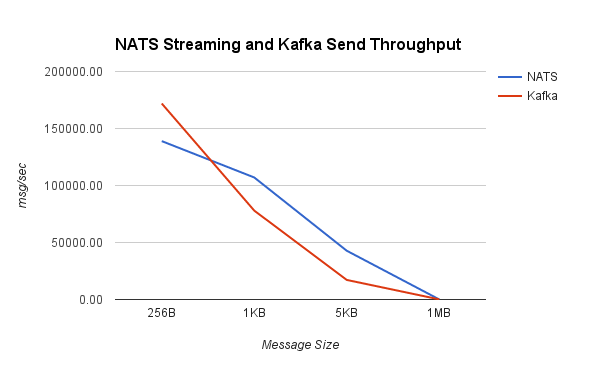
Looking at some comparisons of Kafka and NATS Streaming, we can see that NATS Streaming has higher throughput in all but a few cases.

nats_kafka_throughput

nats_kafka_send_throughput

I want to repeat the disclaimer from before: the purpose of this benchmark is to test drive the newly released NATS Streaming system (which as mentioned earlier, doesn’t yet support clustering), and put its performance into context by looking at a similar configuration of Kafka.

Kafka generally scales very well, so measuring the throughput of a single broker with a single producer and single consumer isn’t particularly meaningful. In reality, we’d be running a cluster with several brokers and partitioning our topics across them.

For as young as it is, NATS Streaming has solid performance (which shouldn’t come as much of a surprise considering the history of NATS itself), and I imagine it will only get better with time as the NATS team continues to optimize. In some ways, NATS Streaming bridges the gap between the commit log as made popular by Kafka and the conventional message queue as made popular by protocols like JMS, AMQP, STOMP, and the like.

The bigger question at this point is how NATS Streaming will tackle scaling and replication (a requirement for true production-readiness in my opinion). Kafka was designed from the ground up for high scalability and availability through the use of external coordination (read ZooKeeper). Naturally, there is a lot of complexity and cost that comes with that. NATS Streaming attempts to keep NATS’ spirit of simplicity, but it’s yet to be seen how it will reconcile that with the complex nature of distributed systems. I’m excited to see where Apcera takes NATS Streaming and generally the NATS ecosystem in the future since the team has a lot of experience in this area.

Benchmarking Message Queue Latency

About a year and a half ago, I published Dissecting Message Queues, which broke down a few different messaging systems and did some performance benchmarking. It was a naive attempt and had a lot of problems, but it was also my first time doing any kind of system benchmarking. It turns out benchmarking systems correctly is actually pretty difficult and many folks get it wrong. I don’t claim to have gotten it right, but over the past year and a half I’ve learned a lot, tried to build some better tools, and improve my methodology.

Tooling and Methodology

The Dissecting Message Queues benchmarks used a framework I wrote which published a specified number of messages effectively as fast as possible, received them, and recorded the end-to-end latency. There are several problems with this. First, load generation and consumption run on the same machine. Second, the system under test runs on the same machine as the benchmark client—both of these confound measurements. Third, running “pedal to the metal” and looking at the resulting latency isn’t a very useful benchmark because it’s not representative of a production environment (as Gil Tene likes to say, this is like driving your car as fast as possible, crashing it into a pole, and looking at the shape of the bumper afterwards—it’s always going to look bad). Lastly, the benchmark recorded average latency, which, for all intents and purposes, is a useless metric to look at.

I wrote Flotilla to automate “scaled-up” benchmarking—running the broker and benchmark clients on separate, distributed VMs. Flotilla also attempted to capture a better view of latency by looking at the latency distribution, though it only went up to the 99th percentile, which can sweep a lot of really bad things under the rug as we’ll see later. However, it still ran tests at full throttle, which isn’t great.

Bench is an attempt to get back to basics. It’s a simple, generic benchmarking library for measuring latency. It provides a straightforward Requester interface which can be implemented for various systems under test. Bench works by attempting to issue a fixed rate of requests per second and measuring the latency of each request issued synchronously. Latencies are captured using HDR Histogram, which observes the complete latency distribution and allows us to look, for example, at “six nines” latency.

Introducing a request schedule allows us to measure latency for different configurations of request rate and message size, but in a “closed-loop” test, it creates another problem called coordinated omission. The problem with a lot of benchmarks is that they end up measuring service time rather than response time, but the latter is likely what you care about because it’s what your users experience.

The best way to describe service time vs. response time is to think of a cash register. The cashier might be able to ring up a customer in under 30 seconds 99% of the time, but 1% of the time it takes three minutes. The time it takes to ring up a customer is the service time, while the response time consists of the service time plus the time the customer waited in line. Thus, the response time is dependent upon the variation in both service time and the rate of arrival. When we measure latency, we really want to measure response time.

Now, let’s think about how most latency benchmarks work. They usually do this:

  1. Note timestamp before request, t0.
  2. Make synchronous request.
  3. Note timestamp after request, t1.
  4. Record latency t1t0.
  5. Repeat as needed for request schedule.

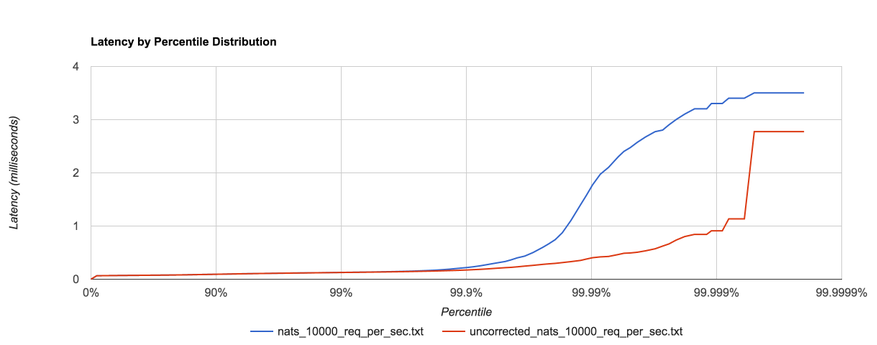
What’s the problem with this? Nothing, as long as our requests fit within the specified request schedule.  For example, if we’re issuing 100 requests per second and each request takes 10 ms to complete, we’re good. However, if one request takes 100 ms to complete, that means we issued only one request during those 100 ms when, according to our schedule, we should have issued 10 requests in that window. Nine other requests should have been issued, but the benchmark effectively coordinated with the system under test by backing off. In reality, those nine requests waited in line—one for 100 ms, one for 90 ms, one for 80 ms, etc. Most benchmarks don’t capture this time spent waiting in line, yet it can have a dramatic effect on the results. The graph below shows the same benchmark with coordinated omission both uncorrected (red) and corrected (blue):
coordinated_omission

HDR Histogram attempts to correct coordinated omission by filling in additional samples when a request falls outside of its expected interval. We can also deal with coordinated omission by simply avoiding it altogether—always issue requests according to the schedule.

Message Queue Benchmarks

I benchmarked several messaging systems using bench—RabbitMQ (3.6.0), Kafka (0.8.2.2 and 0.9.0.0), Redis (2.8.4) pub/sub, and NATS (0.7.3). In this context, a “request” consists of publishing a message to the server and waiting for a response (i.e. a roundtrip). We attempt to issue requests at a fixed rate and correct for coordinated omission, then plot the complete latency distribution all the way up to the 99.9999th percentile. We repeat this for several configurations of request rate and request size. It’s also important to note that each message going to and coming back from the server are of the specified size, i.e. the “response” is the same size as the “request.”

The configurations used are listed below. Each configuration is run for a sustained 30 seconds.

  • 256B requests at 3,000 requests/sec (768 KB/s)
  • 1KB requests at 3,000 requests/sec (3 MB/s)
  • 5KB requests at 2,000 requests/sec (10 MB/s)
  • 1KB requests at 20,000 requests/sec (20.48 MB/s)
  • 1MB requests at 100 requests/sec (100 MB/s)

These message sizes are mostly arbitrary, and there might be a better way to go about this. Though I think it’s worth pointing out that the Ethernet MTU is 1500 bytes, so accounting for headers, the maximum amount of data you’ll get in a single TCP packet will likely be between 1400 and 1500 bytes.

The system under test and benchmarking client are on two different m4.xlarge EC2 instances (2.4 GHz Intel Xeon Haswell, 16GB RAM) with enhanced networking enabled.

Redis and NATS

Redis pub/sub and NATS have similar performance characteristics. Both offer very lightweight, non-transactional messaging with no persistence options (discounting Redis’ RDB and AOF persistence, which don’t apply to pub/sub), and both support some level of topic pattern matching. I’m hesitant to call either a “message queue” in the traditional sense, so I usually just refer to them as message brokers or buses. Because of their ephemeral nature, both are a nice choice for low-latency, lossy messaging.

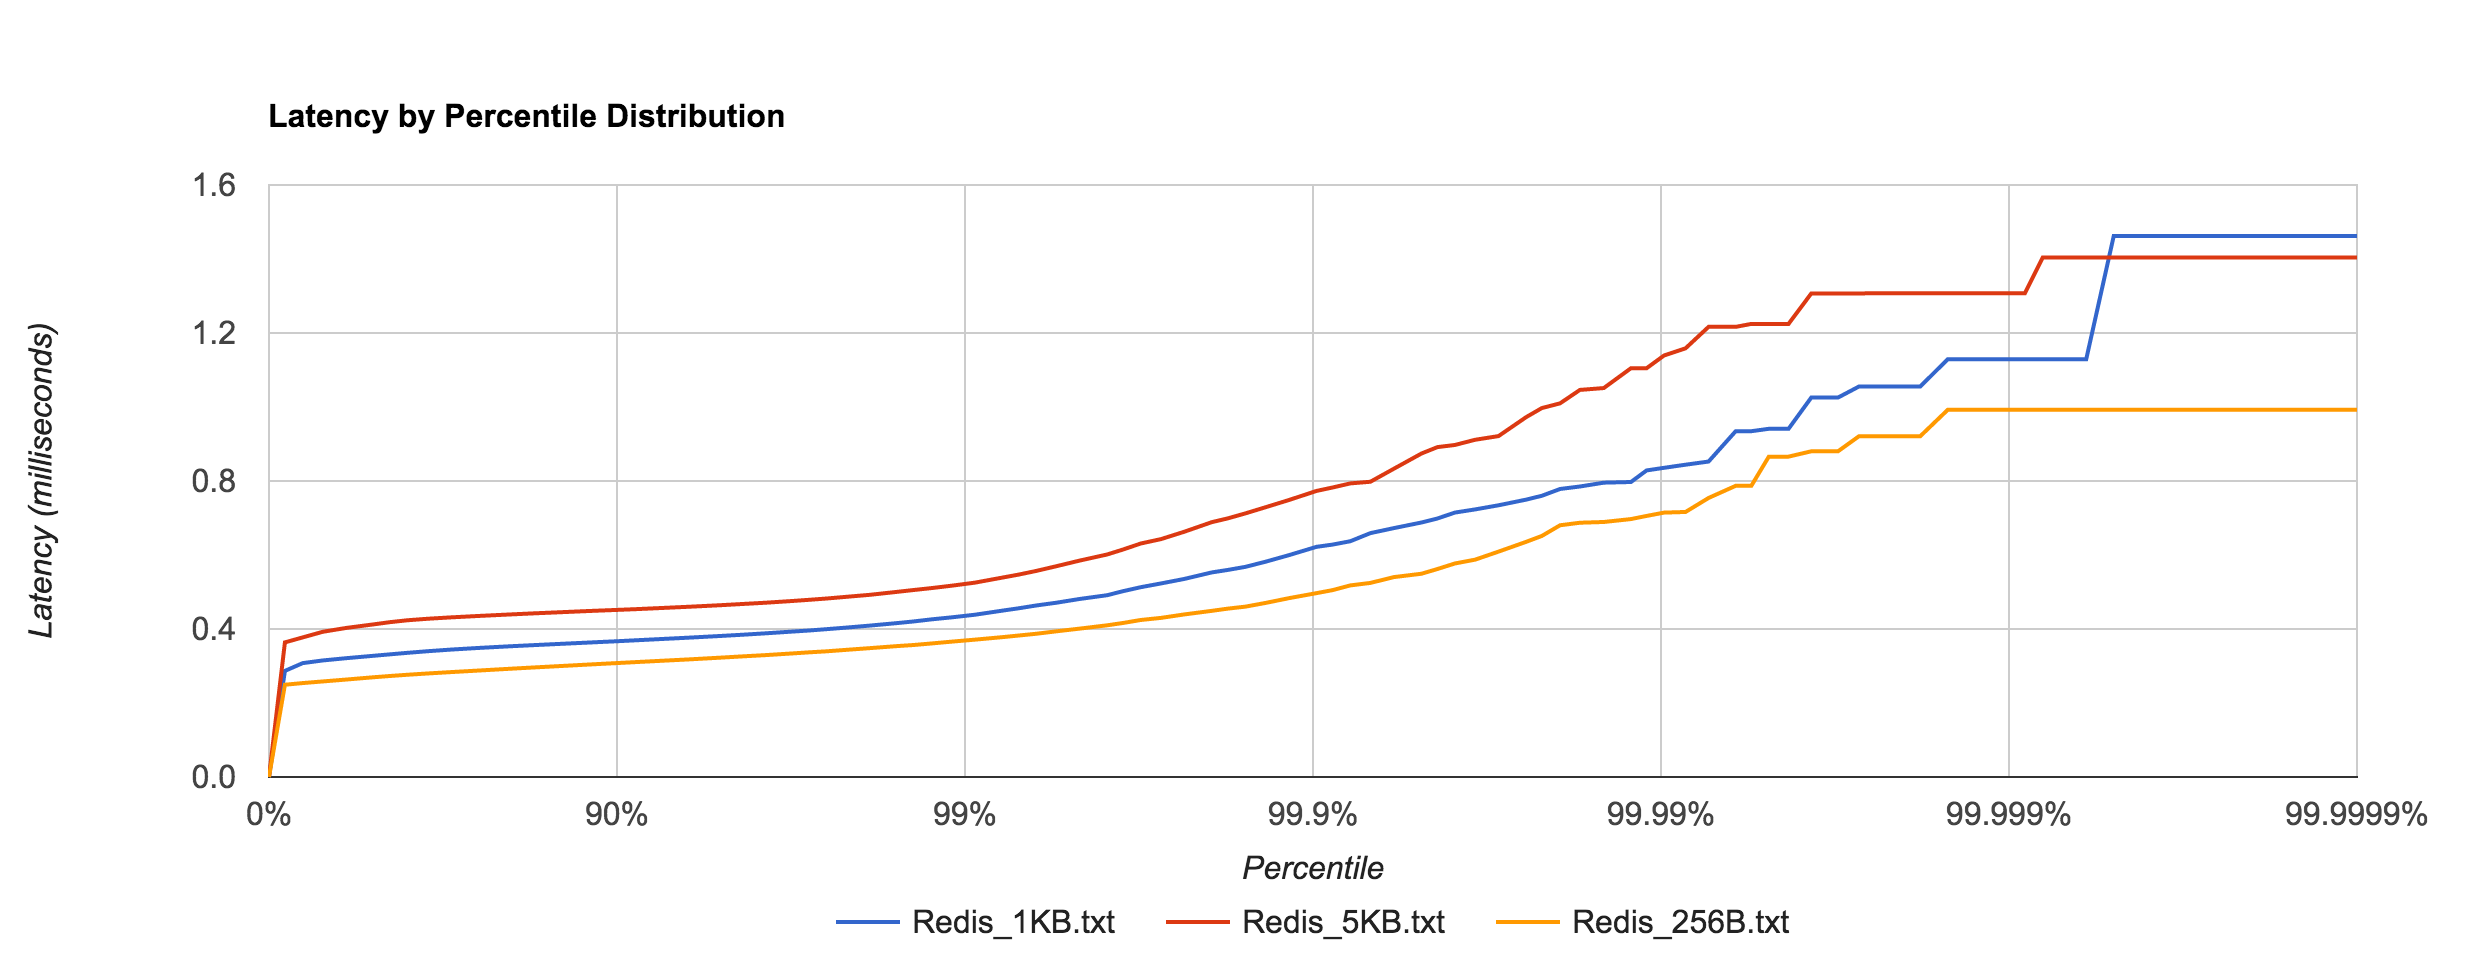
Redis tail latency peaks around 1.5 ms.

Redis_latency

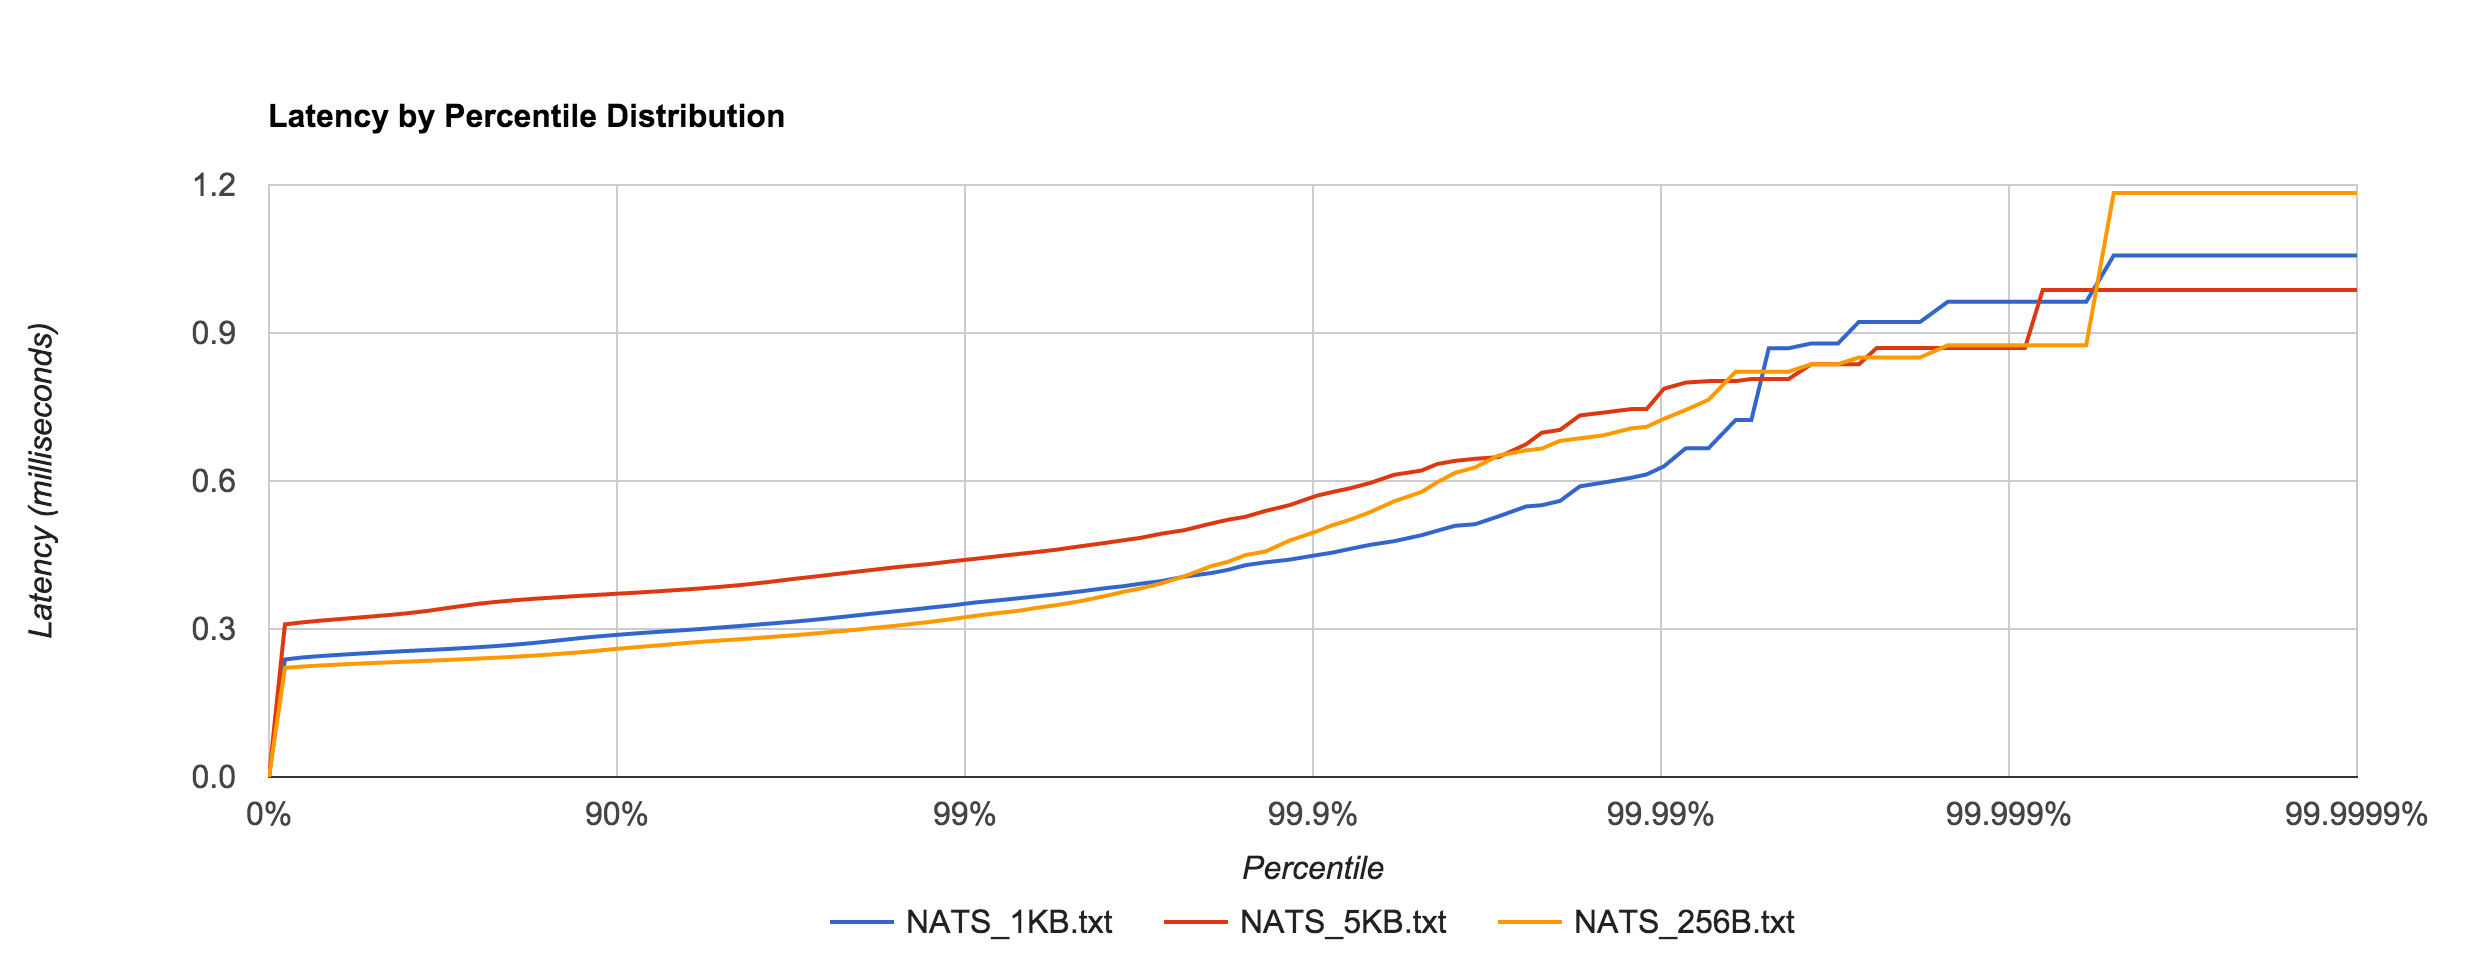
NATS performance looks comparable to Redis. Latency peaks around 1.2 ms.

NATS_latency

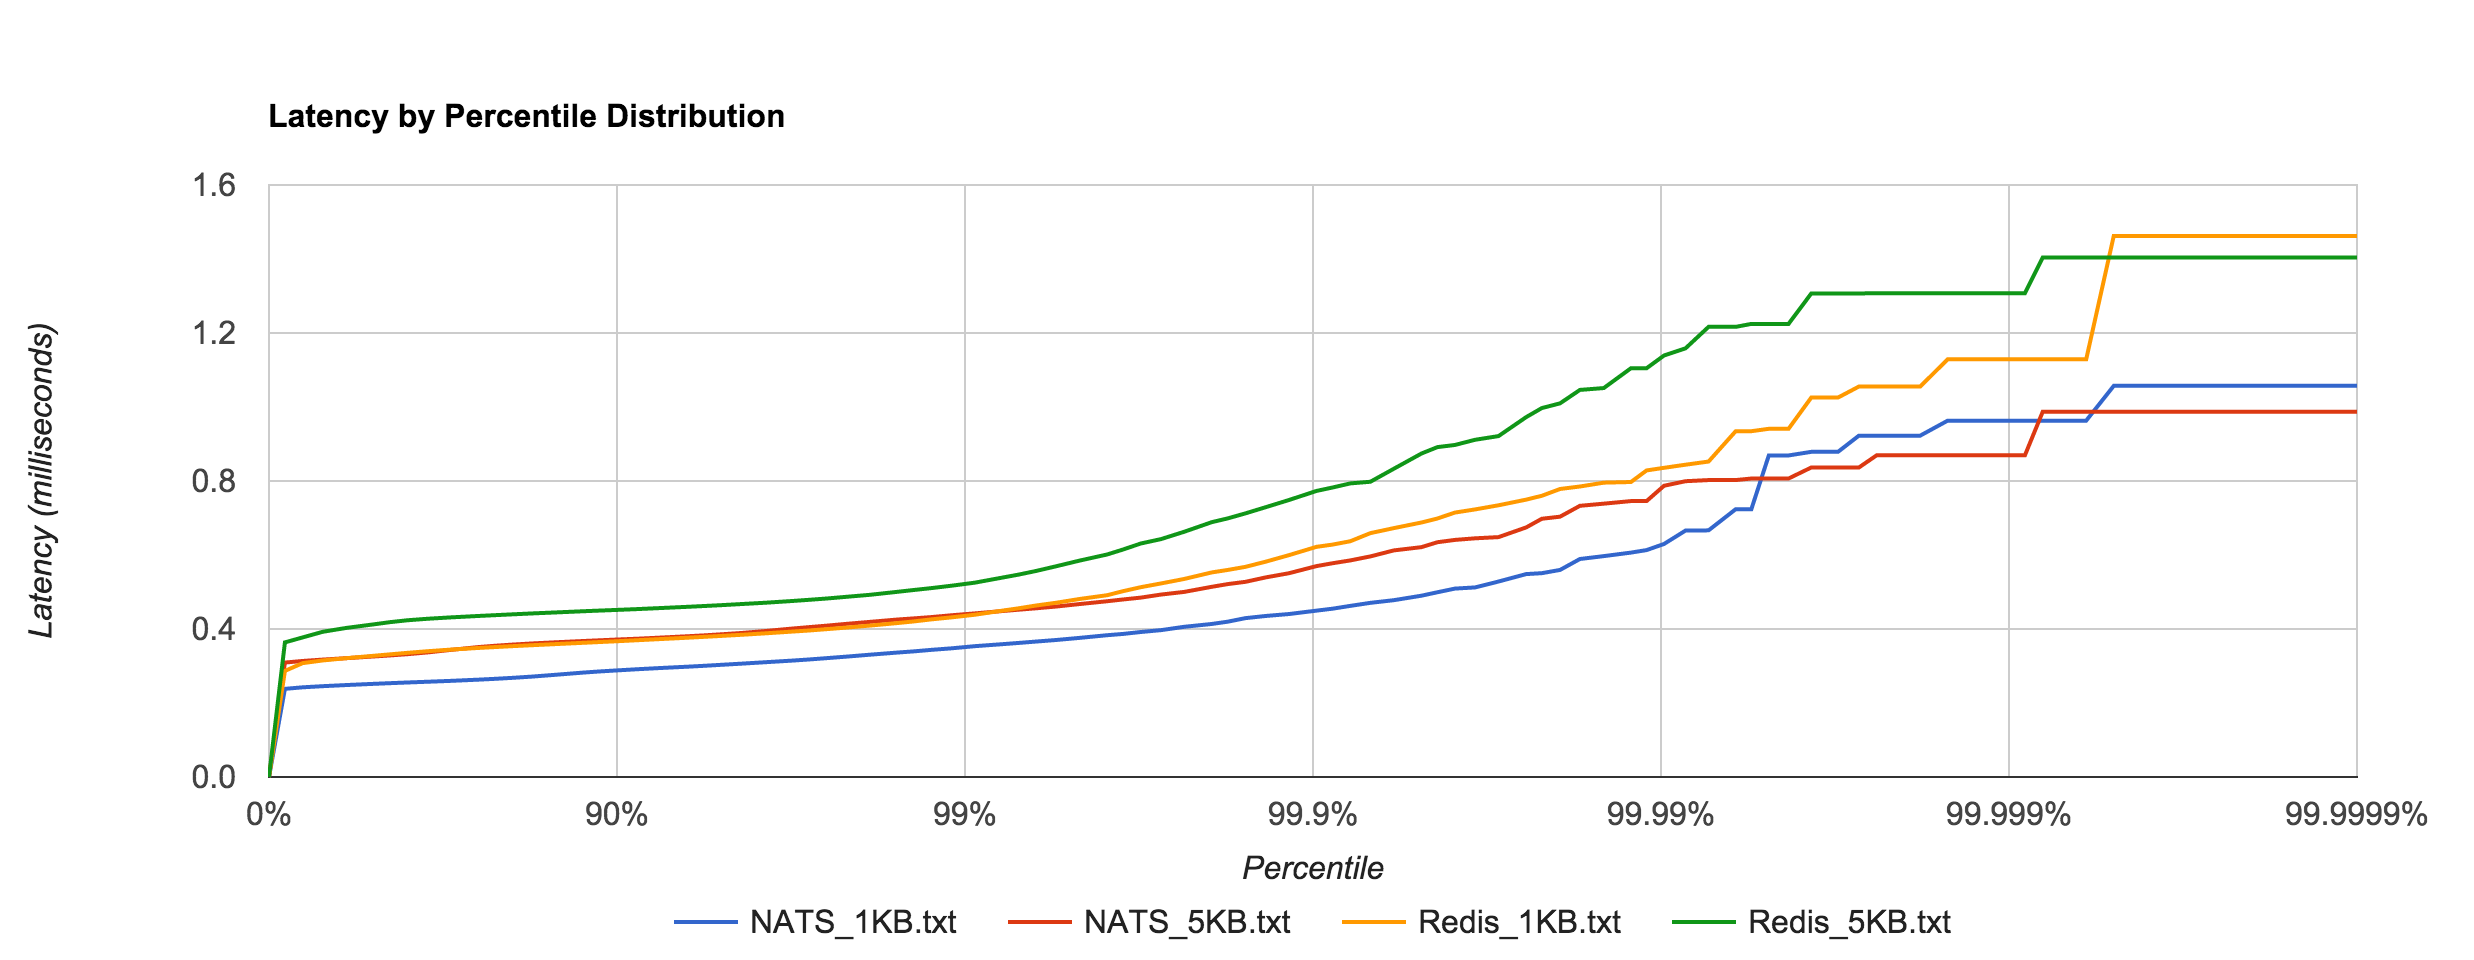
The resemblance becomes more apparent when we overlay the two distributions for the 1KB and 5KB runs. NATS tends to be about 0.1 to 0.4 ms faster.

Redis_NATS_latency

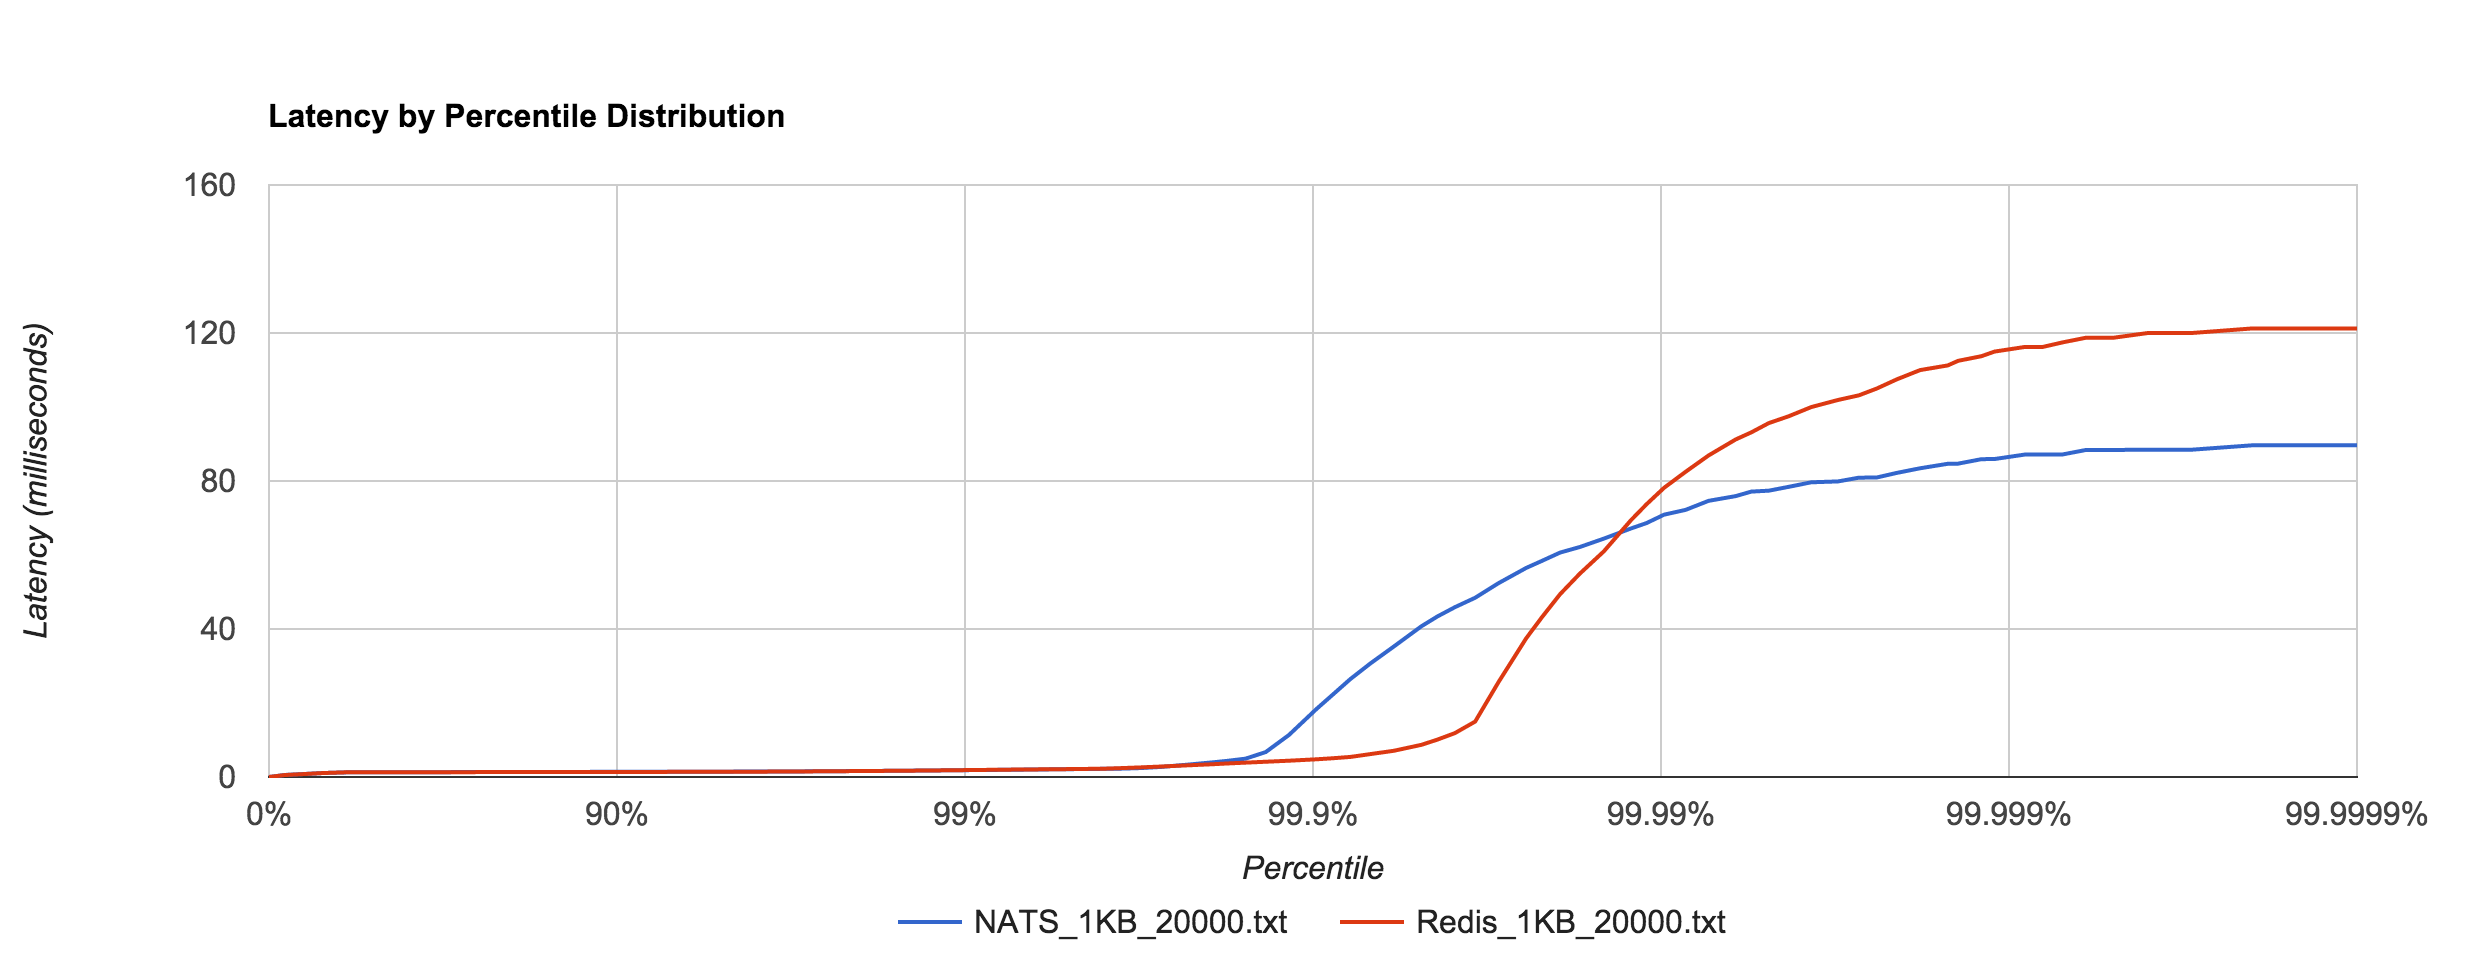
The 1KB, 20,000 requests/sec run uses 25 concurrent connections. With concurrent load, tail latencies jump up, peaking around 90 and 120 ms at the 99.9999th percentile in NATS and Redis, respectively.

Redis_NATS_1KB_20000_latency

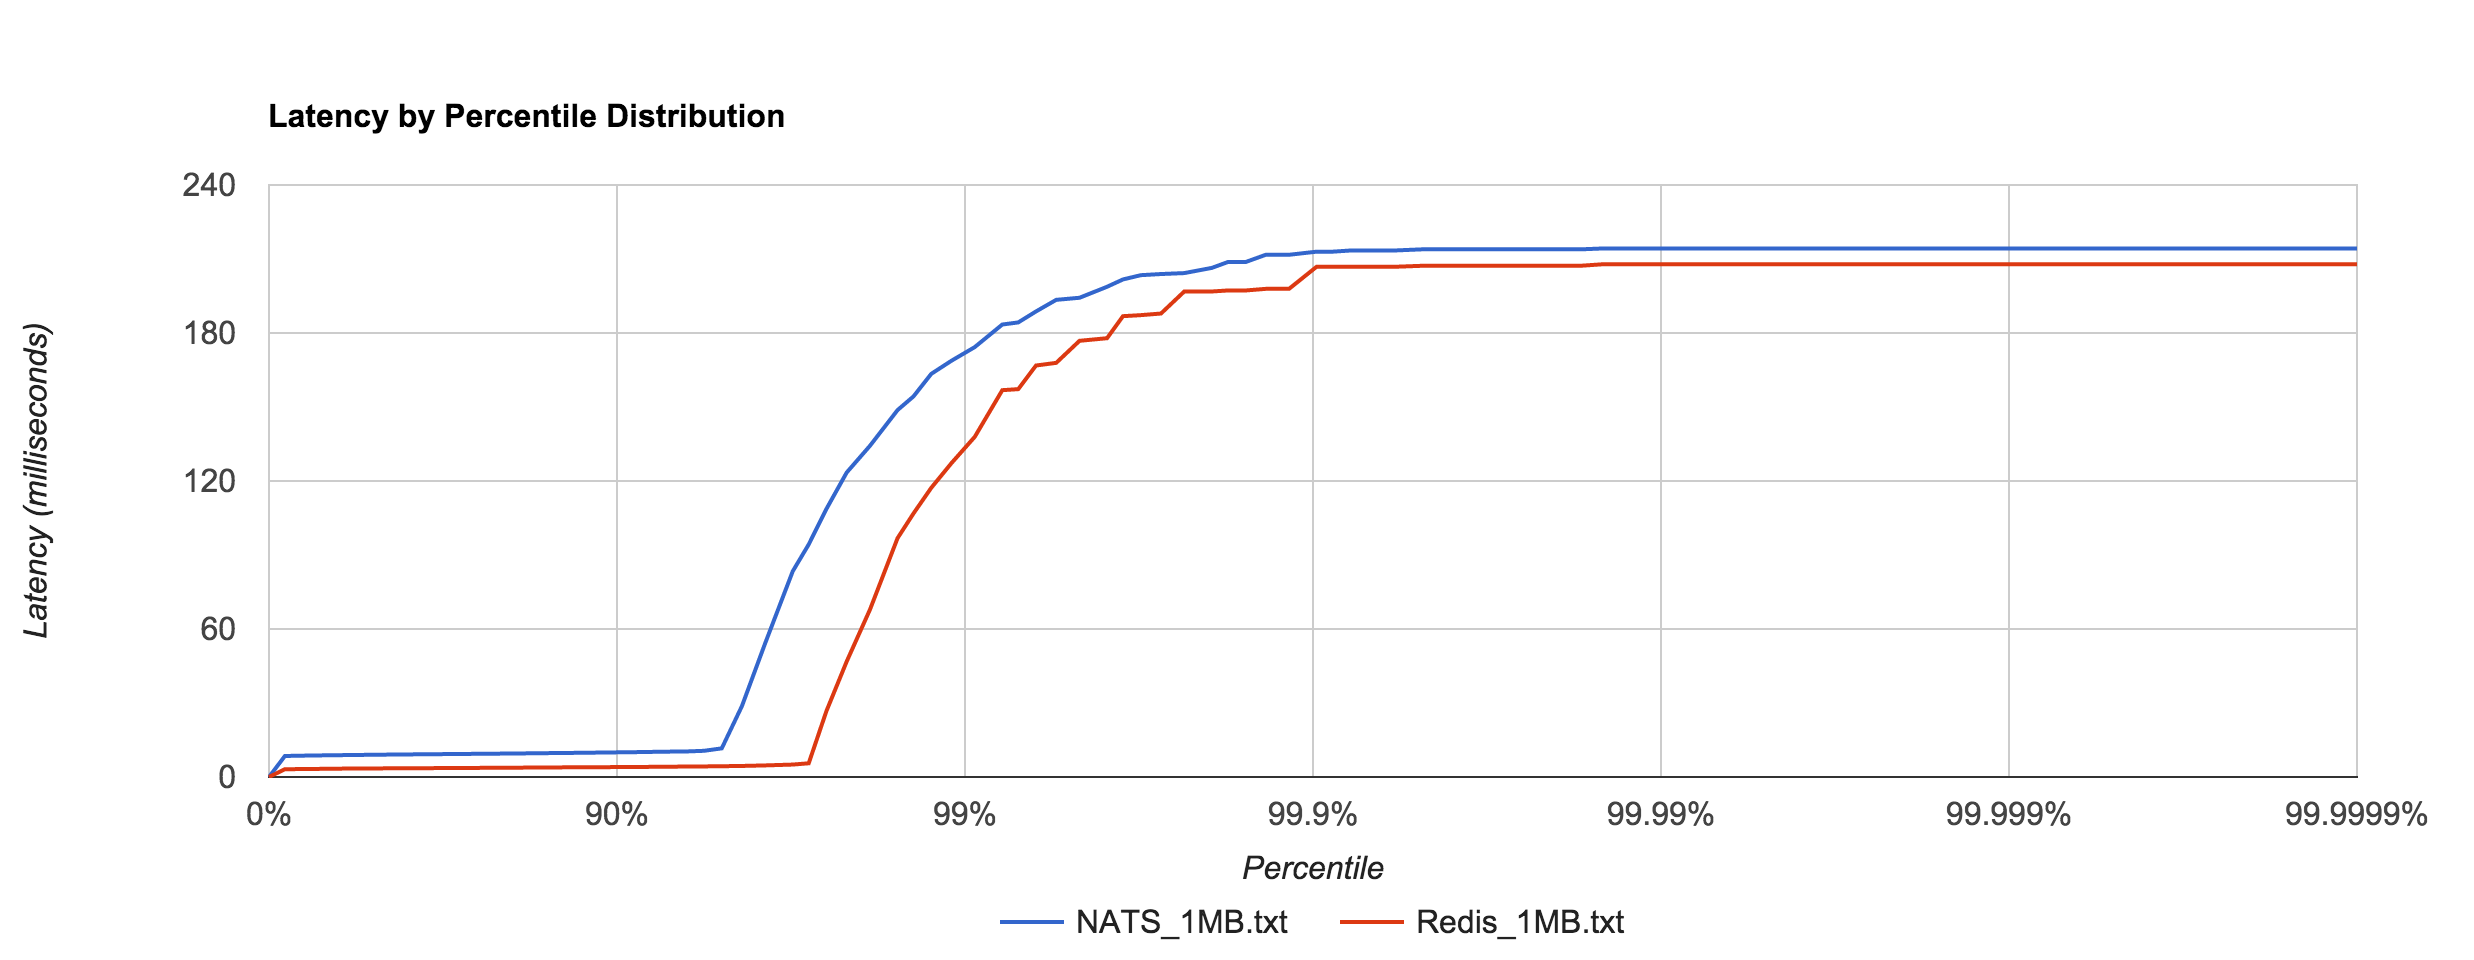
Large messages (1MB) don’t hold up nearly as well, exhibiting large tail latencies starting around the 95th and 97th percentiles in NATS and Redis, respectively. 1MB is the default maximum message size in NATS. The latency peaks around 214 ms. Again, keep in mind these are synchronous, roundtrip latencies.

Redis_NATS_1MB_latency

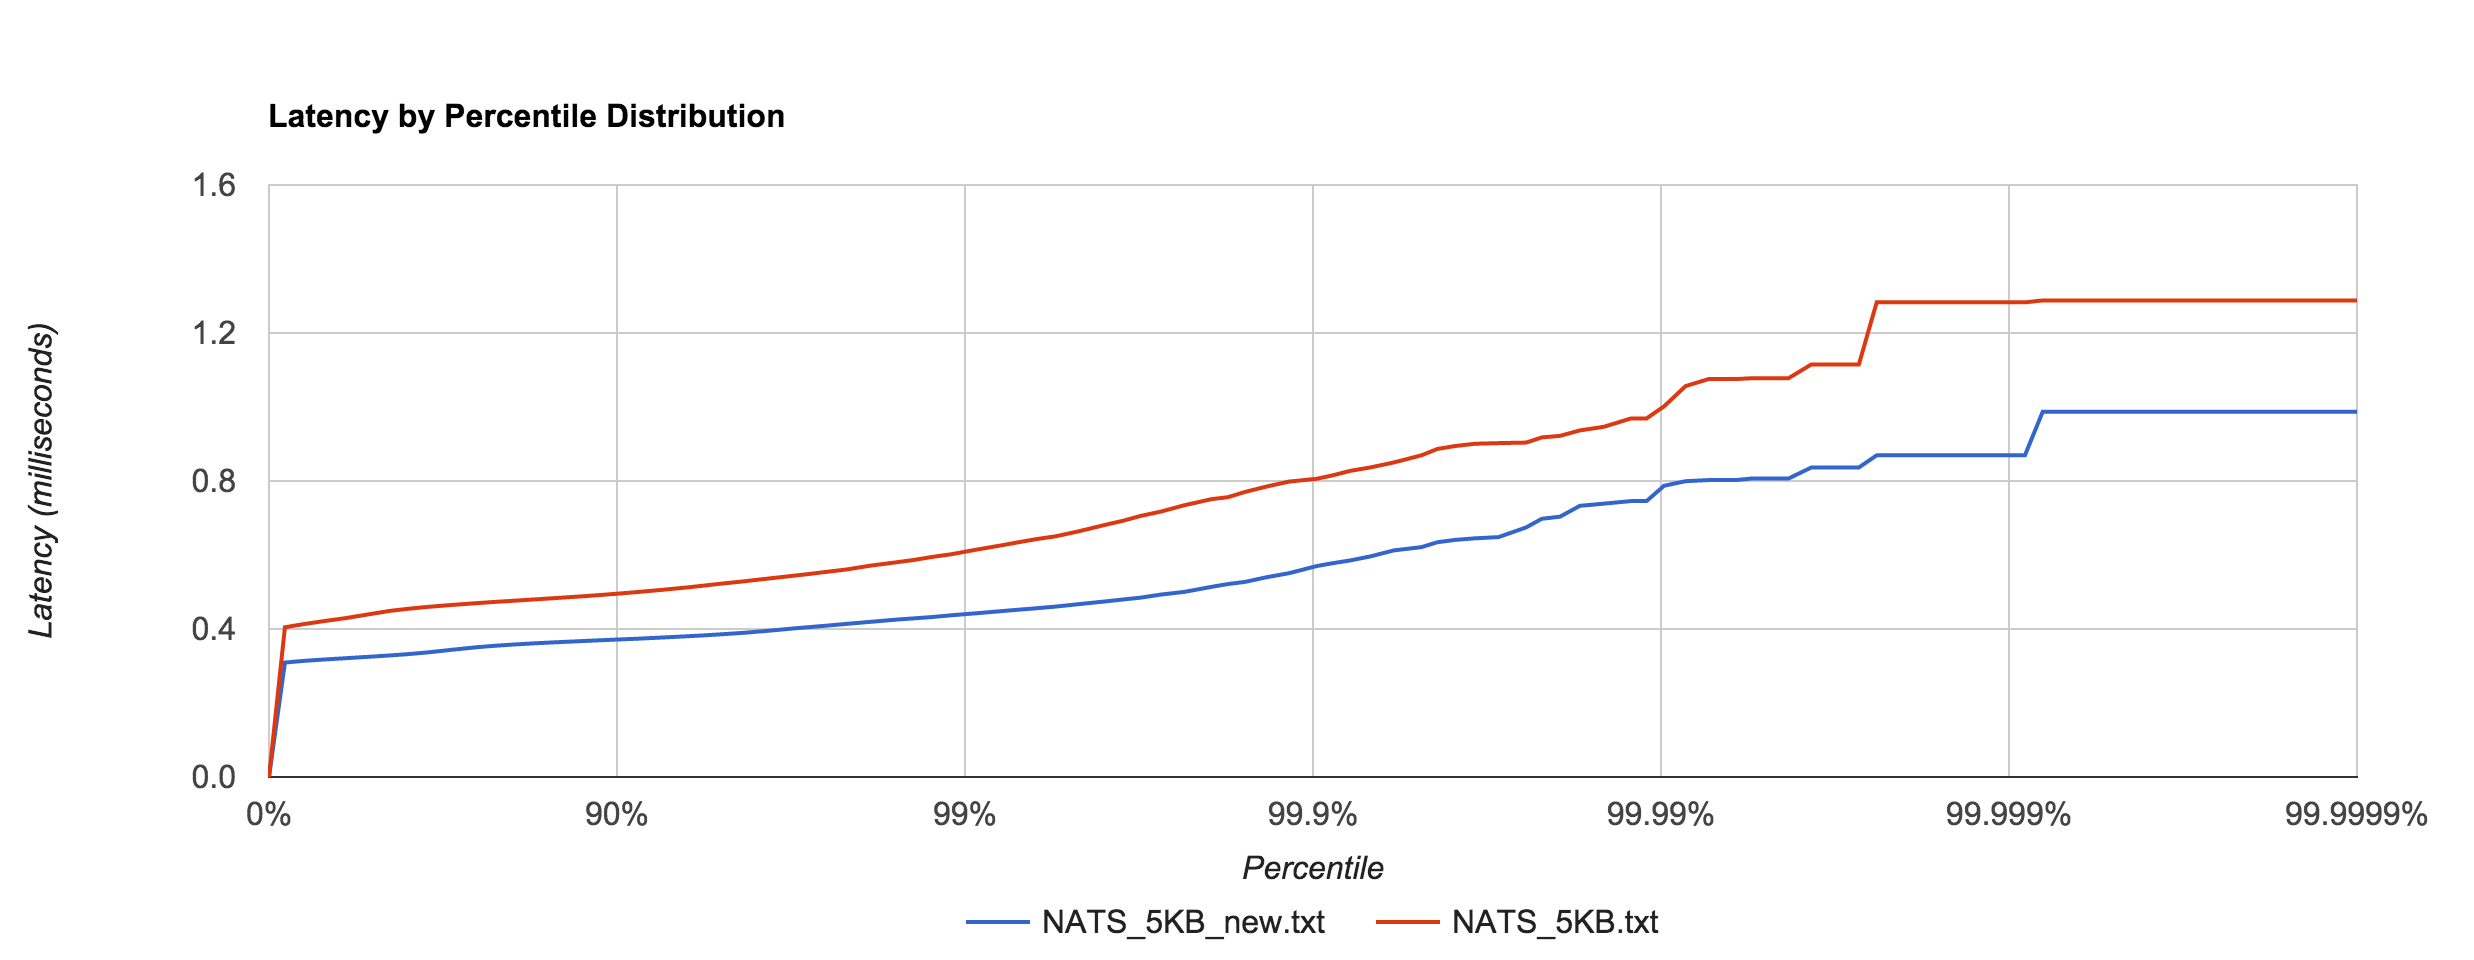
Apcera’s Ivan Kozlovic pointed out that the version of the NATS client I was using didn’t include a recent performance optimization. Before, the protocol parser scanned over each byte in the payload, but the newer version skips to the end (the previous benchmarks were updated to use the newer version). The optimization does have a noticeable effect, illustrated below. There was about a 30% improvement with the 5KB latencies.

NATS_optimization_latency

The difference is even more pronounced in the 1MB case, which has roughly a 90% improvement up to the 90th percentile. The linear scale in the graph below hides this fact, but at the 90th percentile, for example, the pre-optimization latency is 10 ms and the optimized latency is 3.8 ms. Clearly, the large tail is mostly unaffected, however.

NATS_1MB_optimization_latency

In general, this shows that NATS and Redis are better suited to smaller messages (well below 1MB), in which latency tends to be sub-millisecond up to four nines.

RabbitMQ and Kafka

RabbitMQ is a popular AMQP implementation. Unlike NATS, it’s a more traditional message queue in the sense that it supports binding queues and transactional-delivery semantics. Consequently, RabbitMQ is a more “heavyweight” queuing solution and tends to pay an additional premium with latency. In this benchmark, non-durable queues were used. As a result, we should see reduced latencies since we aren’t going to disk.

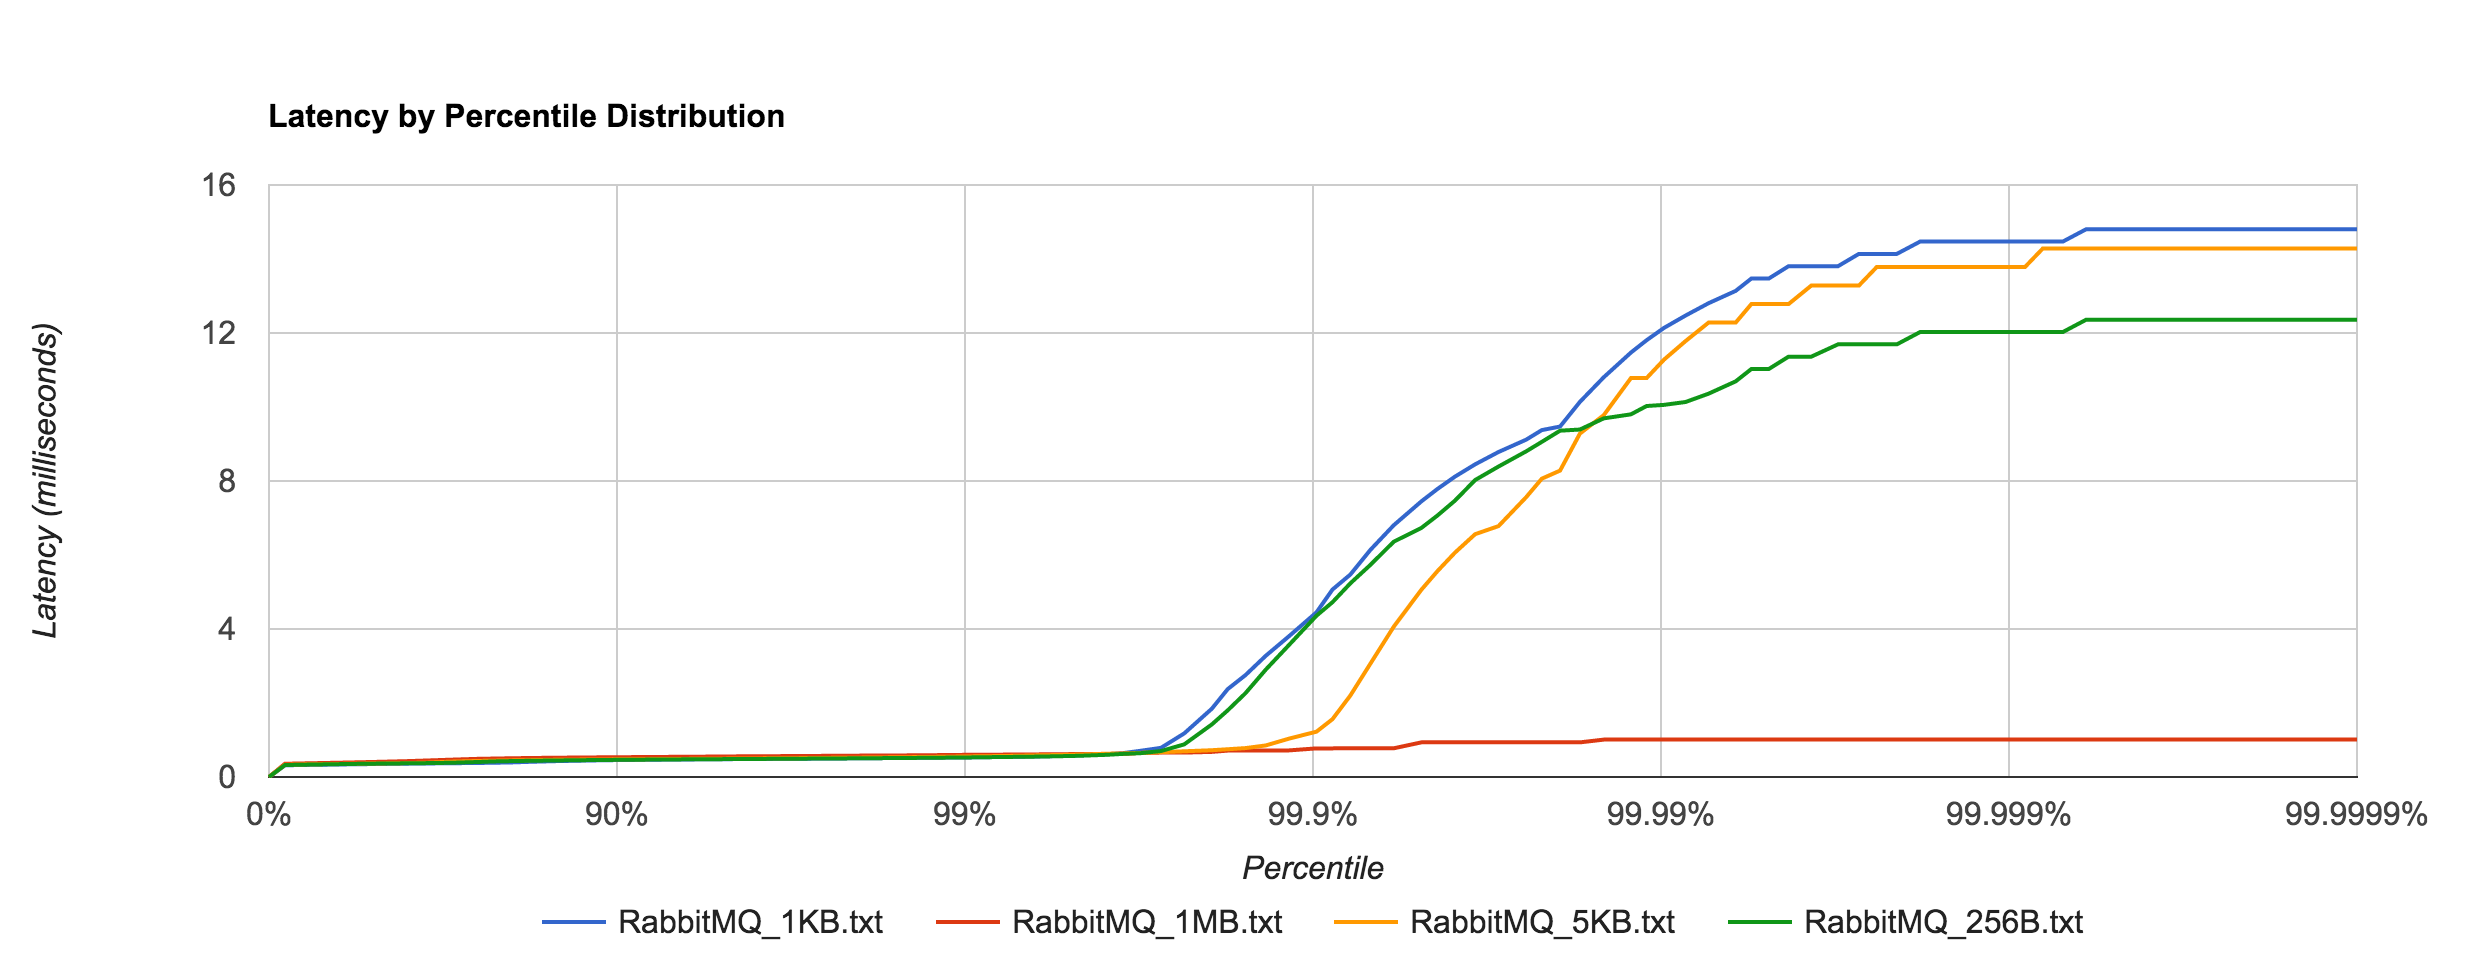
RabbitMQ_latency

Latency tends to be sub-millisecond up to the 99.7th percentile, but we can see that it doesn’t hold up to NATS beyond that point for the 1KB and 5KB payloads.

RabbitMQ_NATS_latency

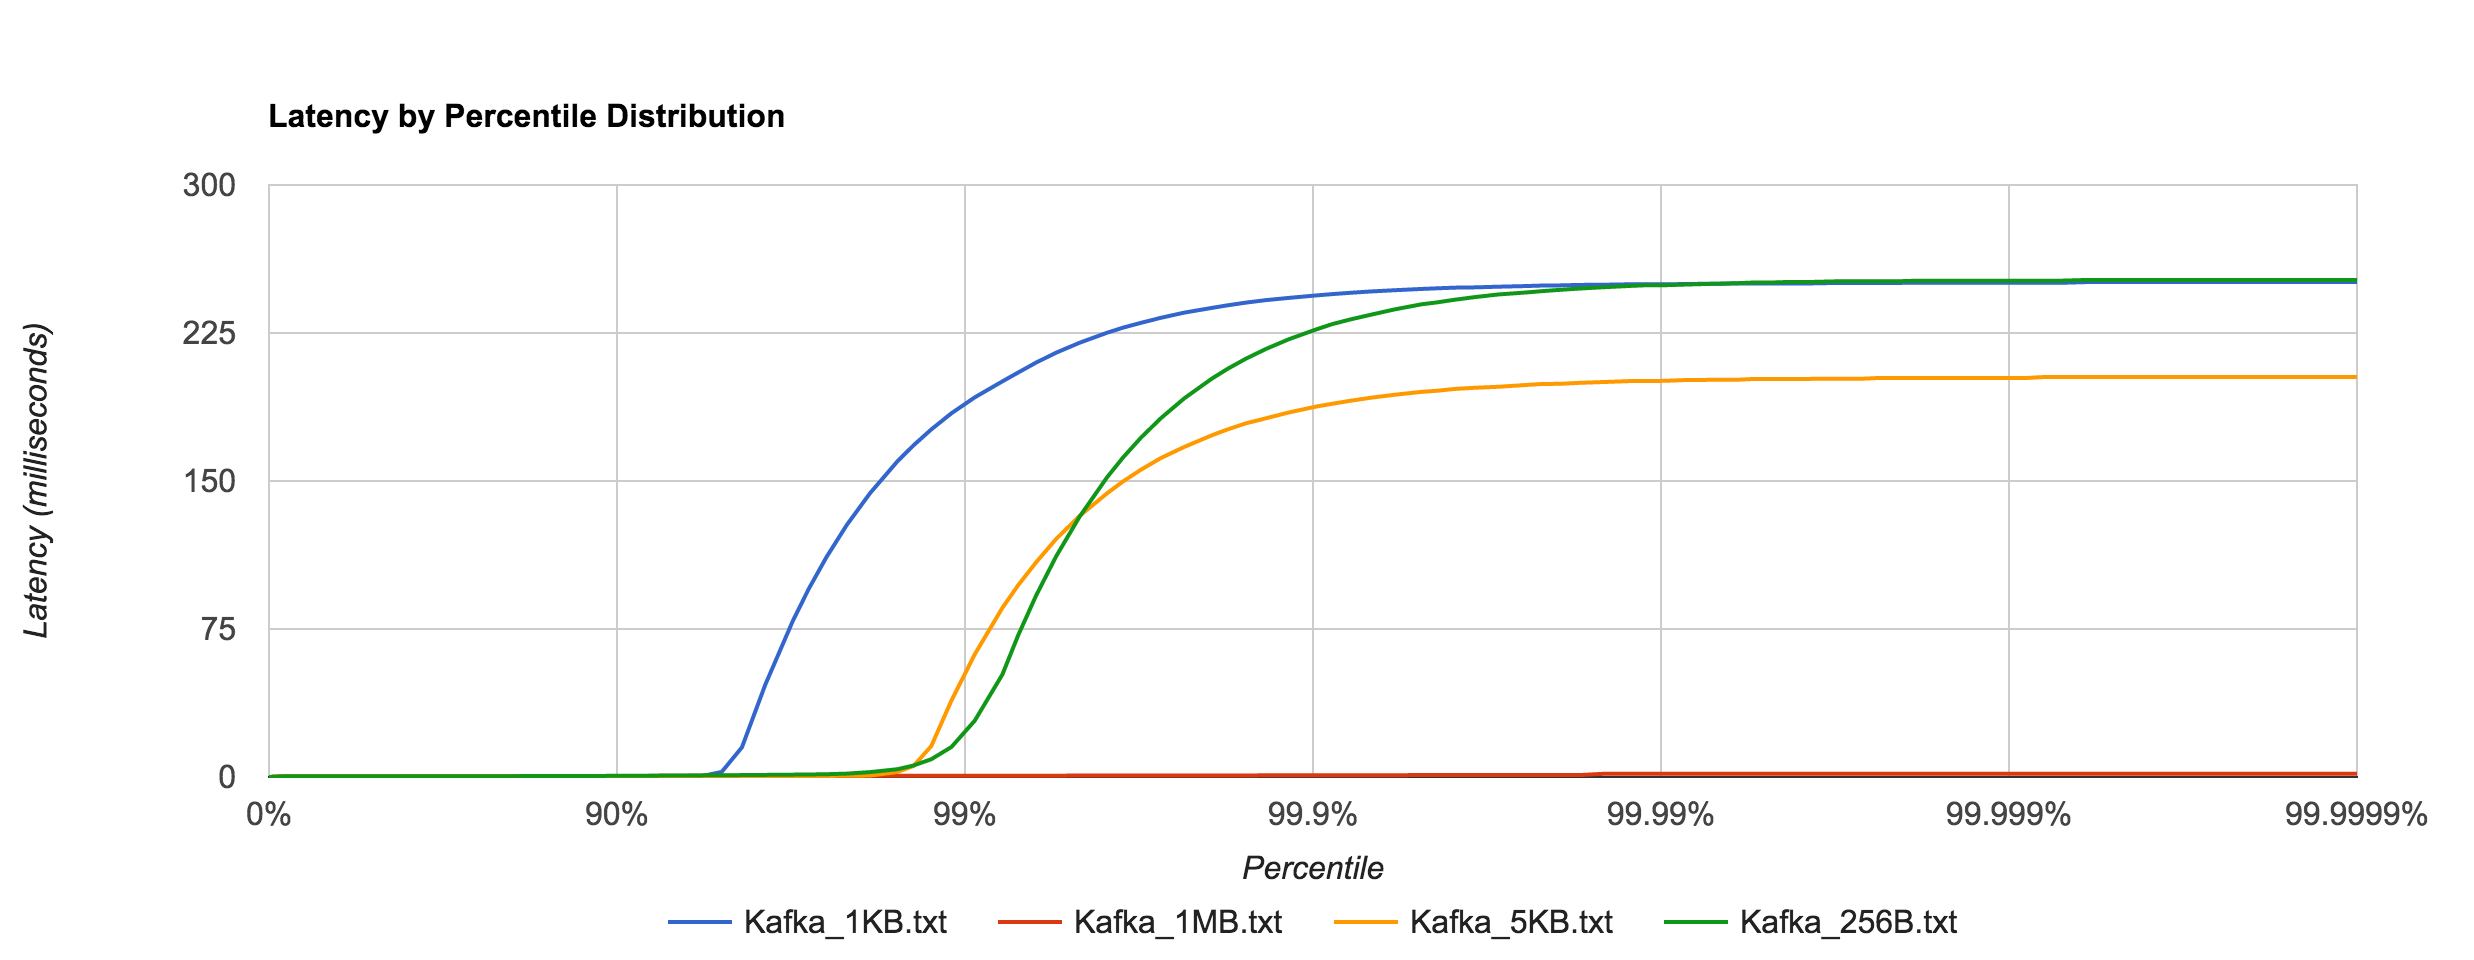
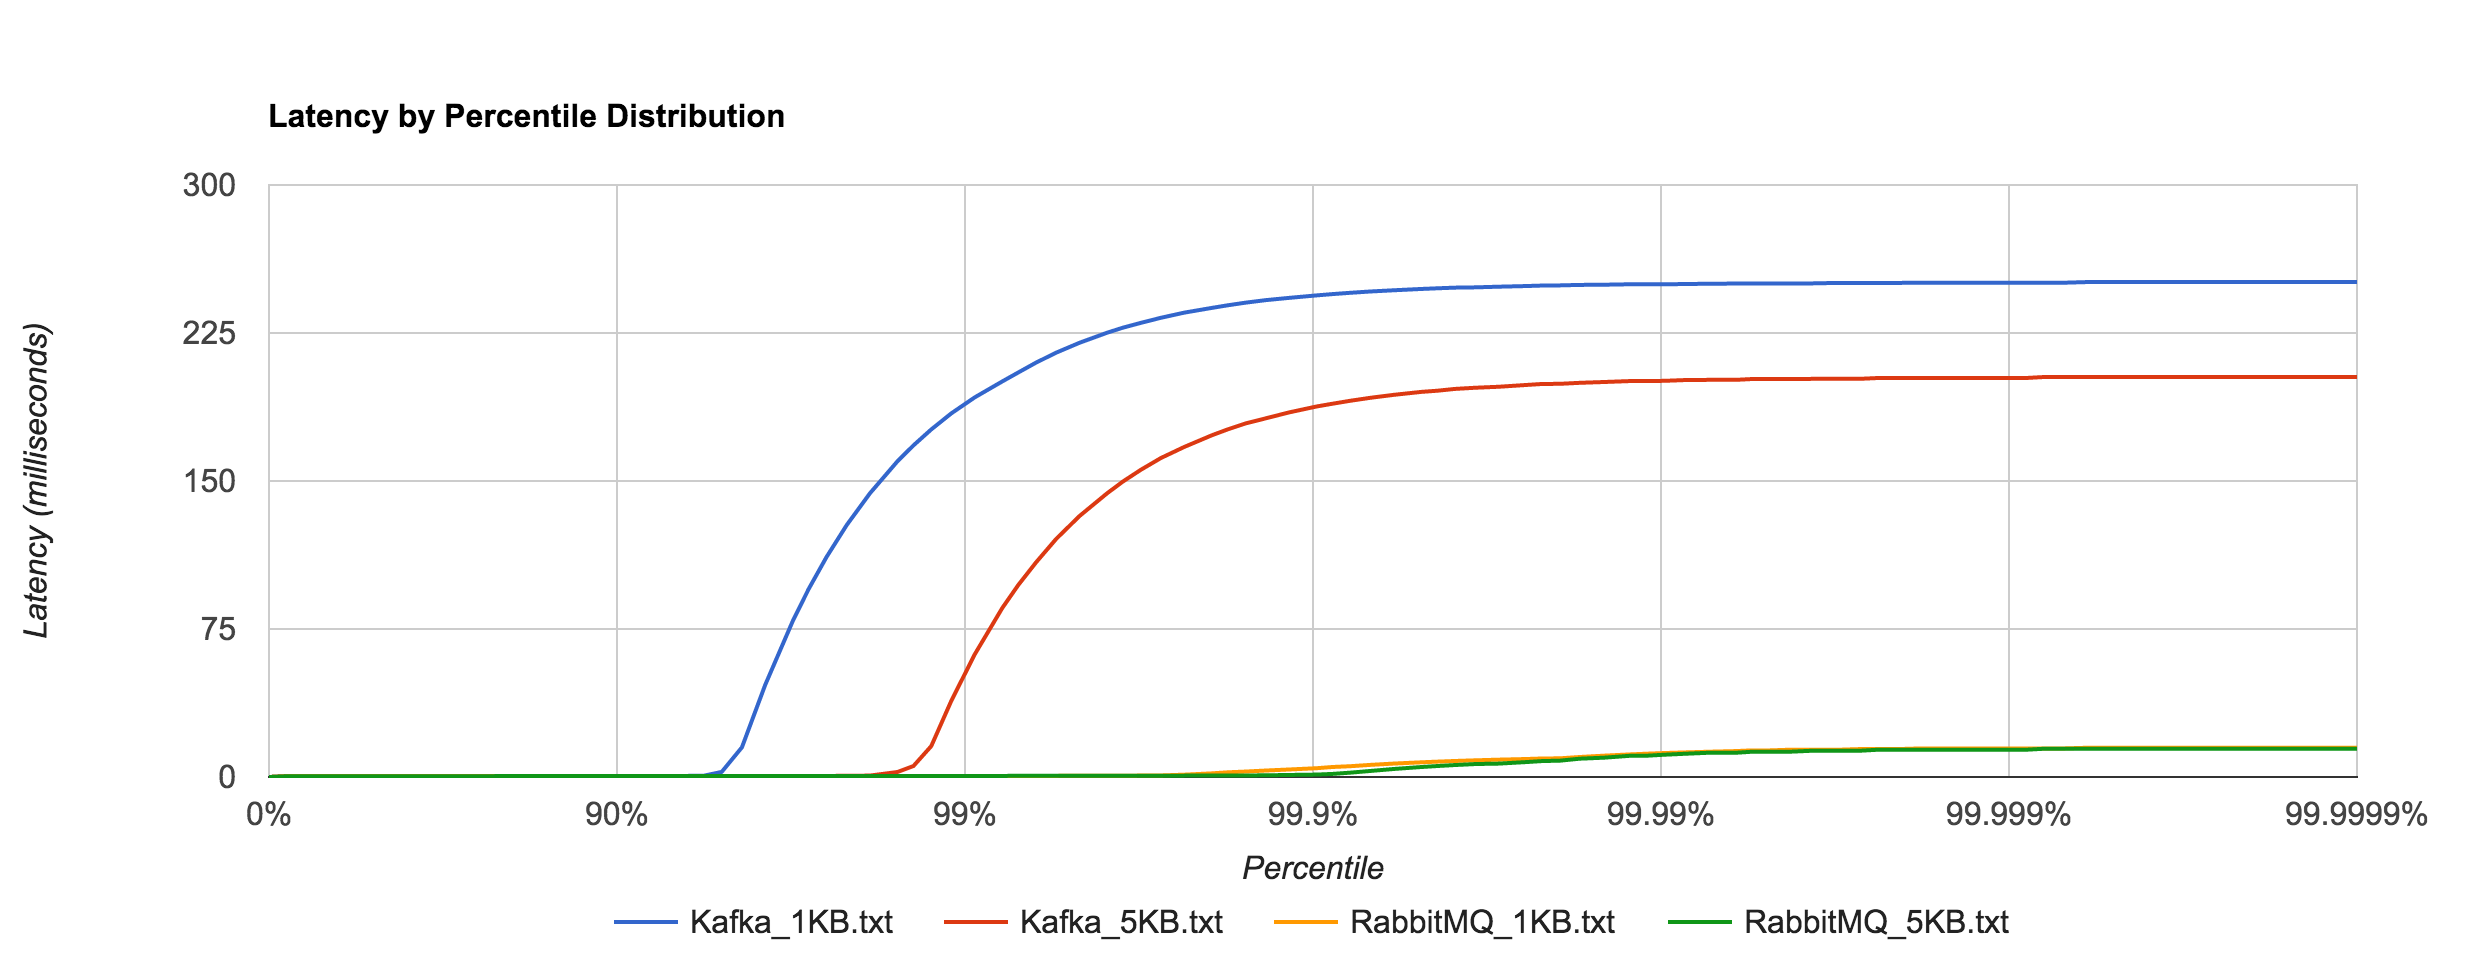
Kafka, on the other hand, requires disk persistence, but this doesn’t have a dramatic effect on latency until we look at the 94th percentile and beyond, when compared to RabbitMQ. Writes should be to page cache with flushes to disk happening asynchronously. The graphs below are for 0.8.2.2.

Kafka_latency

RabbitMQ_Kafka_latency

Once again, the 1KB, 20,000 requests/sec run is distributed across 25 concurrent connections. With RabbitMQ, we see the dramatic increase in tail latencies as we did with Redis and NATS. The RabbitMQ latencies in the concurrent case stay in line with the previous latencies up to about the 99th percentile. Interestingly, Kafka, doesn’t appear to be significantly affected. The latencies of 20,000 requests/sec at 1KB per request are not terribly different than the latencies of 3,000 requests/sec at 1KB per request, both peaking around 250 ms.

RabbitMQ_Kafka_1KB_20000_latency

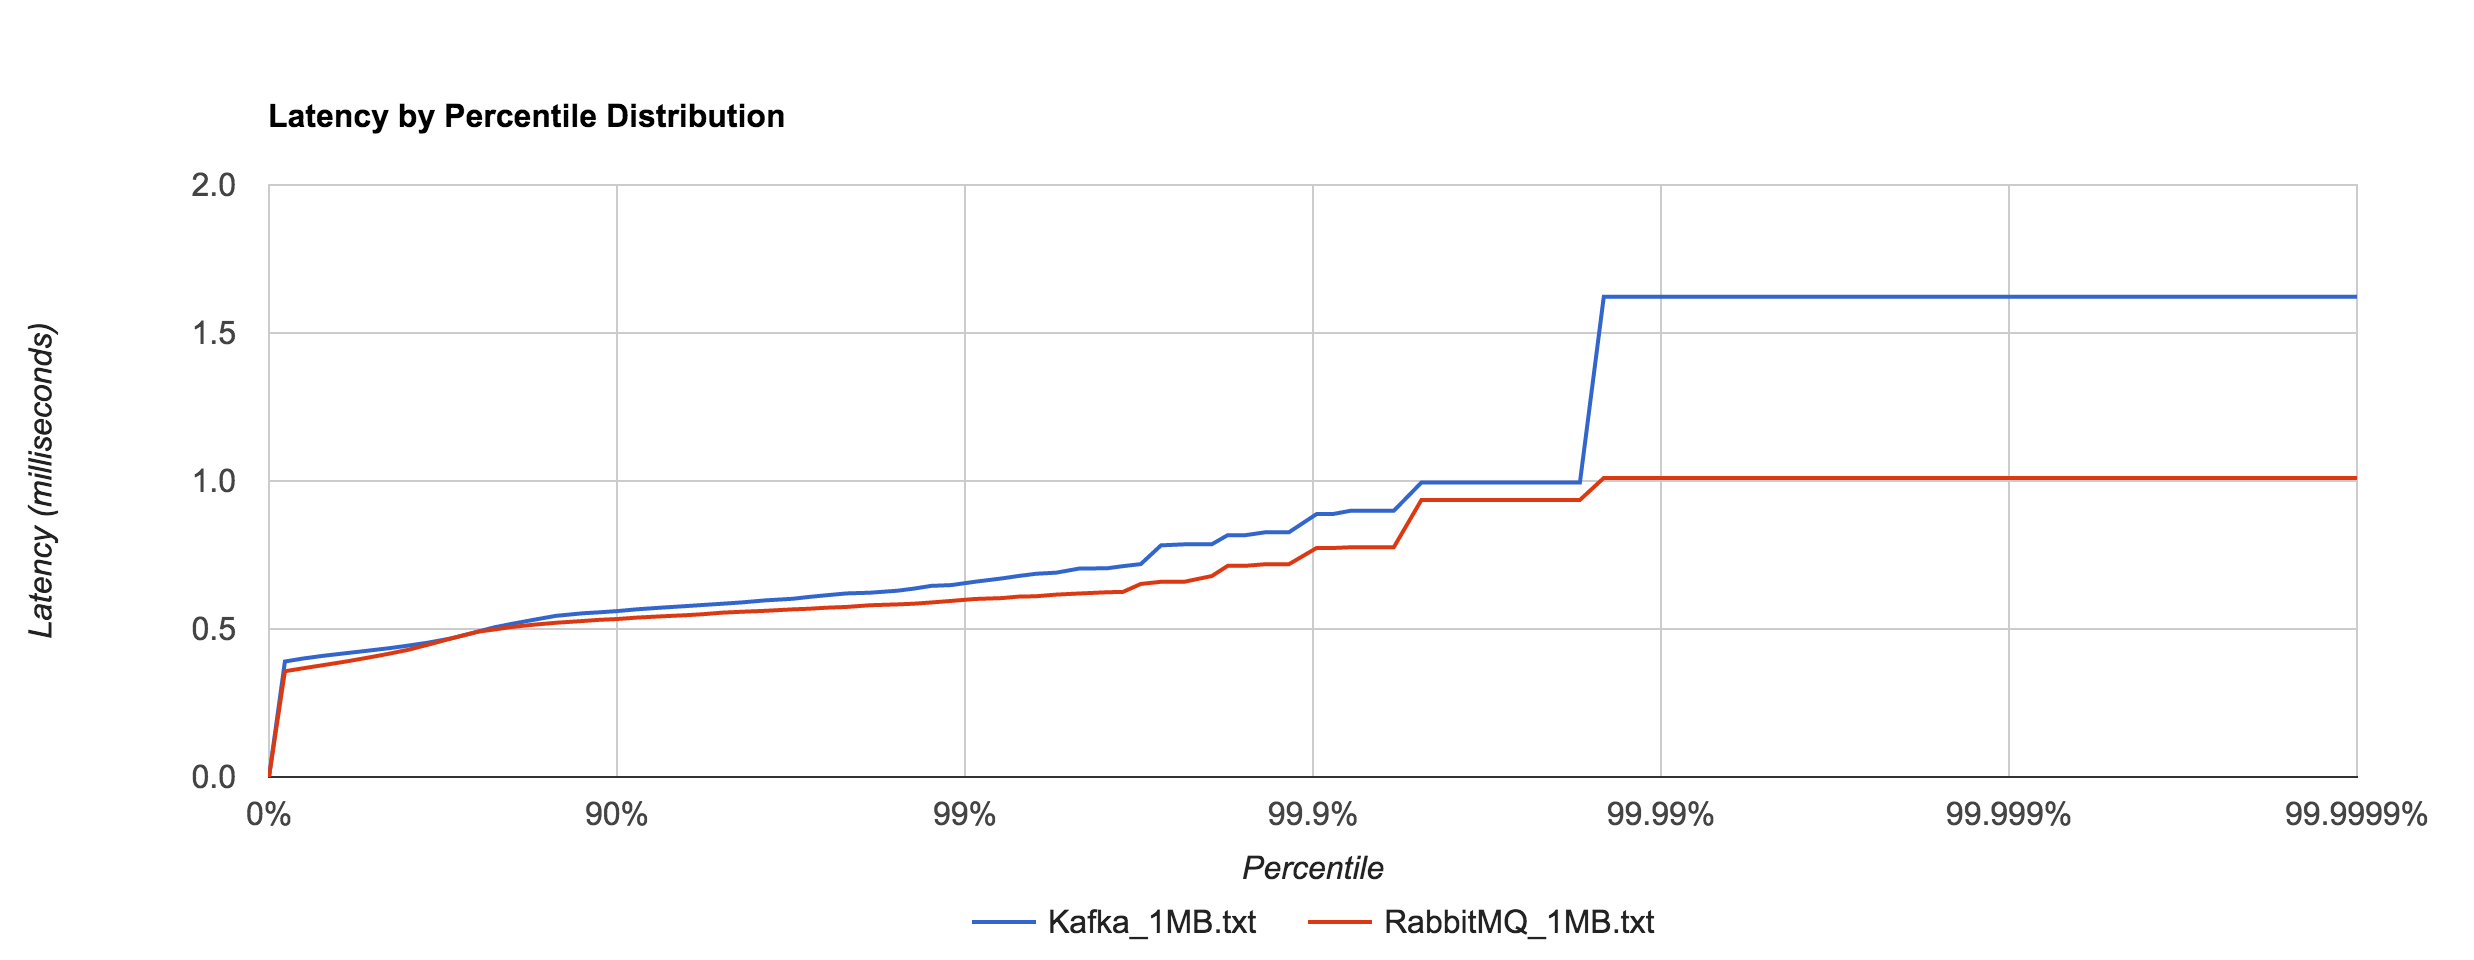
What’s particularly interesting is the behavior of 1MB messages vs. the rest. With RabbitMQ, there’s almost a 14x difference in max latencies between the 5KB and 1MB runs with 1MB being the faster. With Kafka 0.8.2.2, the difference is over 126x in the same direction. We can plot the 1MB latencies for RabbitMQ and Kafka since it’s difficult to discern them with a linear scale.

RabbitMQ_Kafka_1MB_latency

tried to understand what was causing this behavior. I’ve yet to find a reasonable explanation for RabbitMQ. Intuition tells me it’s a result of buffering—either at the OS level or elsewhere—and the large messages cause more frequent flushing. Remember that these benchmarks were with transient publishes. There should be no disk accesses occurring, though my knowledge of Rabbit’s internals are admittedly limited. The fact that this behavior occurs in RabbitMQ and not Redis or NATS seems odd. Nagle’s algorithm is disabled in all of the benchmarks (TCP_NODELAY). After inspecting packets with Wireshark, it doesn’t appear to be a problem with delayed acks.

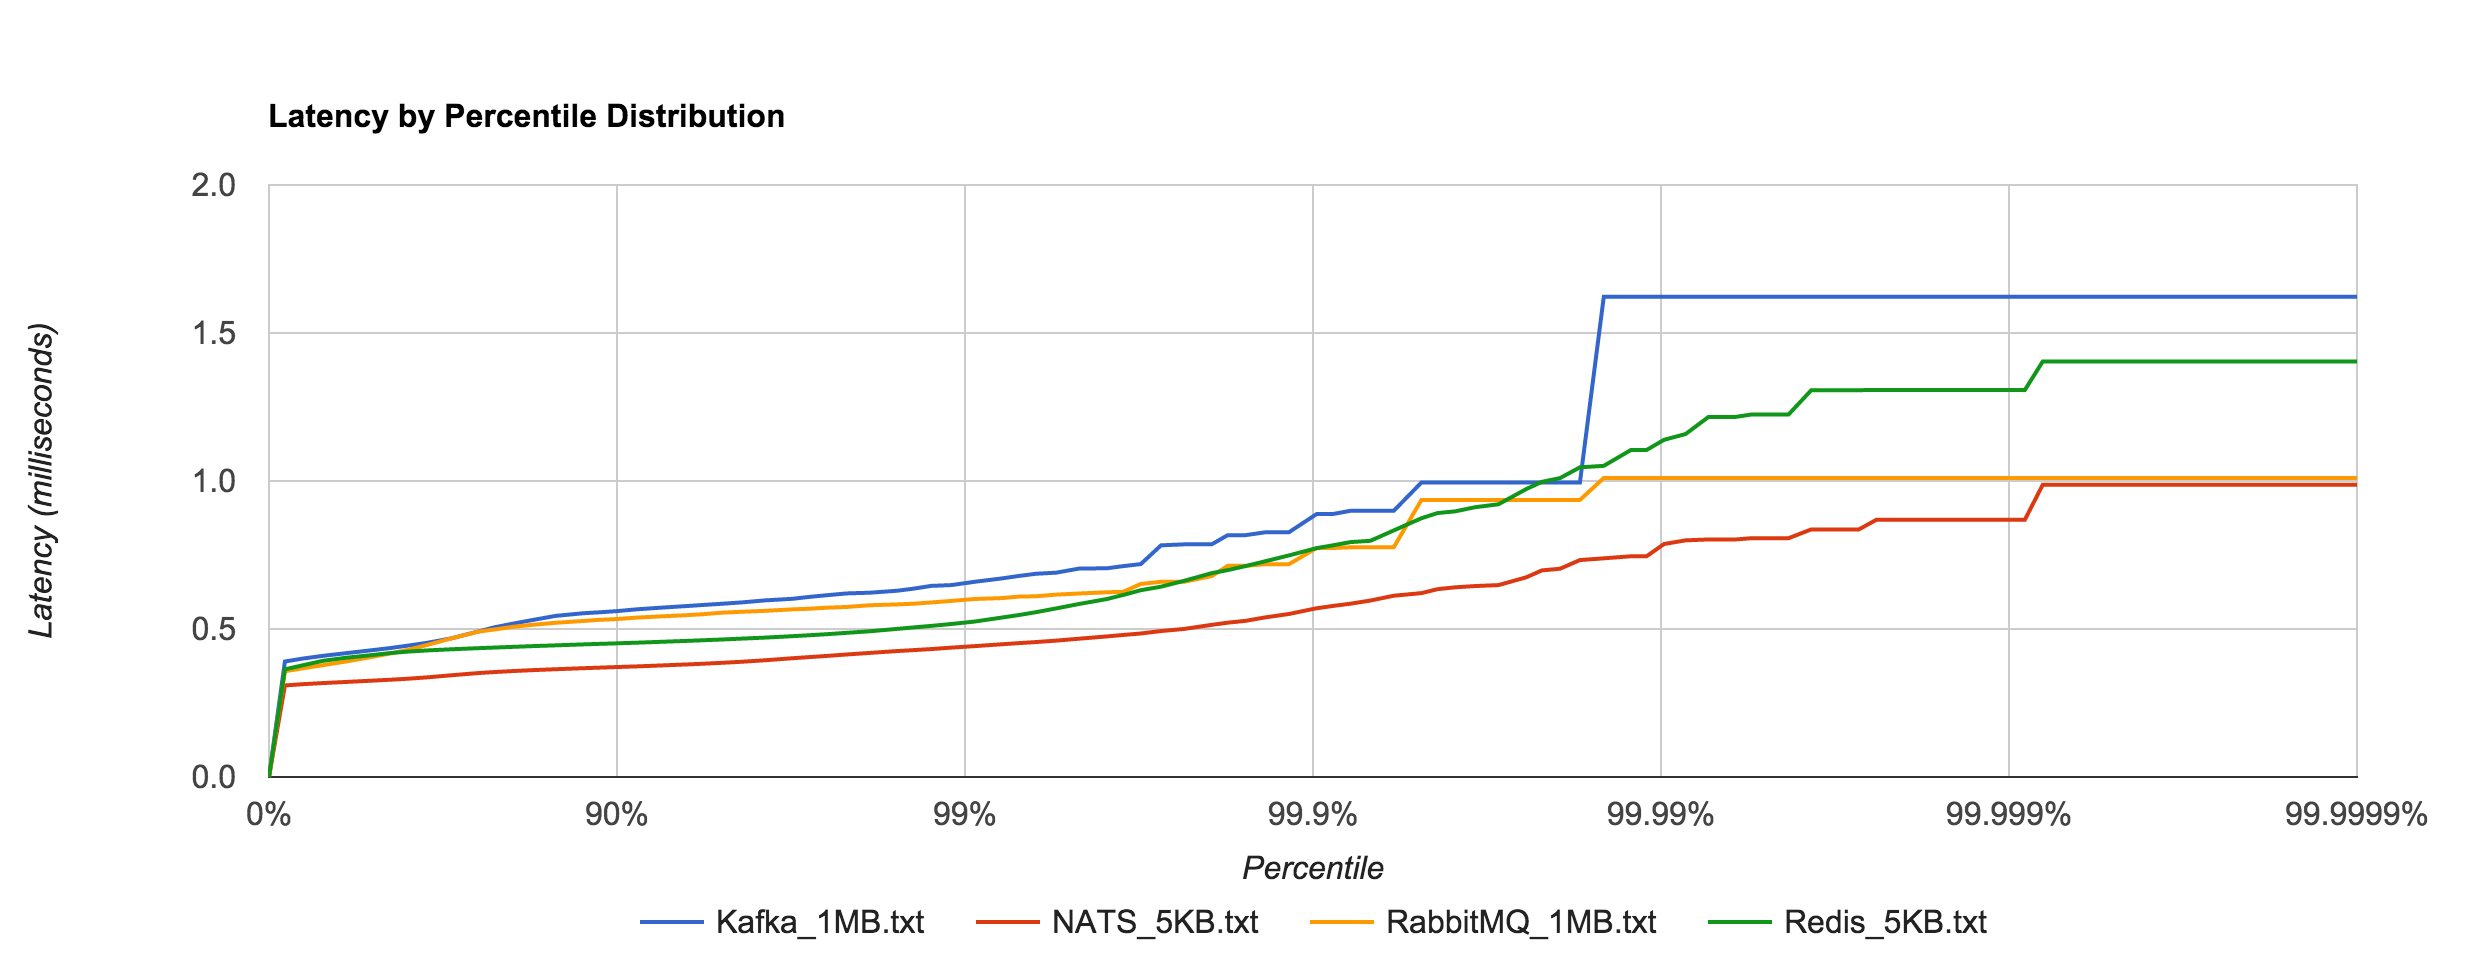
To show just how staggering the difference is, we can plot Kafka 0.8.2.2 and RabbitMQ 1MB latencies alongside Redis and NATS 5KB latencies. They are all within the same ballpark. Whatever the case may be, both RabbitMQ and Kafka appear to handle large messages extremely well in contrast to Redis and NATS.

RabbitMQ_Kafka_NATS_Redis_latency

This leads me to believe you’ll see better overall throughput, in terms of raw data, with RabbitMQ and Kafka, but more predictable, tighter tail latencies with Redis and NATS. Where SLAs are important, it’s hard to beat NATS. Of course, it’s unfair to compare Kafka with something like NATS or Redis or even RabbitMQ since they are very different (and sometimes complementary), but it’s also worth pointing out that the former is much more operationally complex.

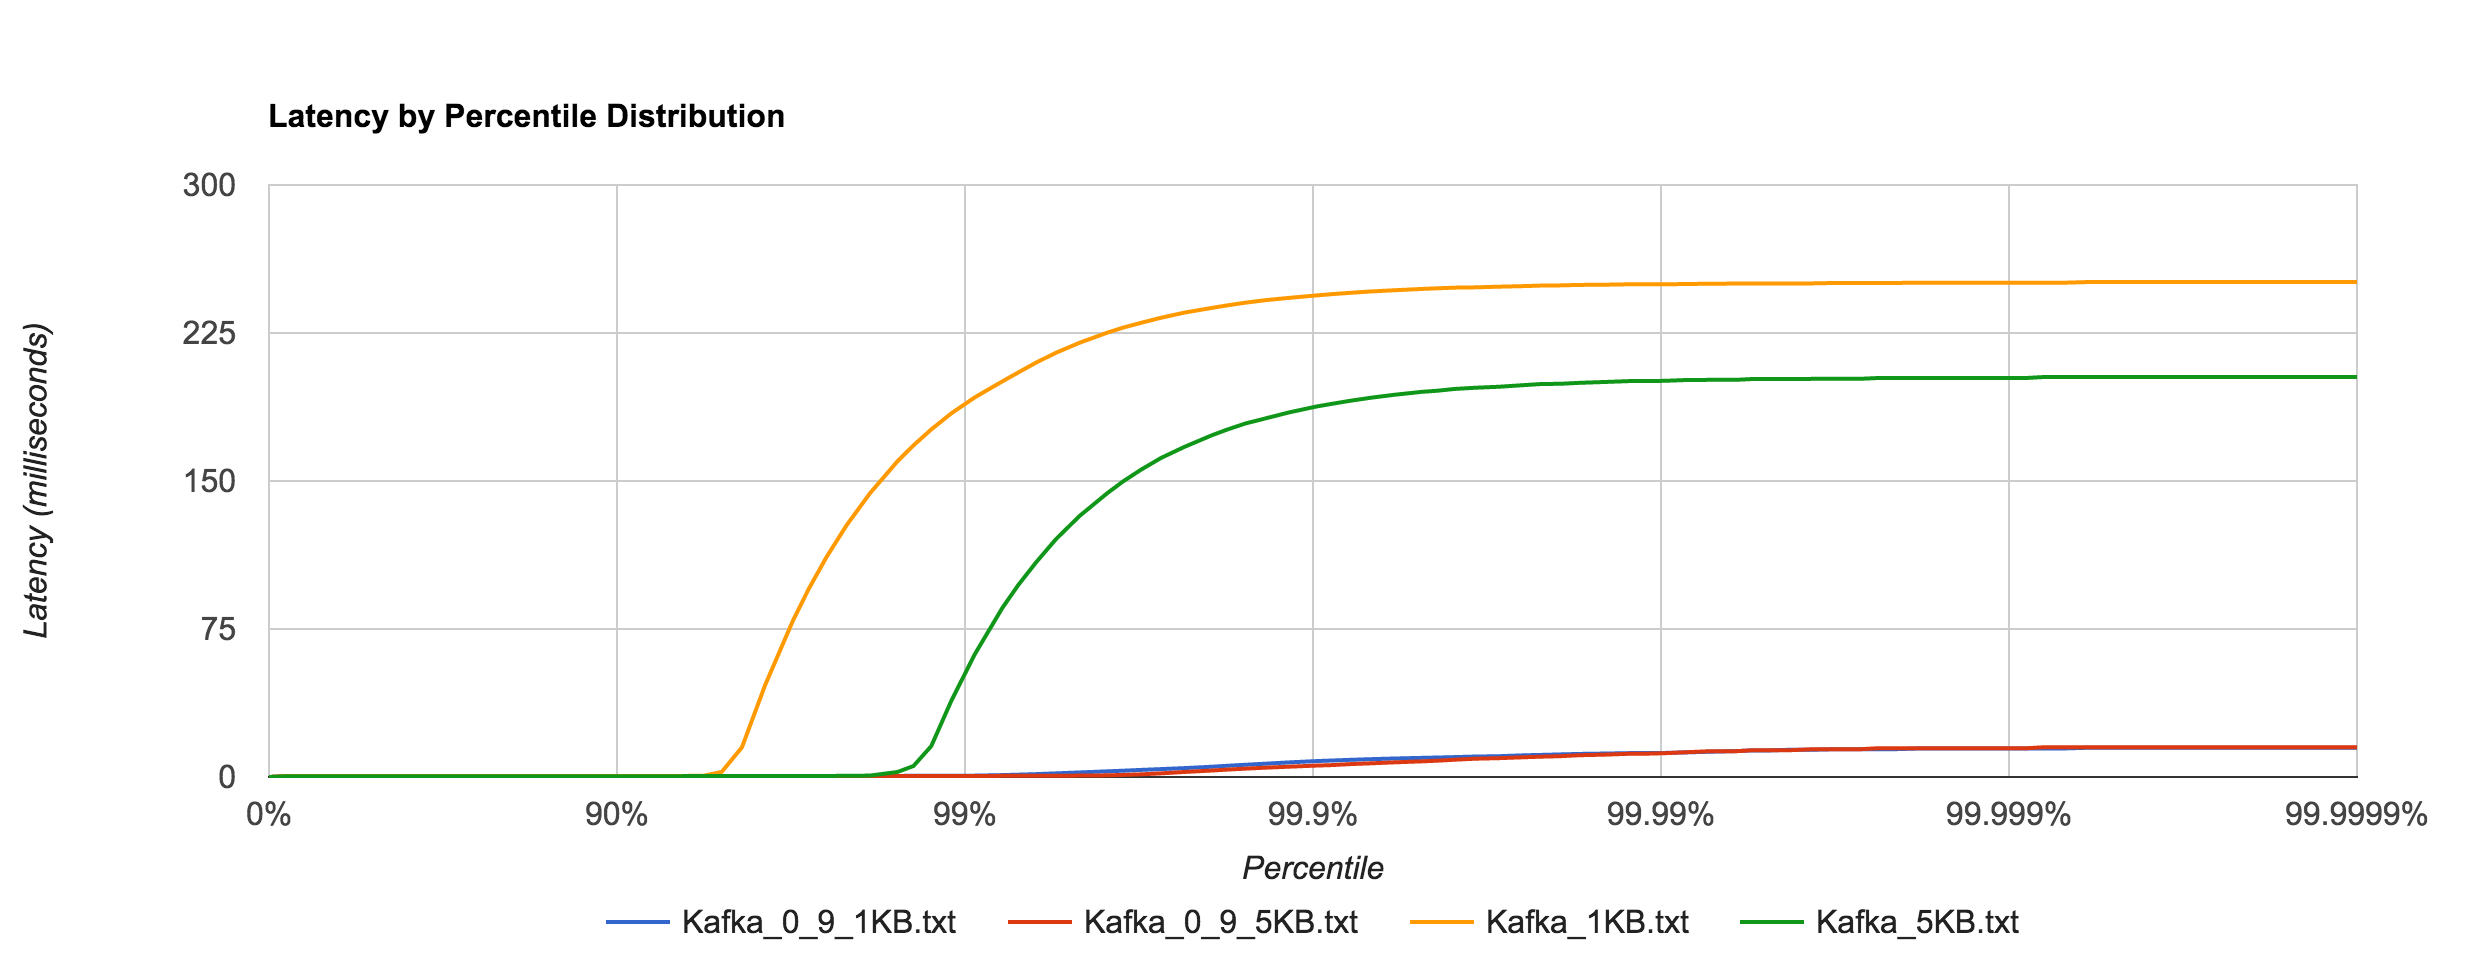
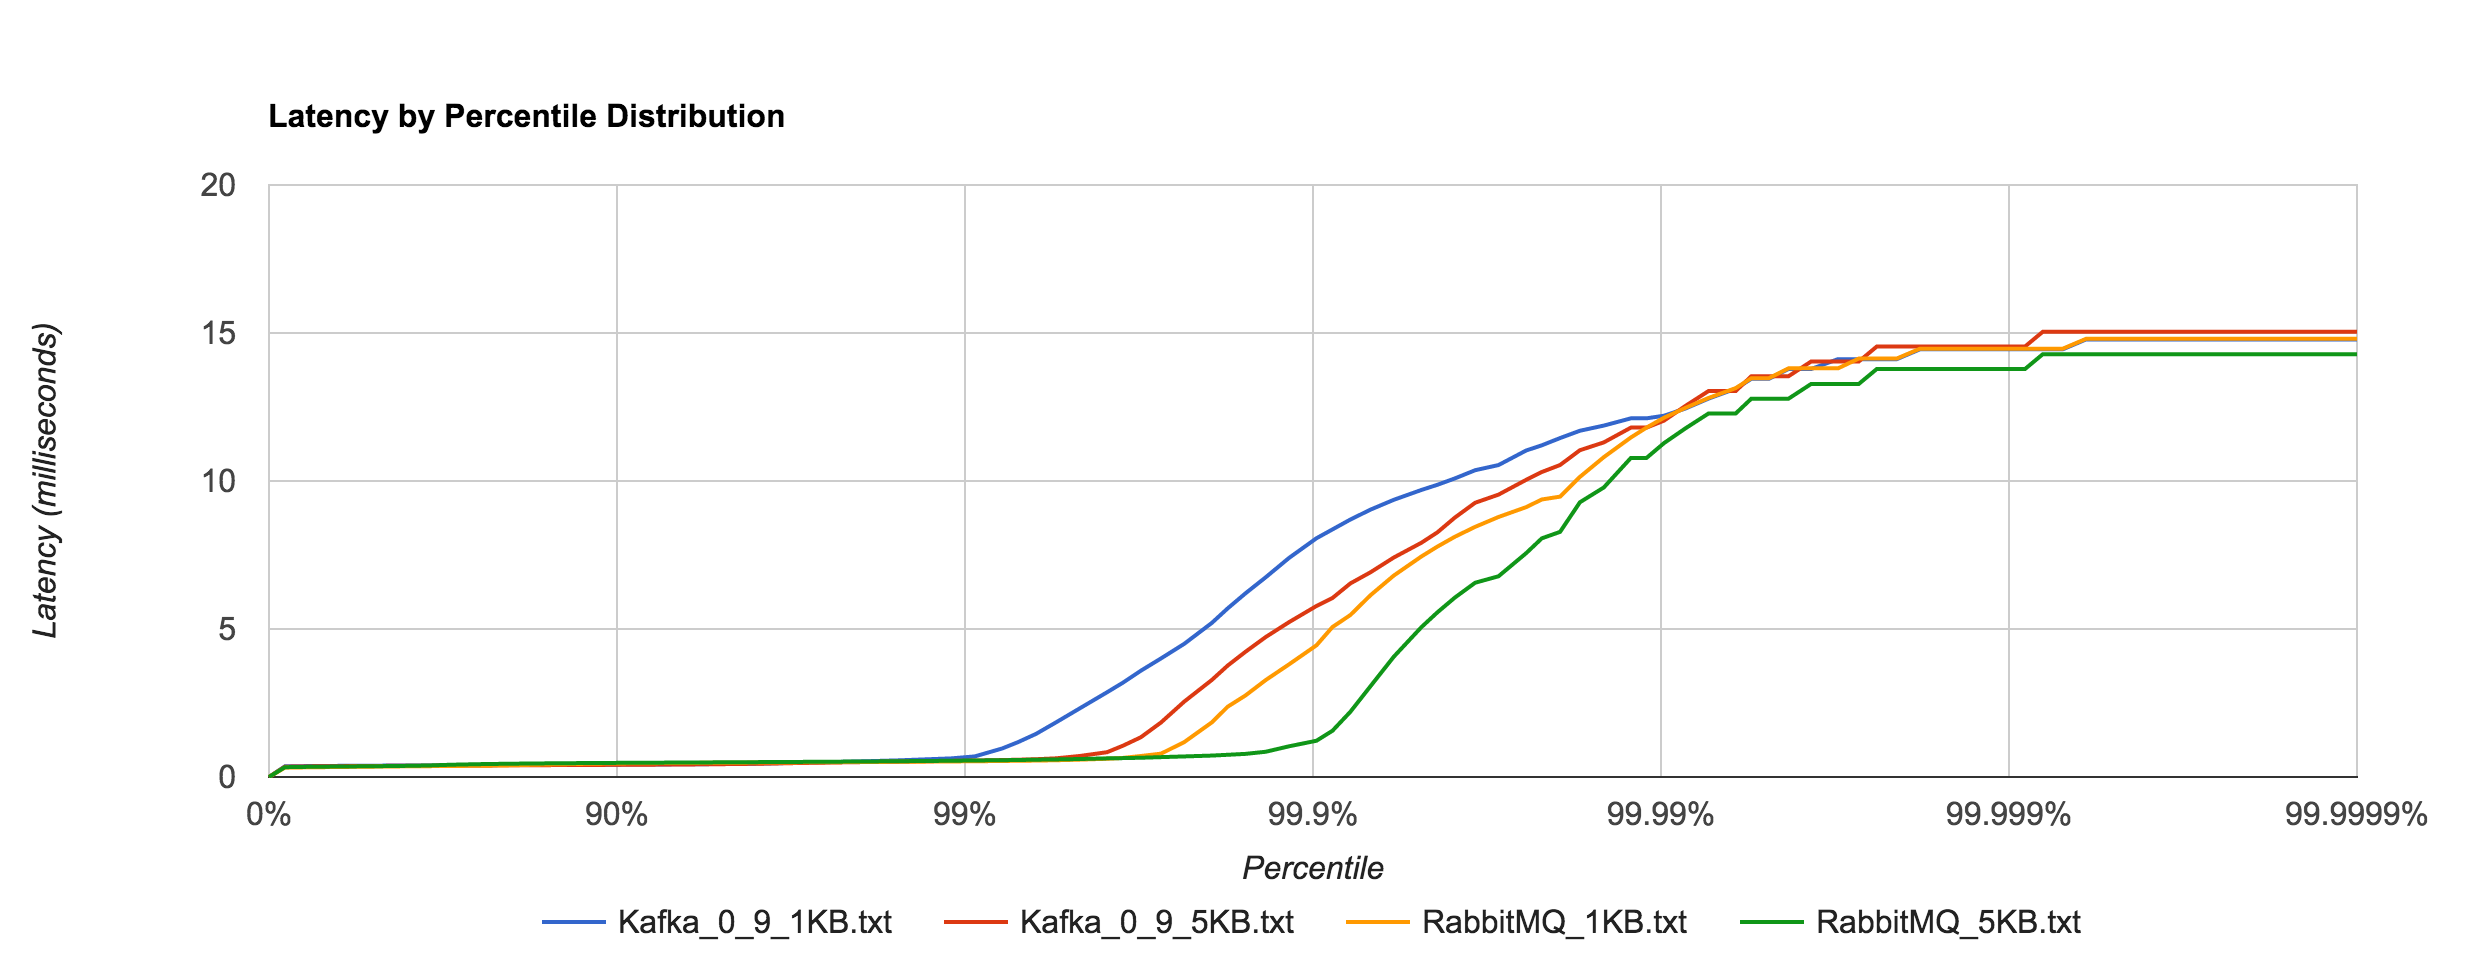
However, benchmarking Kafka 0.9.0.0 (blue and red) shows an astounding difference in tail latencies compared to 0.8.2.2 (orange and green).

Kafka_0_8_0_9_latency

Kafka 0.9’s performance is much more in line with RabbitMQ’s at high percentiles as seen below.

RabbitMQ_Kafka_0_9_latency

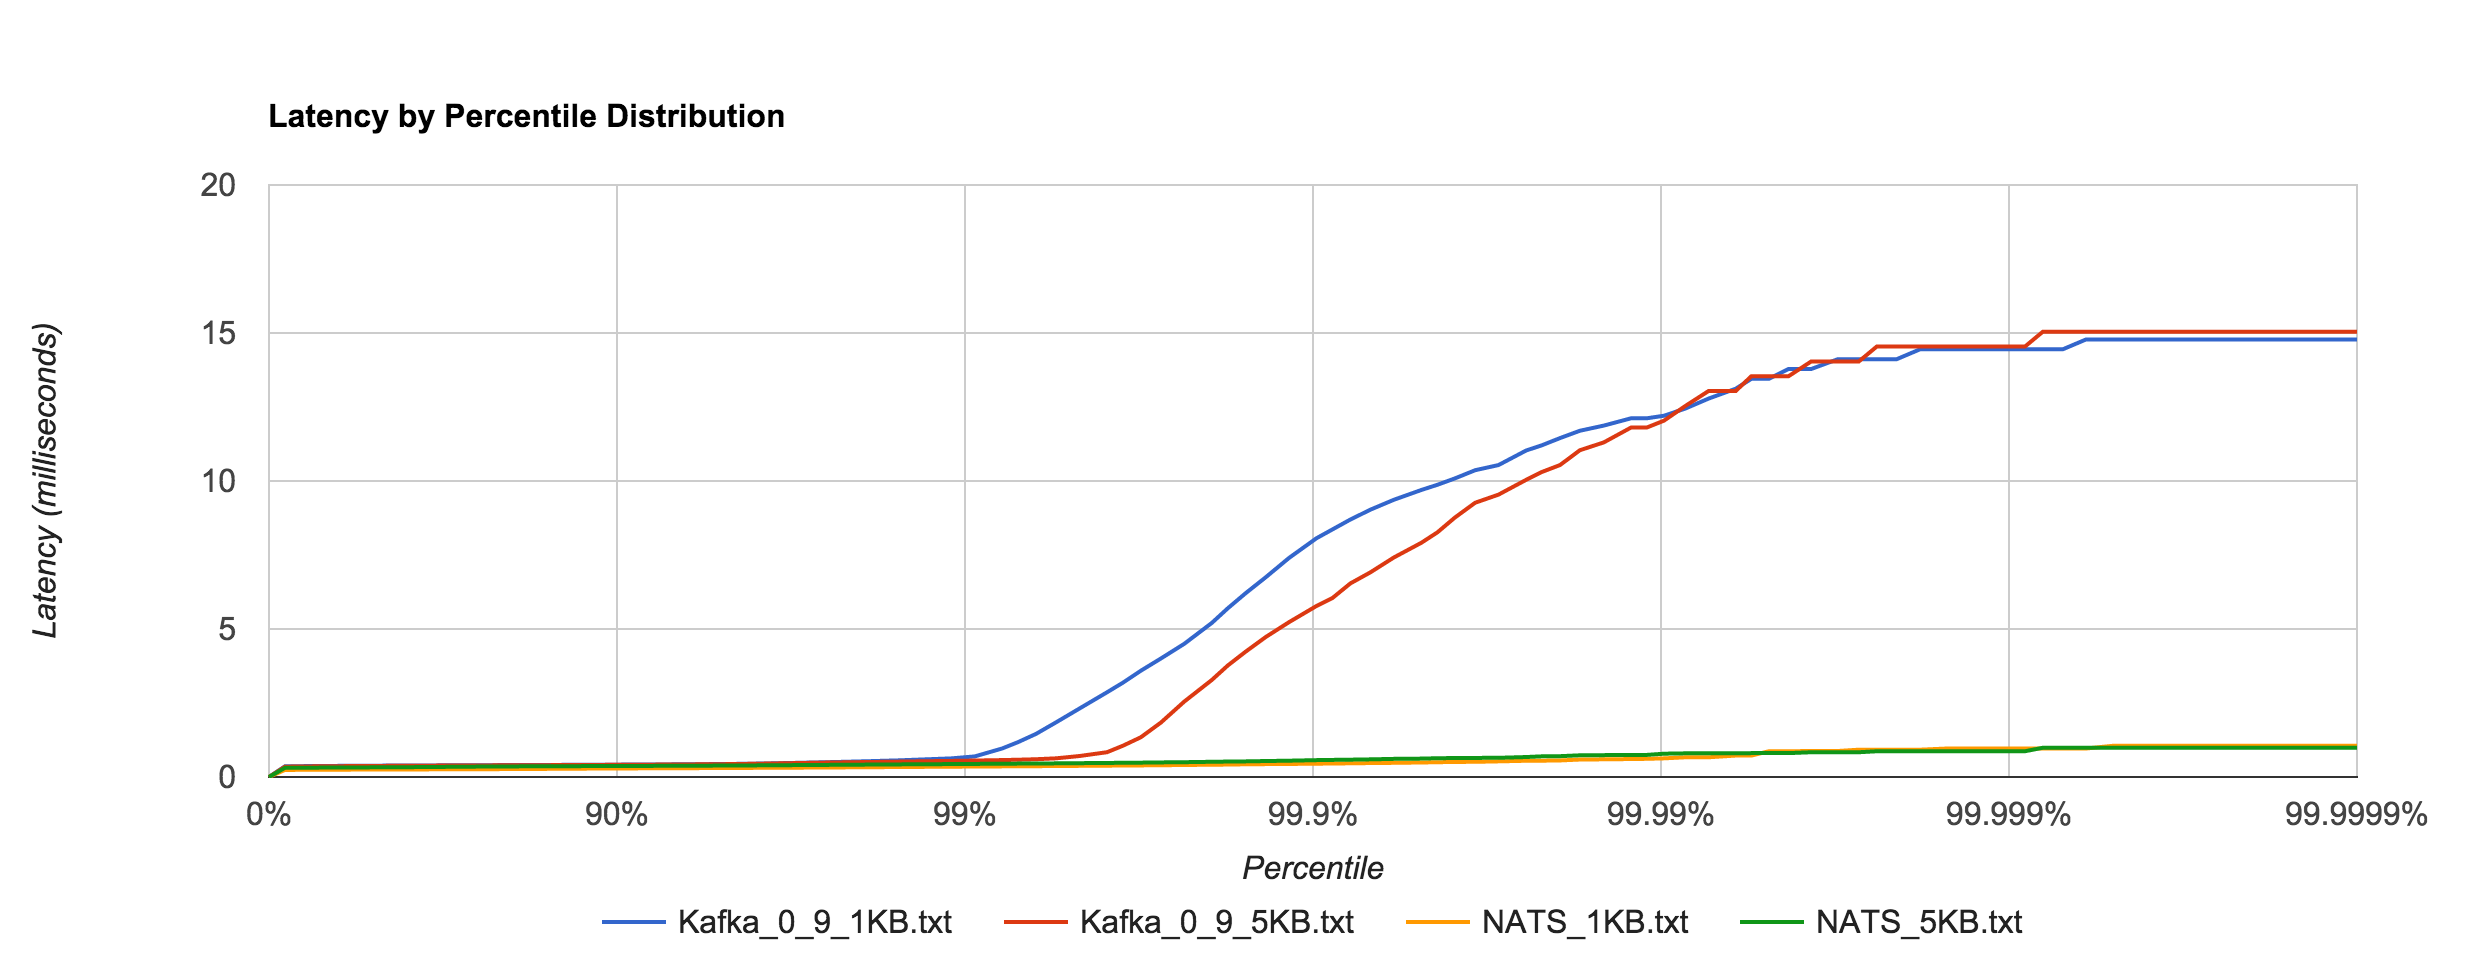
Likewise, it’s a much closer comparison to NATS when looking at the 1KB and 5KB runs.

Kafka_NATS_latency

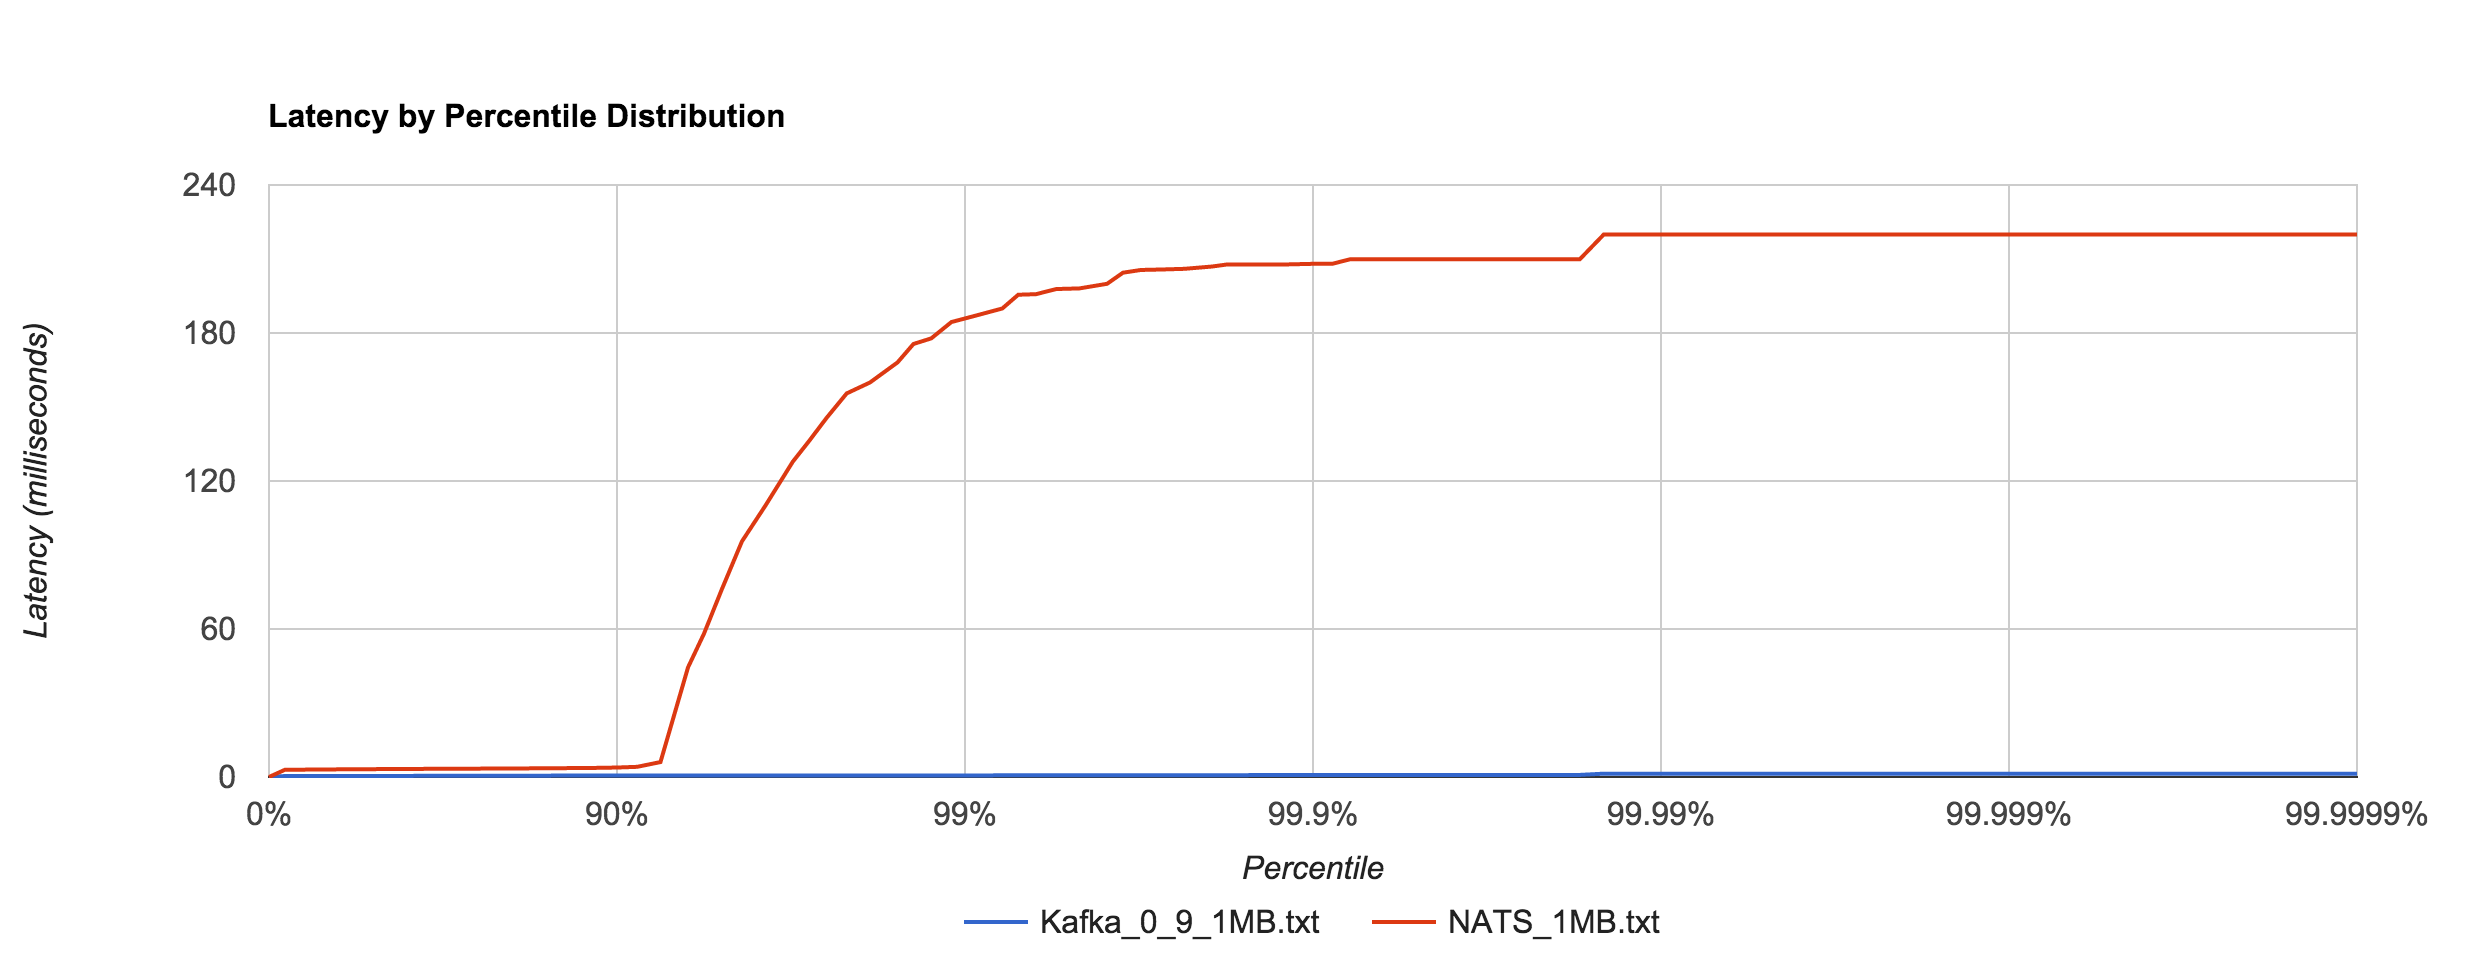
As with 0.8, Kafka 0.9 does an impressive job dealing with 1MB messages in comparison to NATS, especially when looking at the 92nd percentile and beyond. It’s hard to decipher in the graph below, but Kafka 0.9’s 99th, 99.9th, and 99.99th percentile latencies are 0.66, 0.78, and 1.35 ms, respectively.

Kafka_0_9_NATS_1MB

My initial thought was that the difference between Kafka 0.8 and 0.9 was attributed to a change in fsync behavior. To quote the Kafka documentation:

Kafka always immediately writes all data to the filesystem and supports the ability to configure the flush policy that controls when data is forced out of the OS cache and onto disk using the and flush. This flush policy can be controlled to force data to disk after a period of time or after a certain number of messages has been written.

However, there don’t appear to be any changes in the default flushing configuration between 0.8 and 0.9. The default configuration disables application fsync entirely, instead relying on the OS’s background flush. Jay Kreps indicates it’s a result of several “high percentile latency issues” that were fixed in 0.9. After scanning the 0.9 release notes, I was unable to determine specifically what those fixes might be. Either way, the difference is certainly not something to scoff at.

Conclusion

As always, interpret these benchmark results with a critical eye and perform your own tests if you’re evaluating these systems. This was more an exercise in benchmark methodology and tooling than an actual system analysis (and, as always, there’s still a lot of room for improvement). If anything, I think these results show how much we can miss by not looking beyond the 99th percentile. In almost all cases, everything looks pretty good up to that point, but after that things can get really bad. This is important to be conscious of when discussing SLAs.

I think the key takeaway is to consider your expected load in production, benchmark configurations around that, determine your allowable service levels, and iterate or provision more resources until you’re within those limits. The other important takeaway with respect to benchmarking is to look at the complete latency distribution. Otherwise, you’re not getting a clear picture of how your system actually behaves.

Dissecting Message Queues

Disclaimer (10/29/20) – The benchmarks and performance analysis presented in this post should not be relied on. This post was written roughly six years ago, and at the time, was just the result of my exploration of various messaging systems. The benchmarks are not implemented in a meaningful way, which I discussed in a follow-up post. This post will remain for posterity and learning purposes, but I do not claim that this information is accurate or useful.

Continuing my series on message queues, I spent this weekend dissecting various libraries for performing distributed messaging. In this analysis, I look at a few different aspects, including API characteristics, ease of deployment and maintenance, and performance qualities. The message queues have been categorized into two groups: brokerless and brokered. Brokerless message queues are peer-to-peer such that there is no middleman involved in the transmission of messages, while brokered queues have some sort of server in between endpoints.

The systems I’ll be analyzing are:

Brokerless
nanomsg
ZeroMQ

Brokered
ActiveMQ
NATS
Kafka
Kestrel
NSQ
RabbitMQ
Redis
ruby-nats

To start, let’s look at the performance metrics since this is arguably what people care the most about. I’ve measured two key metrics: throughput and latency. All tests were run on a MacBook Pro 2.6 GHz i7, 16GB RAM. These tests are evaluating a publish-subscribe topology with a single producer and single consumer. This provides a good baseline. It would be interesting to benchmark a scaled-up topology but requires more instrumentation.

The code used for benchmarking, written in Go, is available on GitHub. The results below shouldn’t be taken as gospel as there are likely optimizations that can be made to squeeze out performance gains. Pull requests are welcome.

Throughput Benchmarks

Throughput is the number of messages per second the system is able to process, but what’s important to note here is that there is no single “throughput” that a queue might have. We’re sending messages between two different endpoints, so what we observe is a “sender” throughput and a “receiver” throughput—that is, the number of messages that can be sent per second and the number of messages that can be received per second.

This test was performed by sending 1,000,000 1KB messages and measuring the time to send and receive on each side. Many performance tests tend to use smaller messages in the range of 100 to 500 bytes. I chose 1KB because it’s more representative of what you might see in a production environment, although this varies case by case. For message-oriented middleware systems, only one broker was used. In most cases, a clustered environment would yield much better results.

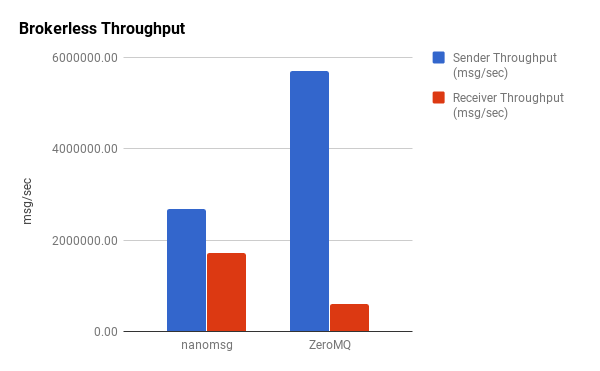
Unsurprisingly, there’s higher throughput on the sending side. What’s interesting, however, is the disparity in the sender-to-receiver ratios. ZeroMQ is capable of sending over 5,000,000 messages per second but is only able to receive about 600,000/second. In contrast, nanomsg sends shy of 3,000,000/second but can receive almost 2,000,000.

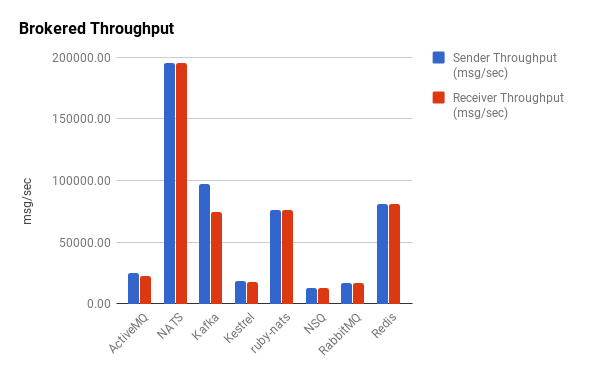
Now let’s take a look at the brokered message queues.

Intuitively, we observe that brokered message queues have dramatically less throughput than their brokerless counterparts by a couple orders of magnitude for the most part. Half the brokered queues have a throughput below 25,000 messages/second. The numbers for Redis might be a bit misleading though. Despite providing pub/sub functionality, it’s not really designed to operate as a robust messaging queue. In a similar fashion to ZeroMQ, Redis disconnects slow clients, and it’s important to point out that it was not able to reliably handle this volume of messaging. As such, we consider it an outlier. Kafka and ruby-nats have similar performance characteristics to Redis but were able to reliably handle the message volume without intermittent failures. The Go implementation of NATS, gnatsd, has exceptional throughput for a brokered message queue.

Outliers aside, we see that the brokered queues have fairly uniform throughputs. Unlike the brokerless libraries, there is little-to-no disparity in the sender-to-receiver ratios, which themselves are all very close to one.

Latency Benchmarks

The second key performance metric is message latency. This measures how long it takes for a message to be transmitted between endpoints. Intuition might tell us that this is simply the inverse of throughput, i.e. if throughput is messages/second, latency is seconds/message. However, by looking closely at this image borrowed from a ZeroMQ white paper, we can see that this isn’t quite the case.

The reality is that the latency per message sent over the wire is not uniform. It can vary wildly for each one. In truth, the relationship between latency and throughput is a bit more involved. Unlike throughput, however, latency is not measured at the sender or the receiver but rather as a whole. But since each message has its own latency, we will look at the averages of all of them. Going further, we will see how the average message latency fluctuates in relation to the number of messages sent. Again, intuition tells us that more messages means more queueing, which means higher latency.

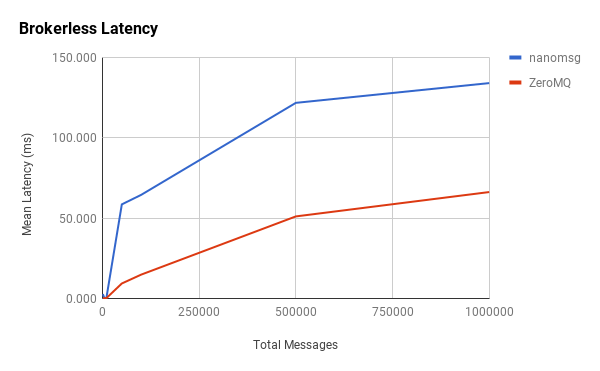
As we did before, we’ll start by looking at the brokerless systems.

In general, our hypothesis proves correct in that, as more messages are sent through the system, the latency of each message increases. What’s interesting is the tapering at the 500,000-point in which latency appears to increase at a slower rate as we approach 1,000,000 messages. Another interesting observation is the initial spike in latency between 1,000 and 5,000 messages, which is more pronounced with nanomsg. It’s difficult to pinpoint causation, but these changes might be indicative of how message batching and other network-stack traversal optimizations are implemented in each library. More data points may provide better visibility.

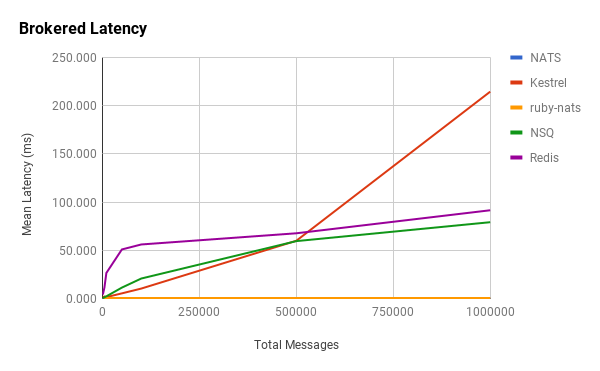
We see some similar patterns with brokered queues and also some interesting new ones.

Redis behaves in a similar manner as before, with an initial latency spike and then a quick tapering off. It differs in that the tapering becomes essentially constant right after 5,000 messages. NSQ doesn’t exhibit the same spike in latency and behaves, more or less, linearly. Kestrel fits our hypothesis.

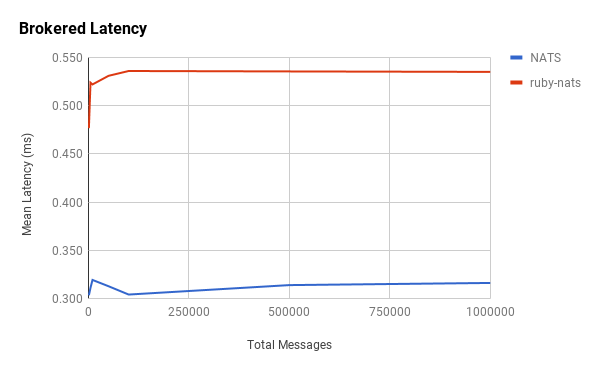
Notice that ruby-nats and NATS hardly even register on the chart. They exhibited surprisingly low latencies and unexpected relationships with the number of messages.

Interestingly, the message latencies for ruby-nats and NATS appear to be constant. This is counterintuitive to our hypothesis.

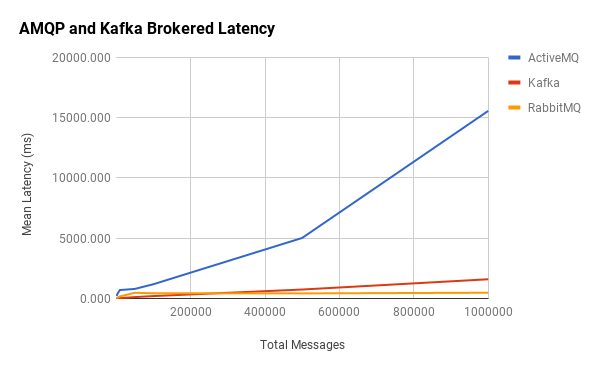
You may have noticed that Kafka, ActiveMQ, and RabbitMQ were absent from the above charts. This was because their latencies tended to be orders-of-magnitude higher than the other brokered message queues, so ActiveMQ and RabbitMQ were grouped into their own AMQP category. I’ve also included Kafka since it’s in the same ballpark.

Here we see that RabbitMQ’s latency is constant, while ActiveMQ and Kafka are linear. What’s unclear is the apparent disconnect between their throughput and mean latencies.

Qualitative Analysis

Now that we’ve seen some empirical data on how these different libraries perform, I’ll take a look at how they work from a pragmatic point of view. Message throughput and speed is important, but it isn’t very practical if the library is difficult to use, deploy, or maintain.

ZeroMQ and Nanomsg

Technically speaking, nanomsg isn’t a message queue but rather a socket-style library for performing distributed messaging through a variety of convenient patterns. As a result, there’s nothing to deploy aside from embedding the library itself within your application. This makes deployment a non-issue.

Nanomsg is written by one of the ZeroMQ authors, and as I discussed before, works in a very similar way to that library. From a development standpoint, nanomsg provides an overall cleaner API. Unlike ZeroMQ, there is no notion of a context in which sockets are bound to. Furthermore, nanomsg provides pluggable transport and messaging protocols, which make it more open to extension. Its additional built-in scalability protocols also make it quite appealing.

Like ZeroMQ, it guarantees that messages will be delivered atomically intact and ordered but does not guarantee the delivery of them. Partial messages will not be delivered, and it’s possible that some messages won’t be delivered at all. The library’s author, Martin Sustrik, makes this abundantly clear:

Guaranteed delivery is a myth. Nothing is 100% guaranteed. That’s the nature of the world we live in. What we should do instead is to build an internet-like system that is resilient in face of failures and routes around damage.

The philosophy is to use a combination of topologies to build resilient systems that add in these guarantees in a best-effort sort of way.

On the other hand, nanomsg is still in beta and may not be considered production-ready. Consequently, there aren’t a lot of resources available and not much of a development community around it.

ZeroMQ is a battle-tested messaging library that’s been around since 2007. Some may perceive it as a predecessor to nanomsg, but what nano lacks is where ZeroMQ thrives—a flourishing developer community and a deluge of resources and supporting material. For many, it’s the de facto tool for building fast, asynchronous distributed messaging systems that scale.

Like nanomsg, ZeroMQ is not a message-oriented middleware and simply operates as a socket abstraction. In terms of usability, it’s very much the same as nanomsg, although its API is marginally more involved.

ActiveMQ and RabbitMQ

ActiveMQ and RabbitMQ are implementations of AMQP. They act as brokers which ensure messages are delivered. ActiveMQ and RabbitMQ support both persistent and non-persistent delivery. By default, messages are written to disk such that they survive a broker restart. They also support synchronous and asynchronous sending of messages with the former having substantial impact on latency. To guarantee delivery, these brokers use message acknowledgements which also incurs a massive latency penalty.

As far as availability and fault tolerance goes, these brokers support clustering through shared storage or shared nothing. Queues can be replicated across clustered nodes so there is no single point of failure or message loss.

AMQP is a non-trivial protocol which its creators claim to be over-engineered. These additional guarantees are made at the expense of major complexity and performance trade-offs. Fundamentally, clients are more difficult to implement and use.

Since they’re message brokers, ActiveMQ and RabbitMQ are additional moving parts that need to be managed in your distributed system, which brings deployment and maintenance costs. The same is true for the remaining message queues being discussed.

NATS and Ruby-NATS

NATS (gnatsd) is a pure Go implementation of the ruby-nats messaging system. NATS is distributed messaging rethought to be less enterprisey and more lightweight (this is in direct contrast to systems like ActiveMQ, RabbitMQ, and others). Apcera’s Derek Collison, the library’s author and former TIBCO architect, describes NATS as “more like a nervous system” than an enterprise message queue. It doesn’t do persistence or message transactions, but it’s fast and easy to use. Clustering is supported so it can be built on top of with high availability and failover in mind, and clients can be sharded. Unfortunately, TLS and SSL are not yet supported in NATS (they are in the ruby-nats) but on the roadmap.

As we observed earlier, NATS performs far better than the original Ruby implementation. Clients can be used interchangeably with NATS and ruby-nats.

Kafka

Originally developed by LinkedIn, Kafka implements publish-subscribe messaging through a distributed commit log. It’s designed to operate as a cluster that can be consumed by large amounts of clients. Horizontal scaling is done effortlessly using ZooKeeper so that additional consumers and brokers can be introduced seamlessly. It also transparently takes care of cluster rebalancing.

Kafka uses a persistent commit log to store messages on the broker. Unlike other durable queues which usually remove persisted messages on consumption, Kafka retains them for a configured period of time. This means that messages can be “replayed” in the event that a consumer fails.

ZooKeeper makes managing Kafka clusters relatively easy, but it does introduce yet another element that needs to be maintained. That said, Kafka exposes a great API and Shopify has an excellent Go client called Sarama that makes interfacing with Kafka very accessible.

Kestrel

Kestrel is a distributed message queue open sourced by Twitter. It’s intended to be fast and lightweight. Because of this, it has no concept of clustering or failover. While Kafka is built from the ground up to be clustered through ZooKeeper, the onus of message partitioning is put upon the clients of Kestrel. There is no cross-communication between nodes. It makes this trade-off in the name of simplicity. It features durable queues, item expiration, transactional reads, and fanout queues while operating over Thrift or memcache protocols.

Kestrel is designed to be small, but this means that more work must be done by the developer to build out a robust messaging system on top of it. Kafka seems to be a more “all-in-one” solution.

NSQ

NSQ is a messaging platform built by Bitly. I use the word platform because there’s a lot of tooling built around NSQ to make it useful for real-time distributed messaging. The daemon that receives, queues, and delivers messages to clients is called nsqd. The daemon can run standalone, but NSQ is designed to run in as a distributed, decentralized topology. To achieve this, it leverages another daemon called nsqlookupd. Nsqlookupd acts as a service-discovery mechanism for nsqd instances. NSQ also provides nsqadmin, which is a web UI that displays real-time cluster statistics and acts as a way to perform various administrative tasks like clearing queues and managing topics.

By default, messages in NSQ are not durable. It’s primarily designed to be an in-memory message queue, but queue sizes can be configured such that after a certain point, messages will be written to disk. Despite this, there is no built-in replication. NSQ uses acknowledgements to guarantee message delivery, but the order of delivery is not guaranteed. Messages can also be delivered more than once, so it’s the developer’s responsibility to introduce idempotence.

Similar to Kafka, additional nodes can be added to an NSQ cluster seamlessly. It also exposes both an HTTP and TCP API, which means you don’t actually need a client library to push messages into the system. Despite all the moving parts, it’s actually quite easy to deploy. Its API is also easy to use and there are a number of client libraries available.

Redis

Last up is Redis. While Redis is great for lightweight messaging and transient storage, I can’t advocate its use as the backbone of a distributed messaging system. Its pub/sub is fast but its capabilities are limited. It would require a lot of work to build a robust system. There are solutions better suited to the problem, such as those described above, and there are also some scaling concerns with it.

These matters aside, Redis is easy to use, it’s easy to deploy and manage, and it has a relatively small footprint. Depending on the use case, it can be a great choice for real-time messaging as I’ve explored before.

Conclusion

The purpose of this analysis is not to present some sort of “winner” but instead showcase a few different options for distributed messaging. There is no “one-size-fits-all” option because it depends entirely on your needs. Some use cases require fast, fire-and-forget messages, others require delivery guarantees. In fact, many systems will call for a combination of these. My hope is that this dissection will offer some insight into which solutions work best for a given problem so that you can make an intelligent decision.