Building a Distributed Log from Scratch, Part 1: Storage Mechanics

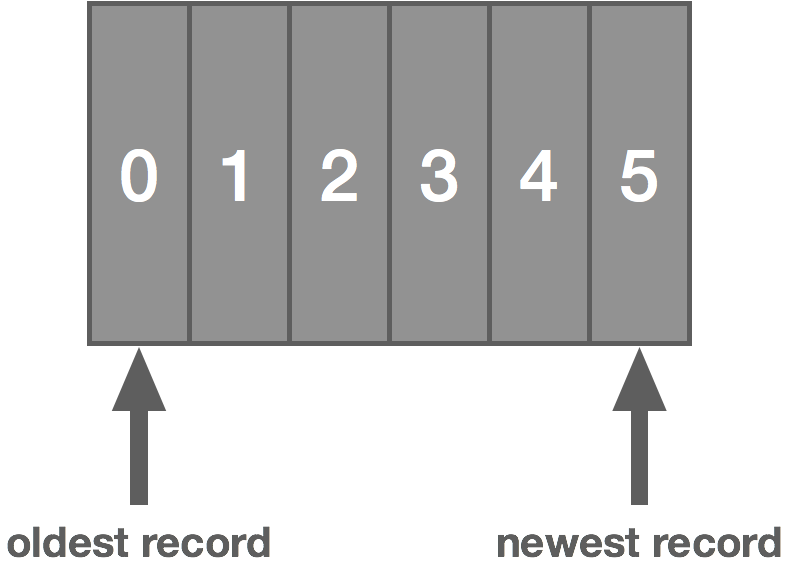
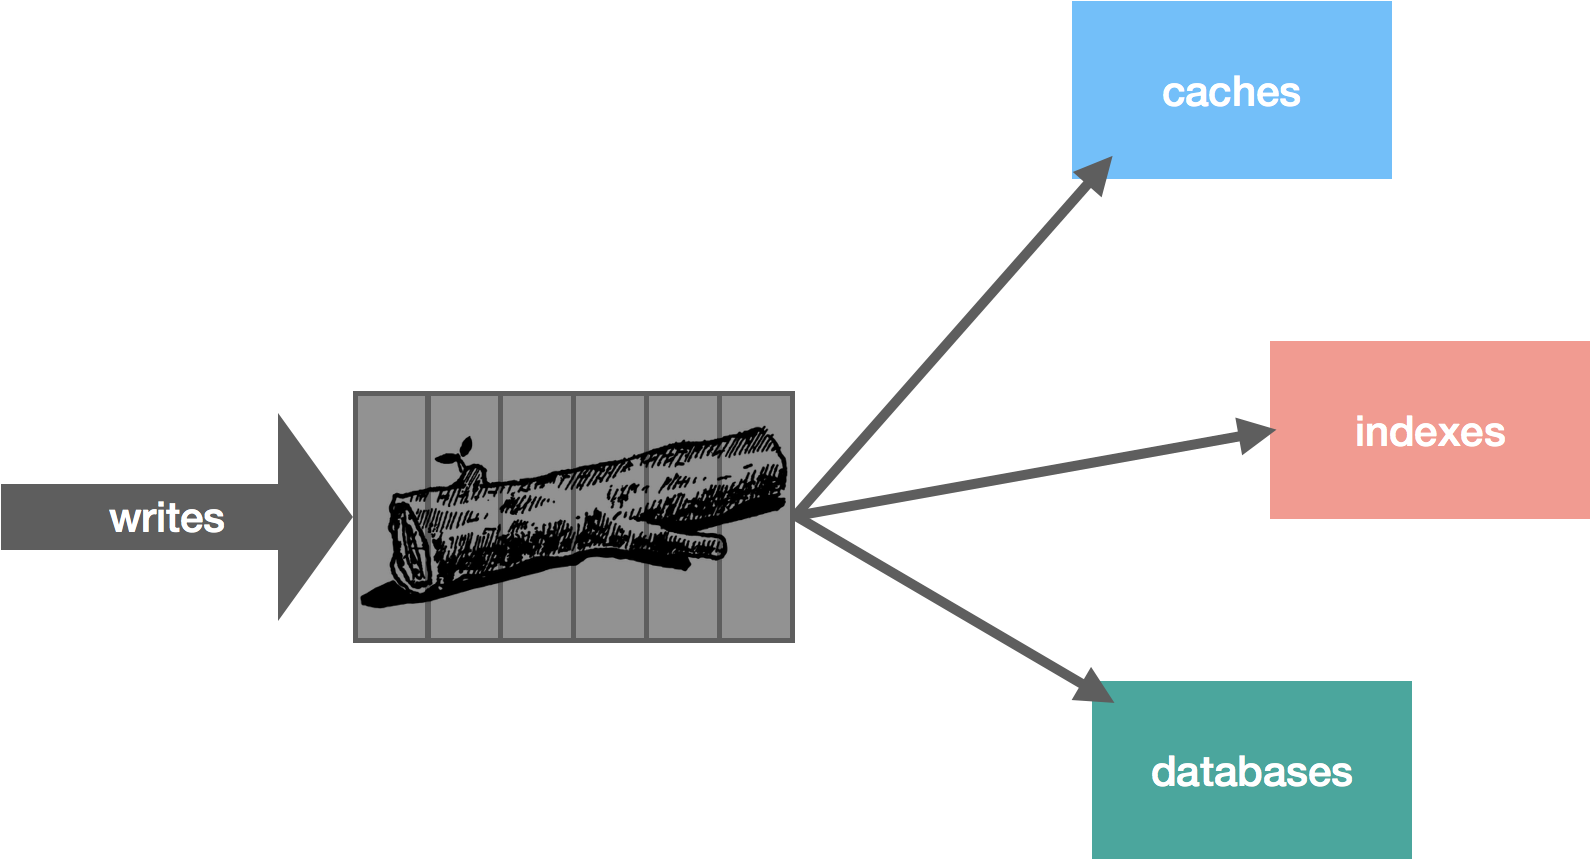
The log is a totally-ordered, append-only data structure. It’s a powerful yet simple abstraction—a sequence of immutable events. It’s something that programmers have been using for a very long time, perhaps without even realizing it because it’s so simple. Whether it’s application logs, system logs, or access logs, logging is something every developer uses on a daily basis. Essentially, it’s a timestamp and an event, a when and a what, and typically appended to the end of a file. But when we generalize that pattern, we end up with something much more useful for a broad range of problems. It becomes more interesting when we look at the log not just as a system of record but a central piece in managing data and distributing it across the enterprise efficiently.


There are a number of implementations of this idea: Apache Kafka, Amazon Kinesis, NATS Streaming, Tank, and Apache Pulsar to name a few. We can probably credit Kafka with popularizing the idea.

I think there are at least three key priorities for the effectiveness of one of these types of systems: performance, high availability, and scalability. If it’s not fast enough, the data becomes decreasingly useful. If it’s not highly available, it means we can’t reliably get our data in or out. And if it’s not scalable, it won’t be able to meet the needs of many enterprises.

When we apply the traditional pub/sub semantics to this idea of a log, it becomes a very useful abstraction that applies to a lot of different problems.

In this series, we’re not going to spend much time discussing why the log is useful. Jay Kreps has already done the legwork on that with The Log: What every software engineer should know about real-time data’s unifying abstraction. There’s even a book on it. Instead, we will focus on what it takes to build something like this using Kafka and NATS Streaming as case studies of sorts—Kafka because of its ubiquity, NATS Streaming because it’s something with which I have personal experience. We’ll look at a few core components like leader election, data replication, log persistence, and message delivery. Part one of this series starts with the storage mechanics. Along the way, we will also discuss some lessons learned while building NATS Streaming, which is a streaming data layer on top of the NATS messaging system. The intended outcome of this series is threefold: to learn a bit about the internals of a log abstraction, to learn how it can achieve the three goals described above, and to learn some applied distributed systems theory.

With that in mind, you will probably never need to build something like this yourself (nor should you), but it helps to know how it works. I also find that software engineering is all about pattern matching. Many types of problems look radically different but are surprisingly similar. Some of these ideas may apply to other things you come across. If nothing else, it’s just interesting.

Let’s start by looking at data storage since this is a critical part of the log and dictates some other aspects of it. Before we dive into that, though, let’s highlight some first principles we’ll use as a starting point for driving our design.

As we know, the log is an ordered, immutable sequence of messages. Messages are atomic, meaning they can’t be broken up. A message is either in the log or not, all or nothing. Although we only ever add messages to the log and never remove them (as with a message queue), the log has a notion of message retention based on some policies, which allows us to control how the log is truncated. This is a practical requirement since otherwise the log will grow endlessly. These policies might be based on time, number of messages, number of bytes, etc.

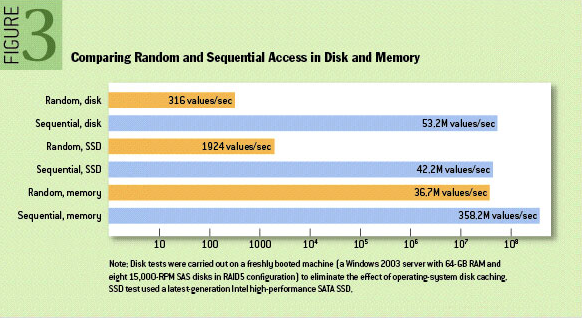
The log can be played back from any arbitrary position. With position, we normally refer to a logical message timestamp rather than a physical wall-clock time, such as an offset into the log. The log is stored on disk, and sequential disk access is actually relatively fast. The graphic below taken from the ACM Queue article The Pathologies of Big Data helps bear this out (this is helpfully pointed out by Kafka’s documentation).

That said, modern OS page caches mean that sequential access often avoids going to disk altogether. This is because the kernel keeps cached pages in otherwise unused portions of RAM. This means both reads and writes go to the in-memory page cache instead of disk. With Kafka, for example, we can verify this quite easily by running a simple test that writes some data and reads it back and looking at disk IO using iostat. After running such a test, you will likely see something resembling the following, which shows the number of blocks read and written is exactly zero.

avg-cpu:  %user   %nice %system %iowait  %steal   %idle
          13.53    0.00   11.28    0.00    0.00   75.19

Device:    tps   Blk_read/s   Blk_wrtn/s   Blk_read   Blk_wrtn
xvda      0.00         0.00         0.00          0          0

With the above in mind, our log starts to look an awful lot like an actual logging file, but instead of timestamps and log messages, we have offsets and opaque data messages. We simply add new messages to the end of the file with a monotonically increasing offset.

However, there are some problems with this approach. Namely, the file is going to get very, very large. Recall that we need to support a few different access patterns: looking up messages by offset and also truncating the log using a variety of different retention policies. Since the log is ordered, a lookup is simply a binary search for the offset, but this is expensive with a large log file. Similarly, aging out data by retention policy is harder.

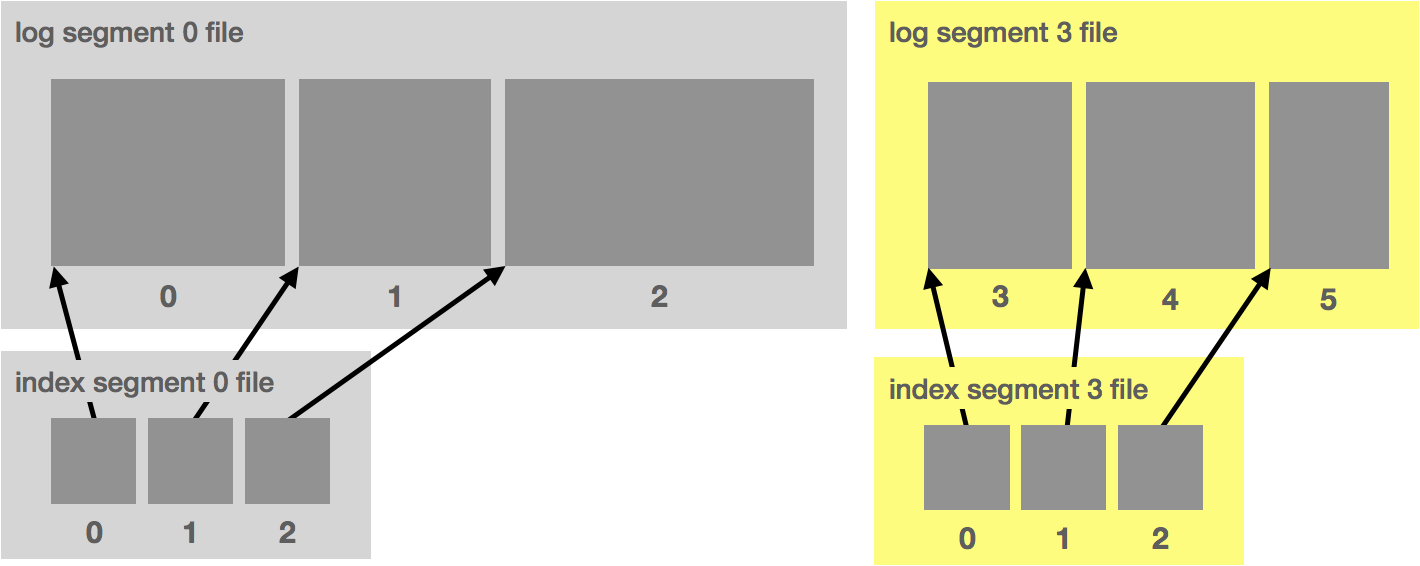
To account for this, we break up the log file into chunks. In Kafka, these are called segments. In NATS Streaming, they are called slices. Each segment is a new file. At a given time, there is a single active segment, which is the segment messages are written to. Once the segment is full (based on some configuration), a new one is created and becomes active.

Segments are defined by their base offset, i.e. the offset of the first message stored in the segment. In Kafka, the files are also named with this offset. This allows us to quickly locate the segment in which a given message is contained by doing a binary search.

Alongside each segment file is an index file that maps message offsets to their respective positions in the log segment. In Kafka, the index uses 4 bytes for storing an offset relative to the base offset and 4 bytes for storing the log position. Using a relative offset is more efficient because it means we can avoid storing the actual offset as an int64. In NATS Streaming, the timestamp is also stored to do time-based lookups.

Ideally, the data written to the log segment is written in protocol format. That is, what gets written to disk is exactly what gets sent over the wire. This allows for zero-copy reads. Let’s take a look at how this otherwise works.

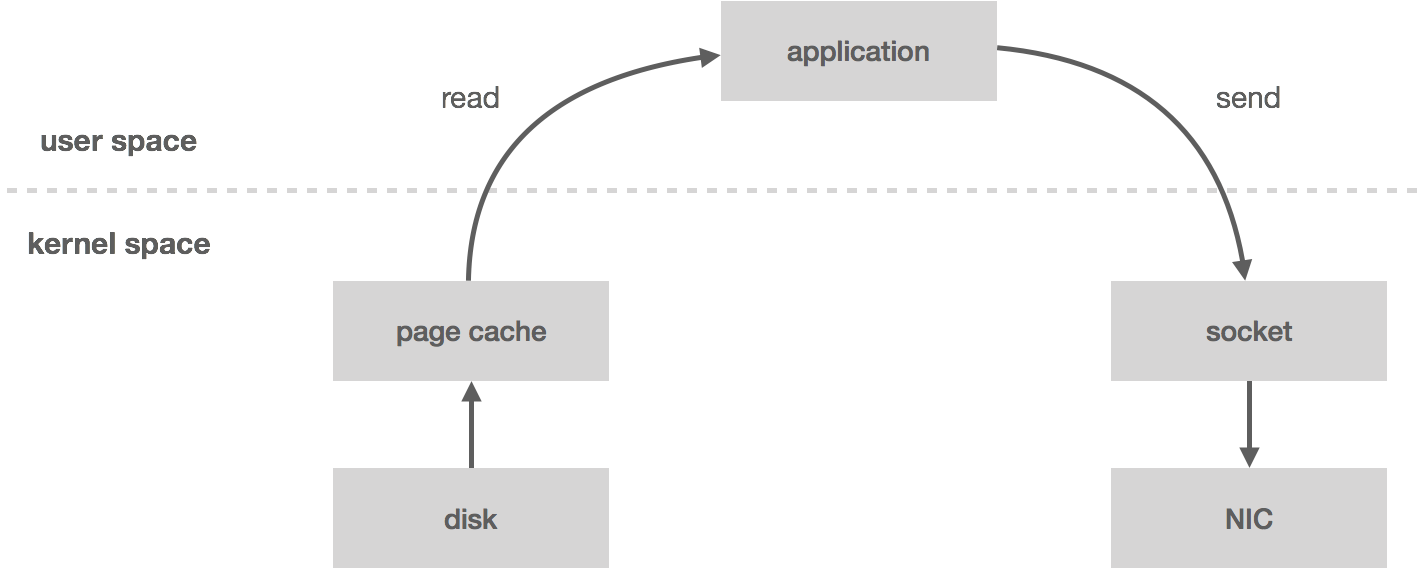
When you read messages from the log, the kernel will attempt to pull the data from the page cache. If it’s not there, it will be read from disk. The data is copied from disk to page cache, which all happens in kernel space. Next, the data is copied into the application (i.e. user space). This all happens with the read system call. Now the application writes the data out to a socket using send, which is going to copy it back into kernel space to a socket buffer before it’s copied one last time to the NIC. All in all, we have four copies (including one from page cache) and two system calls.

However, if the data is already in wire format, we can bypass user space entirely using the sendfile system call, which will copy the data directly from the page cache to the NIC buffer—two copies (including one from page cache) and one system call. This turns out to be an important optimization, especially in garbage-collected languages since we’re bringing less data into application memory. Zero-copy also reduces CPU cycles and memory bandwidth.

NATS Streaming does not currently make use of zero-copy for a number of reasons, some of which we will get into later in the series. In fact, the NATS Streaming storage layer is actually pluggable in that it can be backed by any number of mediums which implement the storage interface. Out of the box it includes the file-backed storage described above, in-memory, and SQL-backed.

There are a few other optimizations to make here such as message batching and compression, but we’ll leave those as an exercise for the reader.

In part two of this series, we will discuss how to make this log fault tolerant by diving into data-replication techniques.

Benchmarking Commit Logs

In this article, we look at Apache Kafka and NATS Streaming, two messaging systems based on the idea of a commit log. We’ll compare some of the features of both but spend less time talking about Kafka since by now it’s quite well known. Similar to previous studies, we’ll attempt to quantify their general performance characteristics through careful benchmarking.

The purpose of this benchmark is to test drive the newly released NATS Streaming system, which was made generally available just in the last few months. NATS Streaming doesn’t yet support clustering, so we try to put its performance into context by looking at a similar configuration of Kafka.

Unlike conventional message queues, commit logs are an append-only data structure. This results in several nice properties like total ordering of messages, at-least-once delivery, and message-replay semantics. Jay Kreps’ blog post The Log is a great introduction to the concept and particularly why it’s so useful in the context of distributed systems and stream processing (his book I Heart Logs is an extended version of the blog post and is a quick read).

Kafka, which originated at LinkedIn, is by far the most popular and most mature implementation of the commit log (AWS offers their own flavor of it called Kinesis, and imitation is the sincerest form of flattery). It’s billed as a “distributed streaming platform for building real-time data pipelines and streaming apps.” The much newer NATS Streaming is actually a data-streaming layer built on top of Apcera’s high-performance publish-subscribe system NATS. It’s billed as “real-time streaming for Big Data, IoT, Mobile, and Cloud Native Applications.” Both have some similarities as well as some key differences.

Fundamental to the notion of a log is a way to globally order events. Neither NATS Streaming nor Kafka are actually a single log but many logs, each totally ordered using a sequence number or offset, respectively.

In Kafka, topics are partitioned into multiple logs which are then replicated across a number of servers for fault tolerance, making it a distributed commit log. Each partition has a server that acts as the leader. Cluster membership and leader election is managed by ZooKeeper.

NATS Streaming’s topics are called “channels” which are globally ordered. Unlike Kafka, NATS Streaming does not support replication or partitioning of channels, though my understanding is clustering support is slated for Q1 2017. Its message store is pluggable, so it can provide durability using a file-backed implementation, like Kafka, or simply an in-memory store.

NATS Streaming is closer to a hybrid of traditional message queues and the commit log. Like Kafka, it allows replaying the log from a specific offset, the beginning of time, or the newest offset, but it also exposes an API for reading from the log at a specific physical time offset, e.g. all messages from the last 30 seconds. Kafka, on the other hand, only has a notion of logical offsets (correction: Kafka added support for offset lookup by timestamp in 0.10.1.0) . Generally, relying on physical time is an anti-pattern in distributed systems due to clock drift and the fact that clocks are not always monotonic. For example, imagine a situation where a NATS Streaming server is restarted and the clock is changed. Messages are still ordered by their sequence numbers but their timestamps might not reflect that. Developers would need to be aware of this while implementing their business logic.

With Kafka, it’s strictly on consumers to track their offset into the log (or the high-level consumer which stores offsets in ZooKeeper (correction: Kafka itself can now store offsets which is used by the new Consumer API, meaning clients do not have to manage offsets directly or rely on ZooKeeper)). NATS Streaming allows clients to either track their sequence number or use a durable subscription, which causes the server to track the last acknowledged message for a client. If the client restarts, the server will resume delivery starting at the earliest unacknowledged message. This is closer to what you would expect from a traditional message-oriented middleware like RabbitMQ.

Lastly, NATS Streaming supports publisher and subscriber rate limiting. This works by configuring the maximum number of in-flight (unacknowledged) messages either from the publisher to the server or from the server to the subscriber. Starting in version 0.9, Kafka supports a similar rate limiting feature that allows producer and consumer byte-rate thresholds to be defined for groups of clients with its Quotas protocol.

Kafka was designed to avoid tracking any client state on the server for performance and scalability reasons. Throughput and storage capacity scale linearly with the number of nodes. NATS Streaming provides some additional features over Kafka at the cost of some added state on the server. Since clustering isn’t supported, there isn’t really any scale or HA story yet, so it’s unclear how that will play out. That said, once replication is supported, there’s a lot of work going into verifying its correctness (which is a major advantage Kafka has).

Benchmarks

Since NATS Streaming does not support replication at this time (0.3.1), we’ll compare running a single instance of it with file-backed persistence to running a single instance of Kafka (0.10.1.0). We’ll look at both latency and throughput running on commodity hardware (m4.xlarge EC2 instances) with load generation and consumption each running on separate instances. In all of these benchmarks, the systems under test have not been tuned at all and are essentially in their “off-the-shelf” configurations.

We’ll first look at latency by publishing messages of various sizes, ranging from 256 bytes to 1MB, at a fixed rate of 50 messages/second for 30 seconds. Message contents are randomized to account for compression. We then plot the latency distribution by percentile on a logarithmic scale from the 0th percentile to the 99.9999th percentile. Benchmarks are run several times in an attempt to produce a “normalized” result. The benchmark code used is open source.

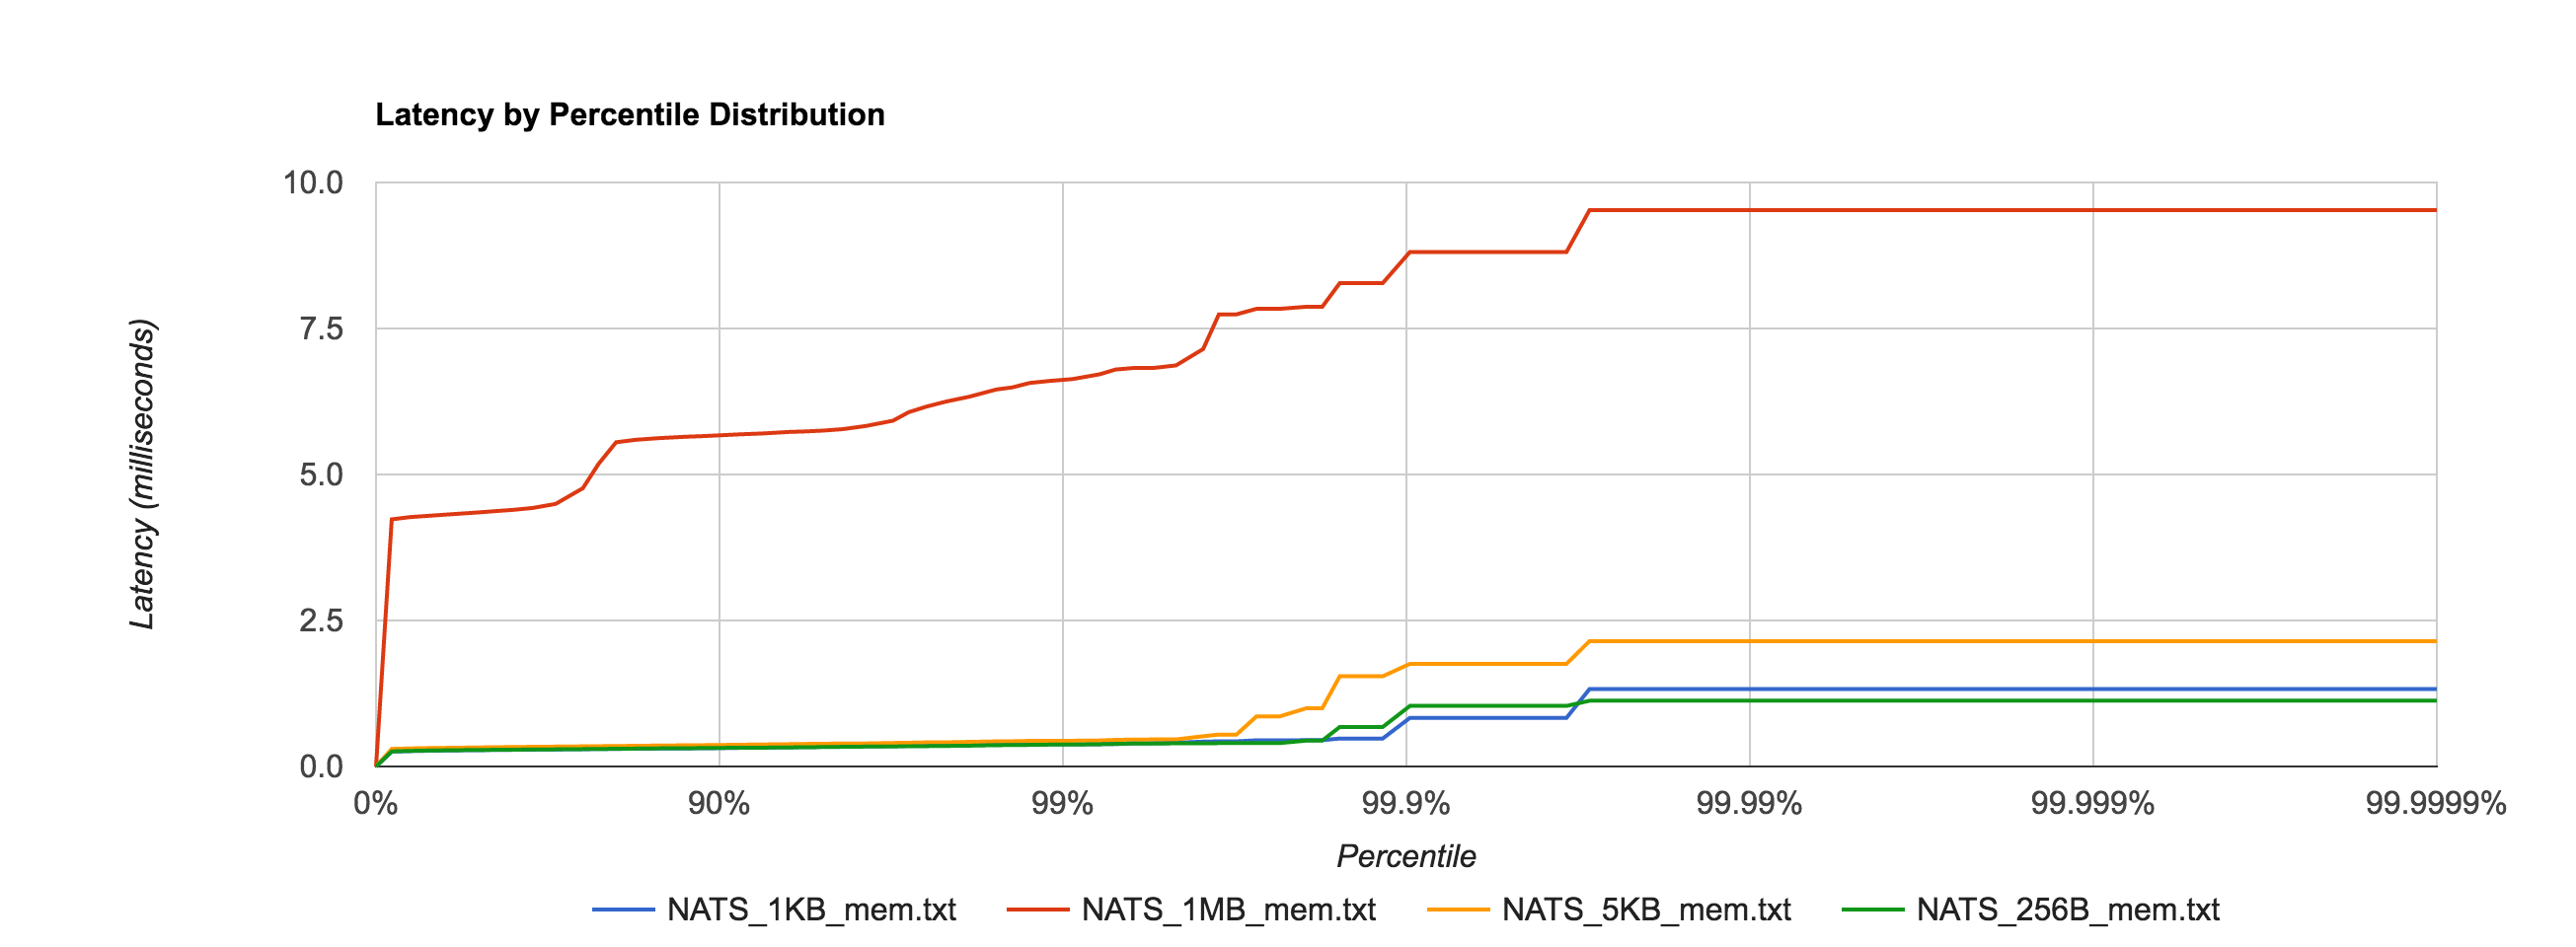
First, to establish a baseline and later get a feel for the overhead added by the file system, we’ll benchmark NATS Streaming with in-memory storage, meaning messages are not written to disk.

Unsurprisingly, the 1MB configuration has much higher latencies than the other configurations, but everything falls within single-digit-millisecond latencies.nats_mem

NATS Streaming 0.3.1 (in-memory persistence)

 Size 99% 99.9% 99.99% 99.999% 99.9999% 
256B 0.3750ms 1.0367ms 1.1257ms 1.1257ms 1.1257ms
1KB 0.38064ms 0.8321ms 1.3260ms 1.3260ms 1.3260ms
5KB 0.4408ms 1.7569ms 2.1465ms 2.1465ms 2.1465ms
1MB 6.6337ms 8.8097ms 9.5263ms 9.5263ms 9.5263ms

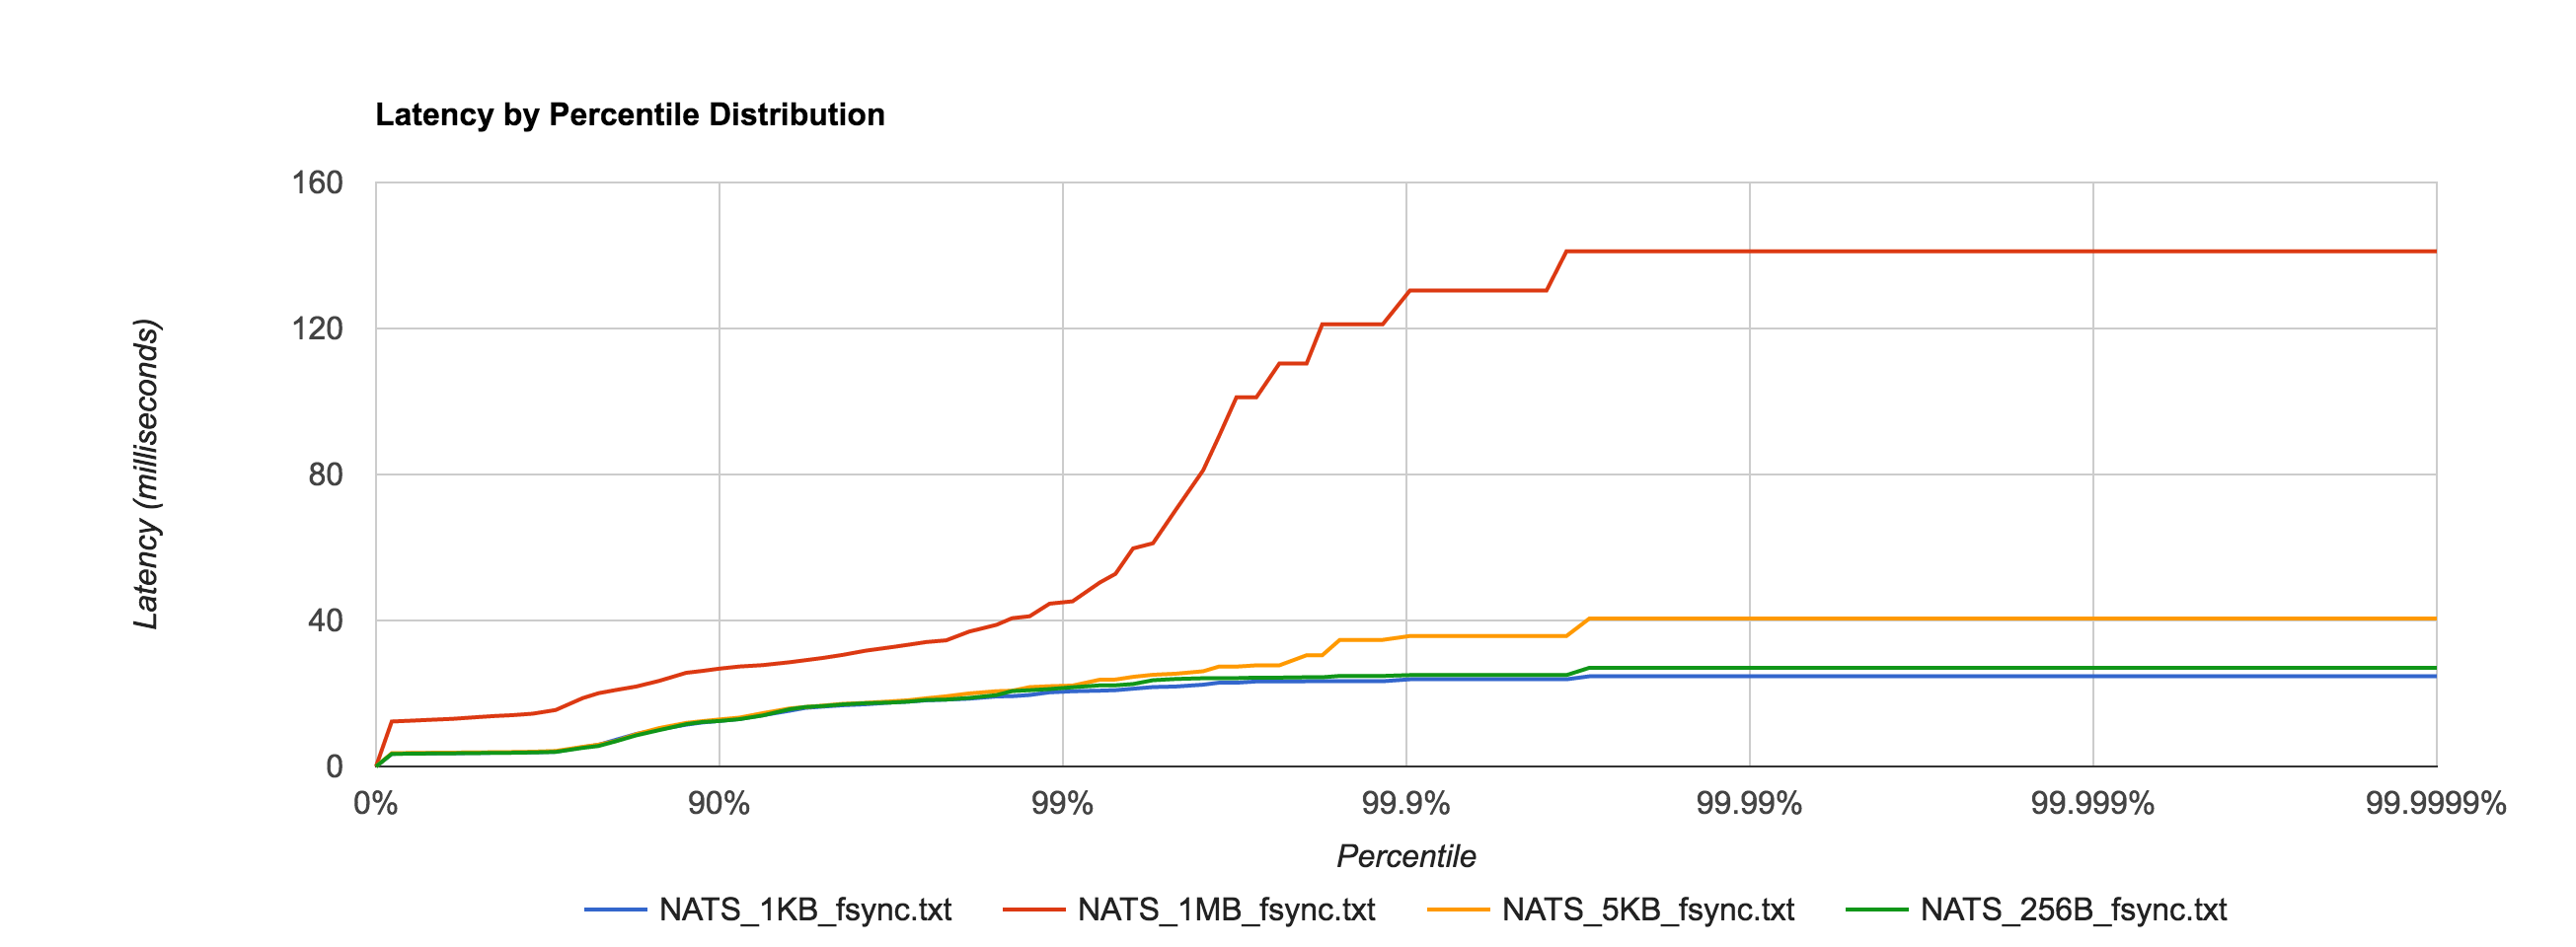
Next, we look at NATS Streaming with file-backed persistence. This provides the same durability guarantees as Kafka running with a replication factor of 1. By default, Kafka stores logs under /tmp. Many Unix distributions mount /tmp to tmpfs which appears as a mounted file system but is actually stored in volatile memory. To account for this and provide as level a playing field as possible, we configure NATS Streaming to also store its logs in /tmp.

As expected, latencies increase by about an order of magnitude once we start going to disk.

nats_file_fsync

NATS Streaming 0.3.1 (file-backed persistence)

 Size 99% 99.9% 99.99% 99.999% 99.9999% 
256B 21.7051ms 25.0369ms 27.0524ms 27.0524ms 27.0524ms
1KB 20.6090ms 23.8858ms 24.7124ms 24.7124ms 24.7124ms
5KB 22.1692ms 35.7394ms 40.5612ms 40.5612ms 40.5612ms
1MB 45.2490ms 130.3972ms 141.1564ms 141.1564ms 141.1564ms

Since we will be looking at Kafka, there is an important thing to consider relating to fsync behavior. As of version 0.8, Kafka does not call fsync directly and instead relies entirely on the background flush performed by the OS. This is clearly indicated by their documentation:

We recommend using the default flush settings which disable application fsync entirely. This means relying on the background flush done by the OS and Kafka’s own background flush. This provides the best of all worlds for most uses: no knobs to tune, great throughput and latency, and full recovery guarantees. We generally feel that the guarantees provided by replication are stronger than sync to local disk, however the paranoid still may prefer having both and application level fsync policies are still supported.

However, NATS Streaming calls fsync every time a batch is written to disk by default. This can be disabled through the use of the –file_sync flag. By setting this flag to false, we put NATS Streaming’s persistence behavior closer in line with Kafka’s (again assuming a replication factor of 1).

As an aside, the comparison between NATS Streaming and Kafka still isn’t completely “fair”. Jay Kreps points out that Kafka relies on replication as the primary means of durability.

Kafka leaves [fsync] off by default because it relies on replication not fsync for durability, which is generally faster. If you don’t have replication I think you probably need fsync and maybe some kind of high integrity file system.

I don’t think we can provide a truly fair comparison until NATS Streaming supports replication, at which point we will revisit this.

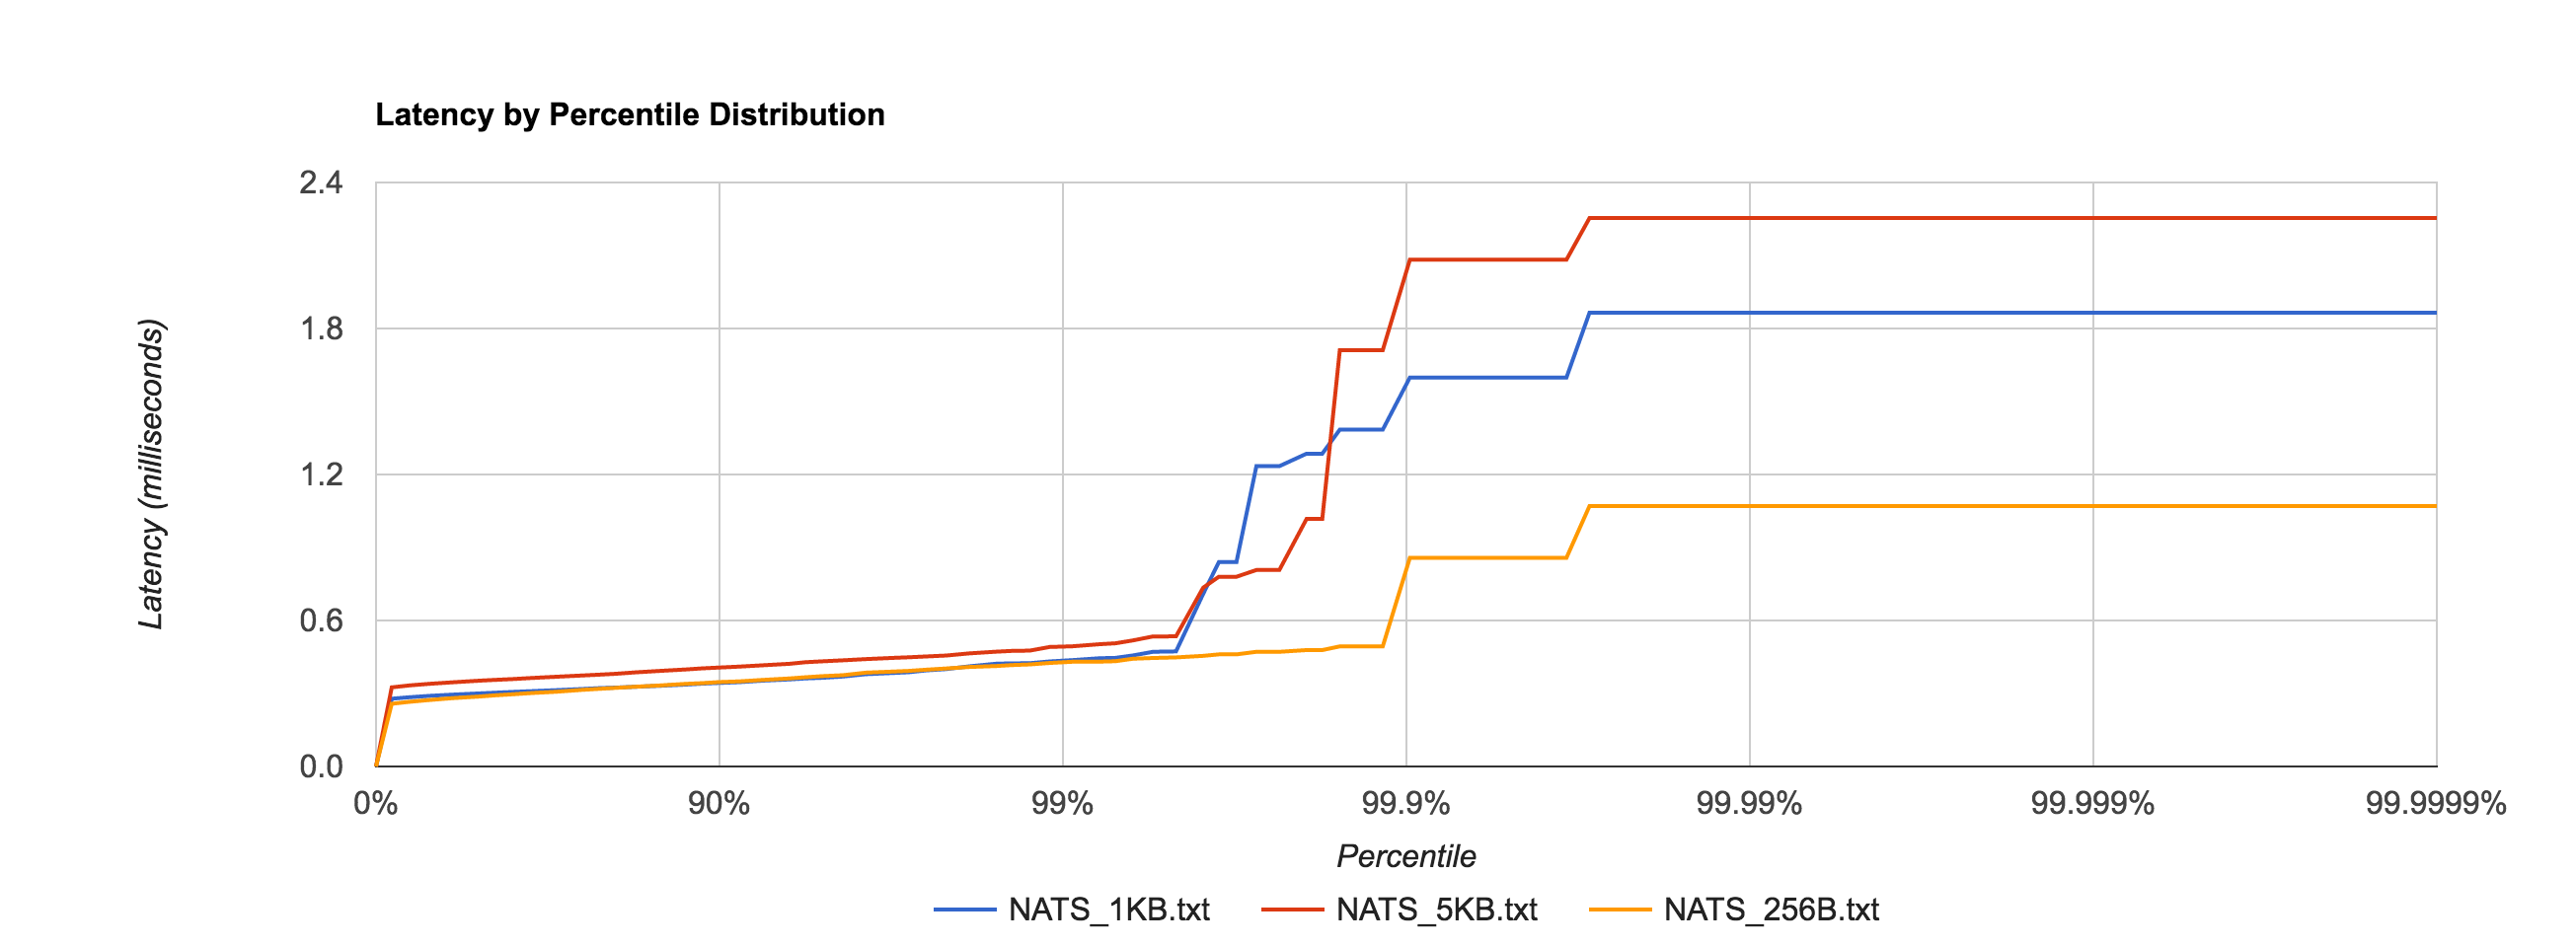
To no one’s surprise, setting –file_sync=false has a significant impact on latency, shown in the distribution below.

nats_file_no_fsync

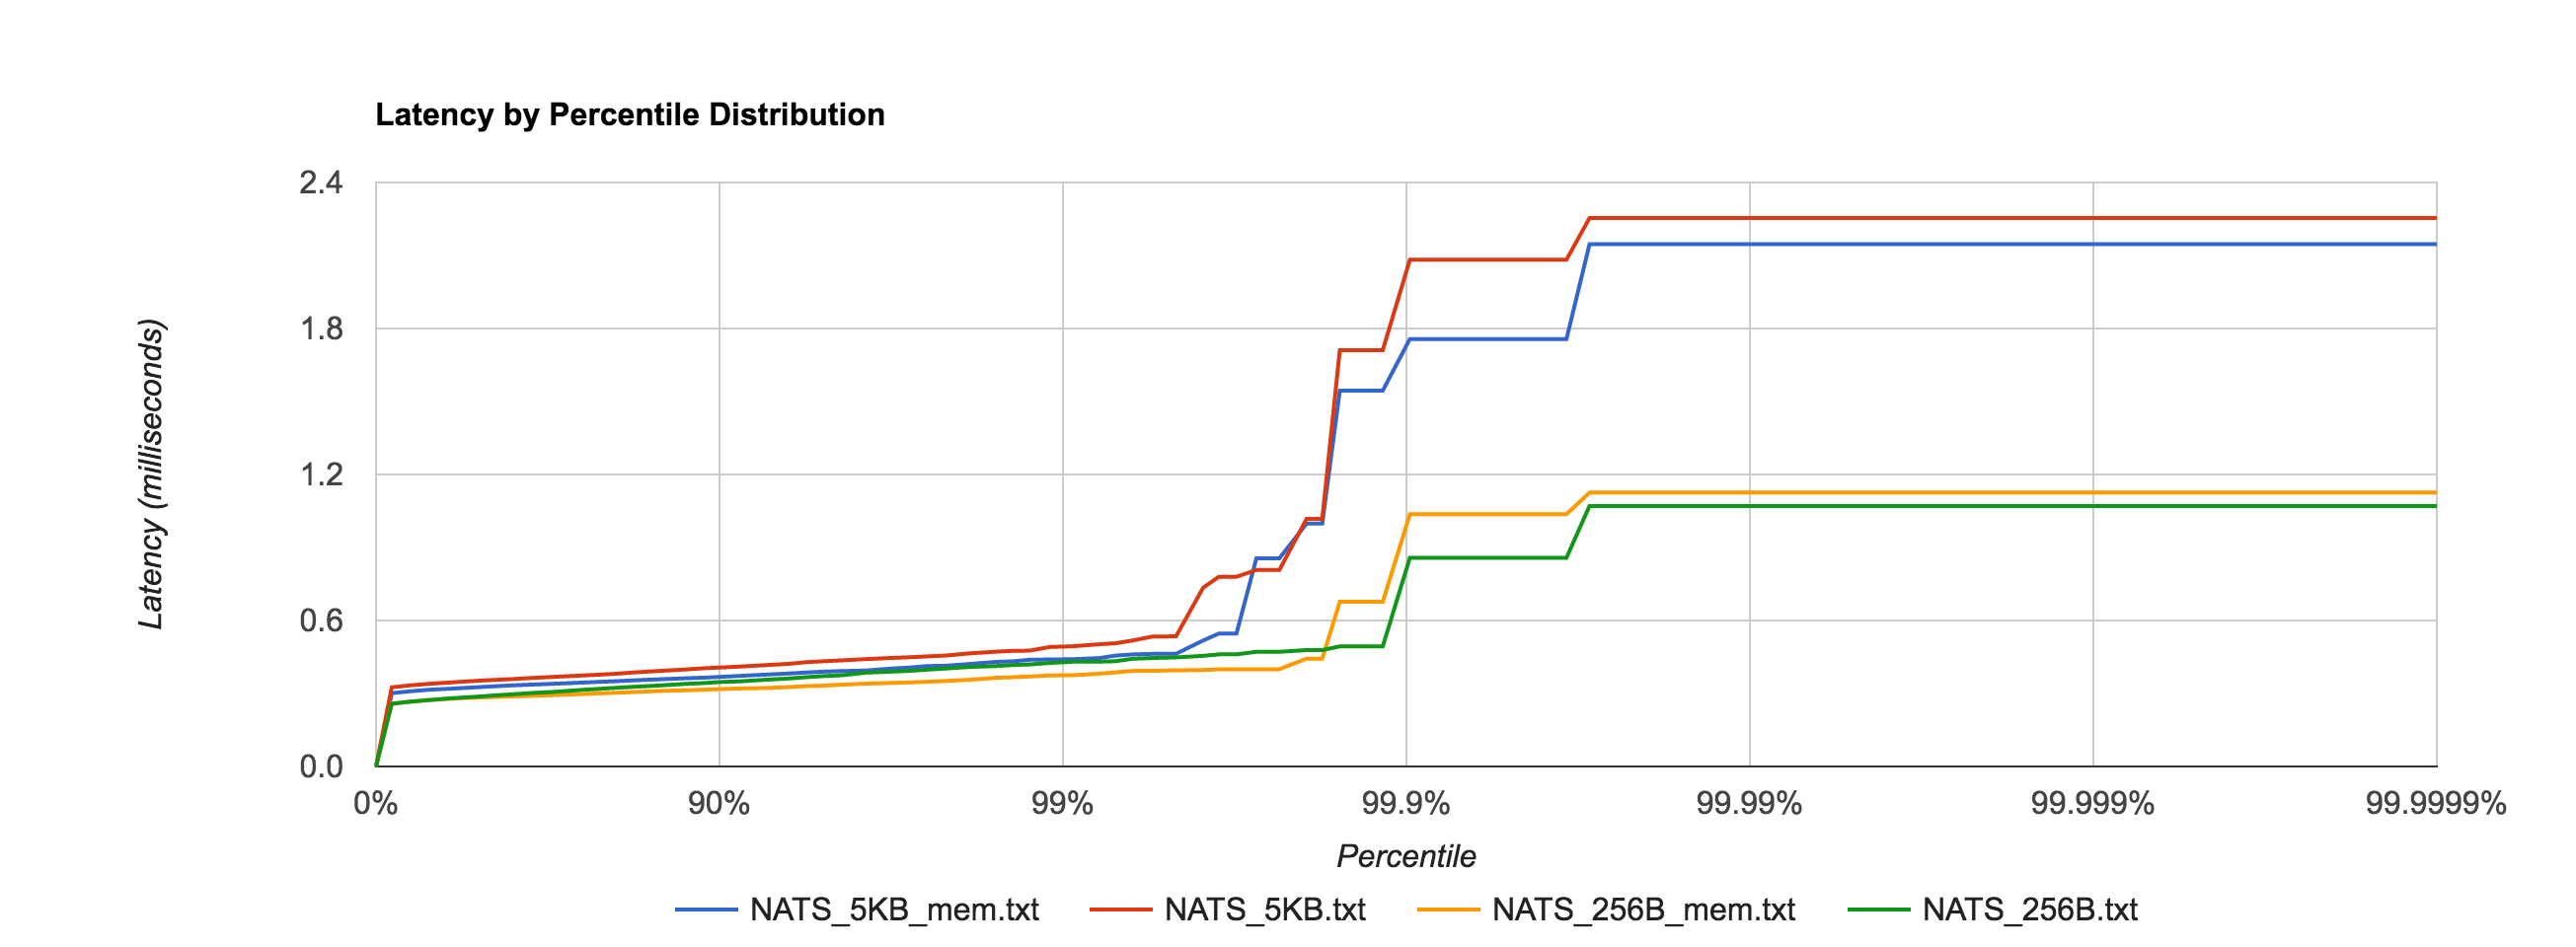
In fact, it’s now in line with the in-memory performance as before for 256B, 1KB, and 5KB messages, shown in the comparison below.

nats_file_mem

For a reason I have yet to figure out, the latency for 1MB messages is roughly an order of magnitude faster when fsync is enabled after the 95th percentile, which seems counterintuitive. If anyone has an explanation, I would love to hear it. I’m sure there’s a good debug story there. The distribution below shows the 1MB configuration for NATS Streaming with and without fsync enabled and just how big the difference is at the 95th percentile and beyond.

nats_file_mem_1mb

NATS Streaming 0.3.1 (file-backed persistence, –file_sync=false)

 Size 99% 99.9% 99.99% 99.999% 99.9999% 
256B 0.4304ms 0.8577ms 1.0706ms 1.0706ms 1.0706ms
1KB 0.4372ms 1.5987ms 1.8651ms 1.8651ms 1.8651ms
5KB 0.4939ms 2.0828ms 2.2540ms 2.2540ms 2.2540ms
1MB 1296.1464ms 1556.1441ms 1596.1457ms 1596.1457ms 1596.1457ms

Kafka with replication factor 1 tends to have higher latencies than NATS Streaming with –file_sync=false. There was one potential caveat here Ivan Kozlovic pointed out to me in that NATS Streaming uses a caching optimization for reads that may put it at an advantage.

Now, there is one side where NATS Streaming *may* be looking better and not fair to Kafka. By default, the file store keeps everything in memory once stored. This means look-ups will be fast. There is only a all-or-nothing mode right now, which means either cache everything or nothing. With caching disabled (–file_cache=false), every lookup will result in disk access (which when you have 1 to many subscribers will be bad). I am working on changing that. But if you do notice that in Kafka, consuming results in a disk read (given the other default behavior described above, they actually may not ;-)., then you could disable NATS Streaming file caching.

Fortunately, we can verify if Kafka is actually going to disk to read messages back from the log during the benchmark using iostat. We see something like this for the majority of the benchmark duration:

avg-cpu:  %user   %nice %system %iowait  %steal   %idle
          13.53    0.00   11.28    0.00    0.00   75.19

Device:    tps   Blk_read/s   Blk_wrtn/s   Blk_read   Blk_wrtn
xvda      0.00         0.00         0.00          0          0

Specifically, we’re interested in Blk_read, which indicates the total number of blocks read. It appears that Kafka does indeed make heavy use of the operating system’s page cache as Blk_wrtn and Blk_read rarely show any activity throughout the entire benchmark. As such, it seems fair to leave NATS Streaming’s –file_cache=true, which is the default.

One interesting point is Kafka offloads much of its caching to the page cache and outside of the JVM heap, clearly in an effort to minimize GC pauses. I’m not clear if the cache Ivan refers to in NATS Streaming is off-heap or not (NATS Streaming is written in Go which, like Java, is a garbage-collected language).

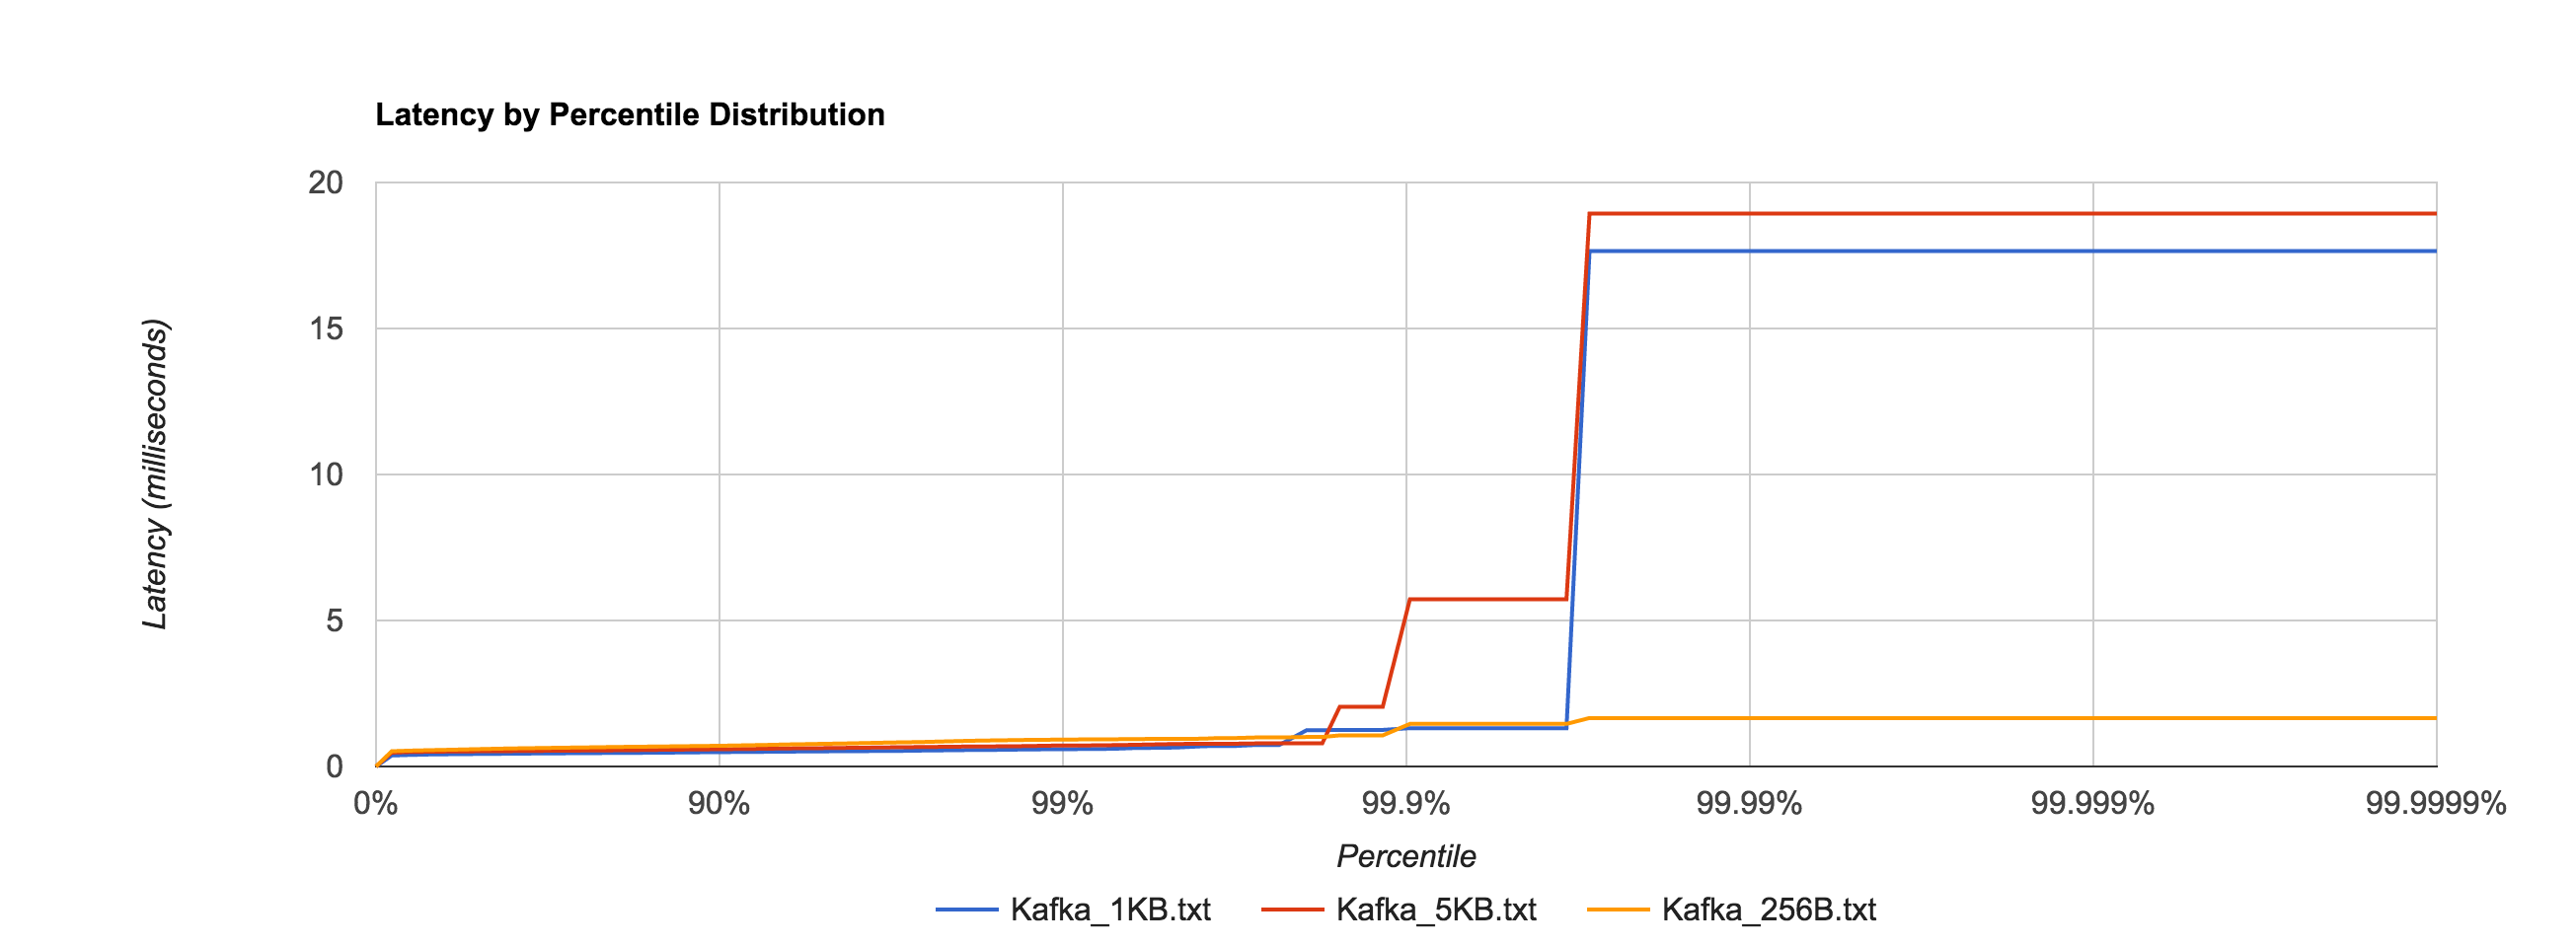
Below is the distribution of latencies for 256B, 1KB, and 5KB configurations in Kafka.

kafka

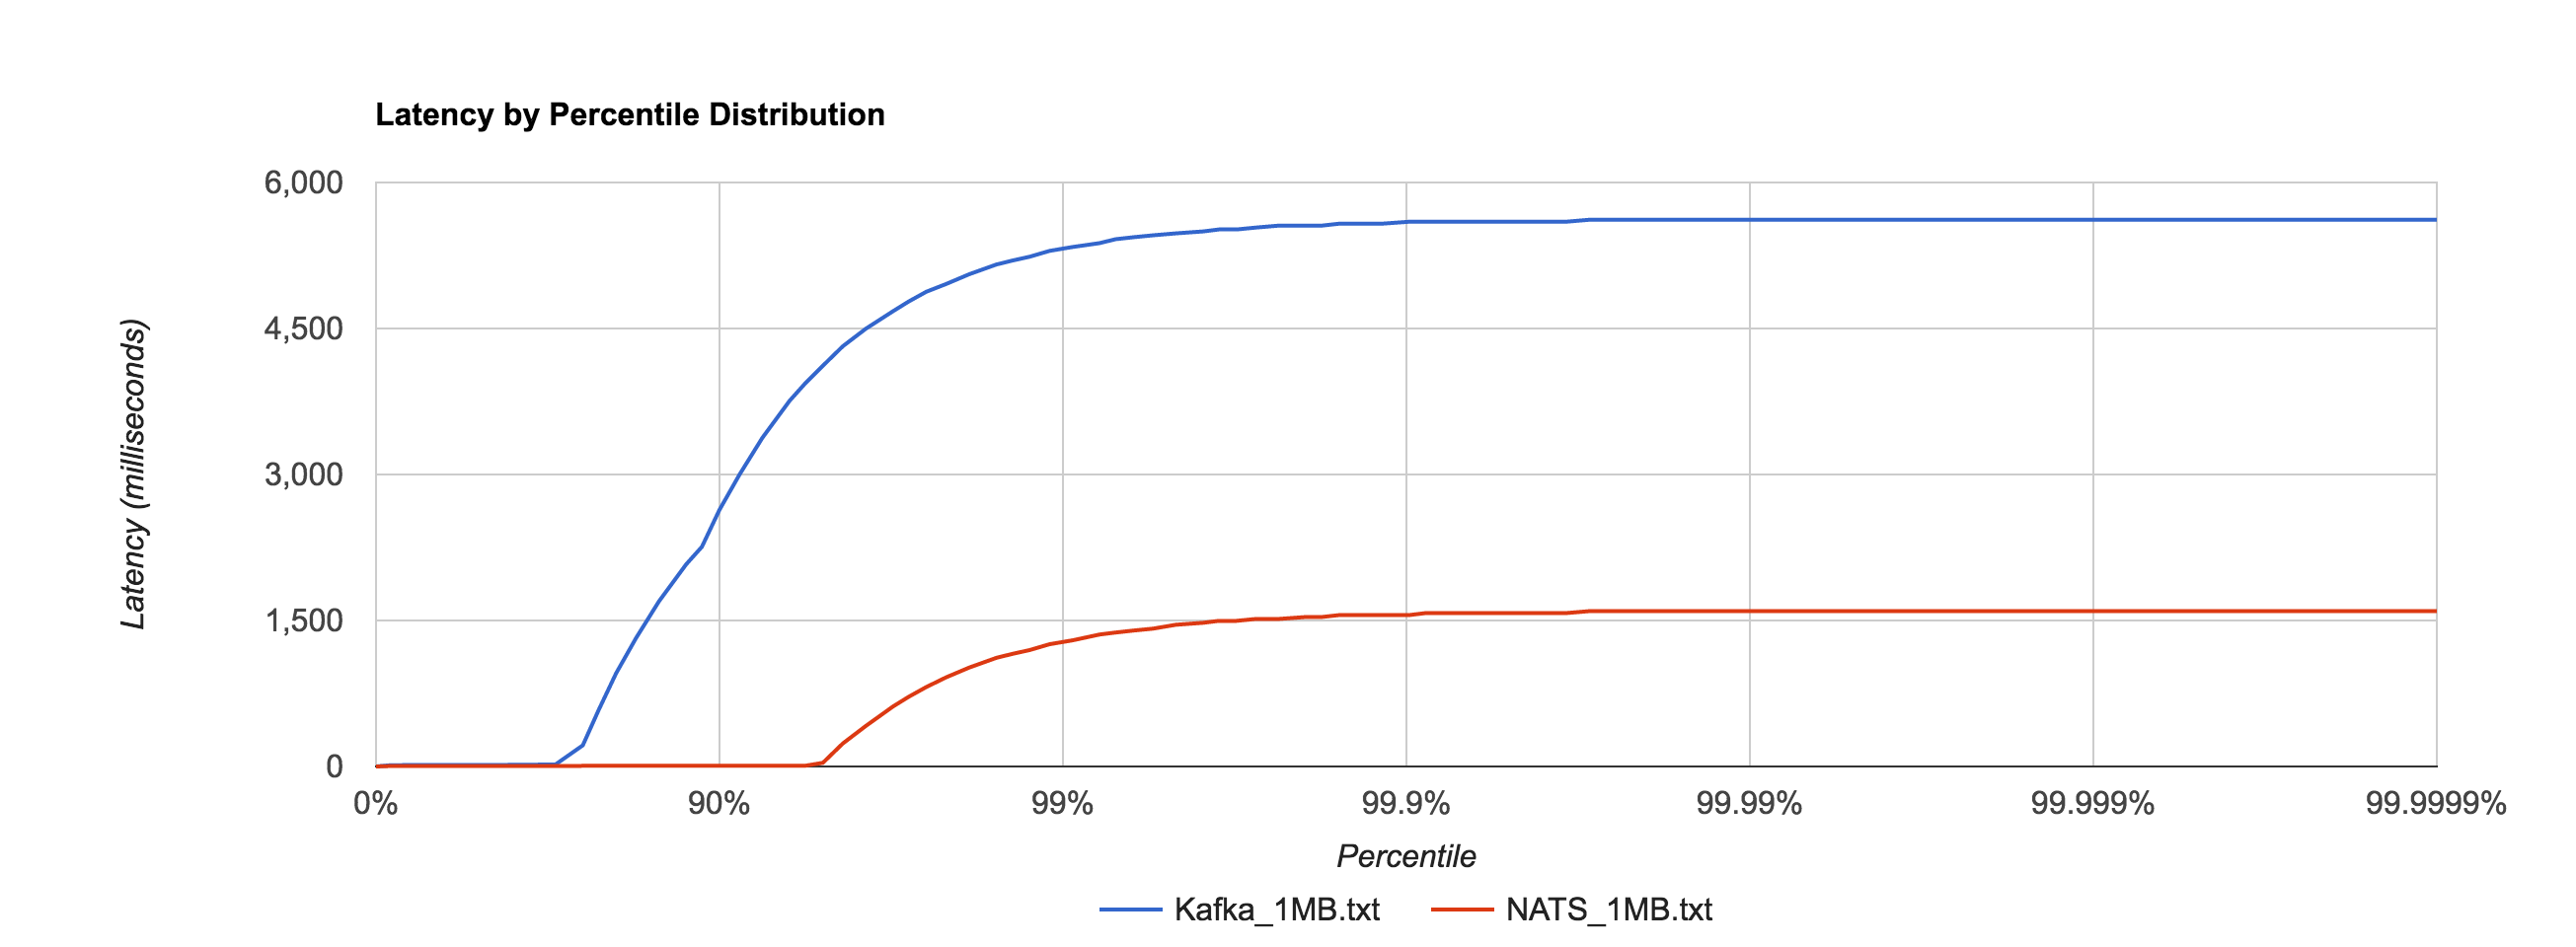
Similar to NATS Streaming, 1MB message latencies tend to be orders of magnitude worse after about the 80th percentile. The distribution below compares the 1MB configuration for NATS Streaming and Kafka.

nats_kafka_1mb

Kafka 0.10.1.0 (replication factor 1)

 Size 99% 99.9% 99.99% 99.999% 99.9999% 
256B 0.9230ms 1.4575ms 1.6596ms 1.6596ms 1.6596ms
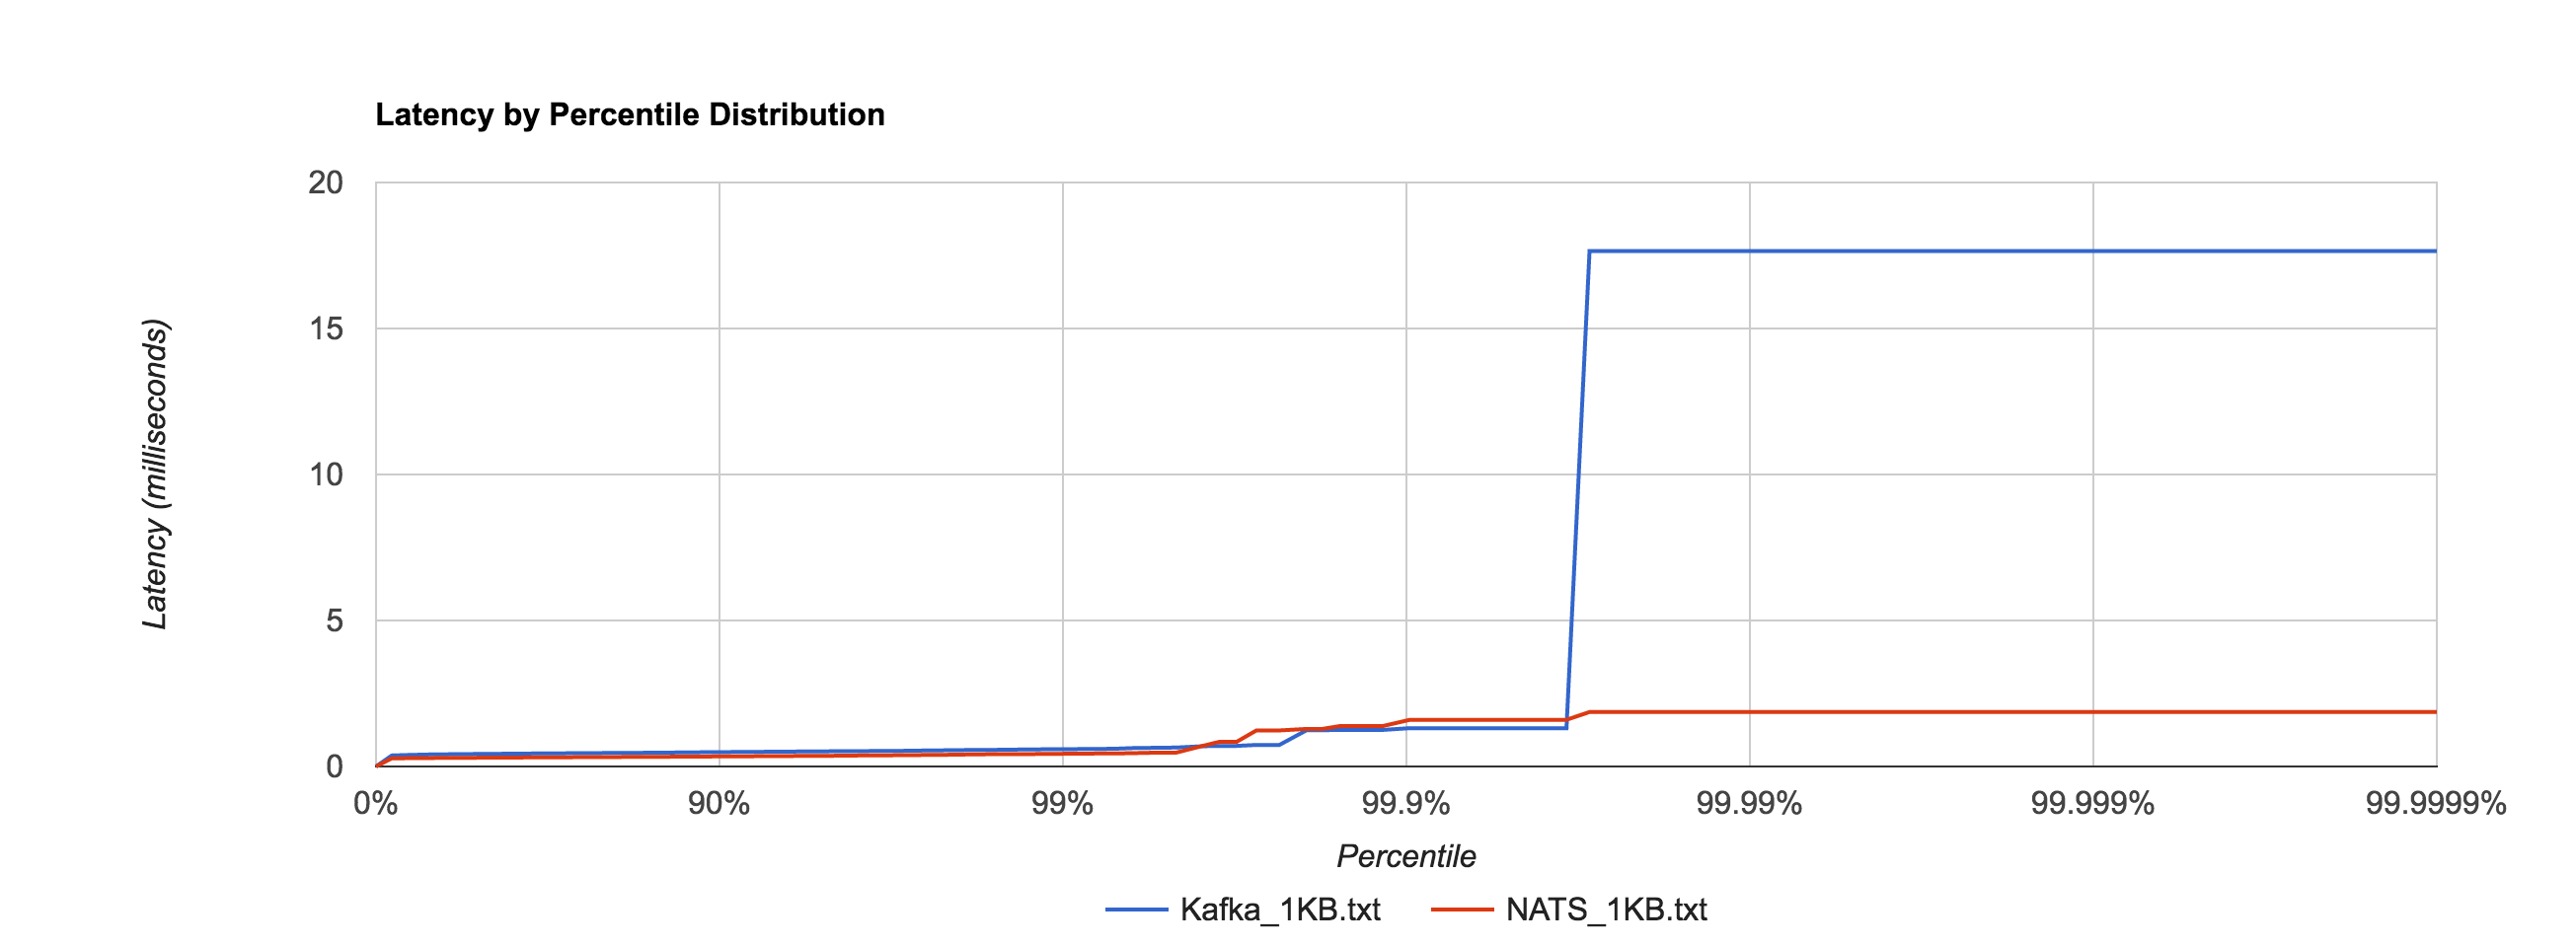
1KB 0.5942ms 1.3123ms 17.6556ms 17.6556ms 17.6556ms
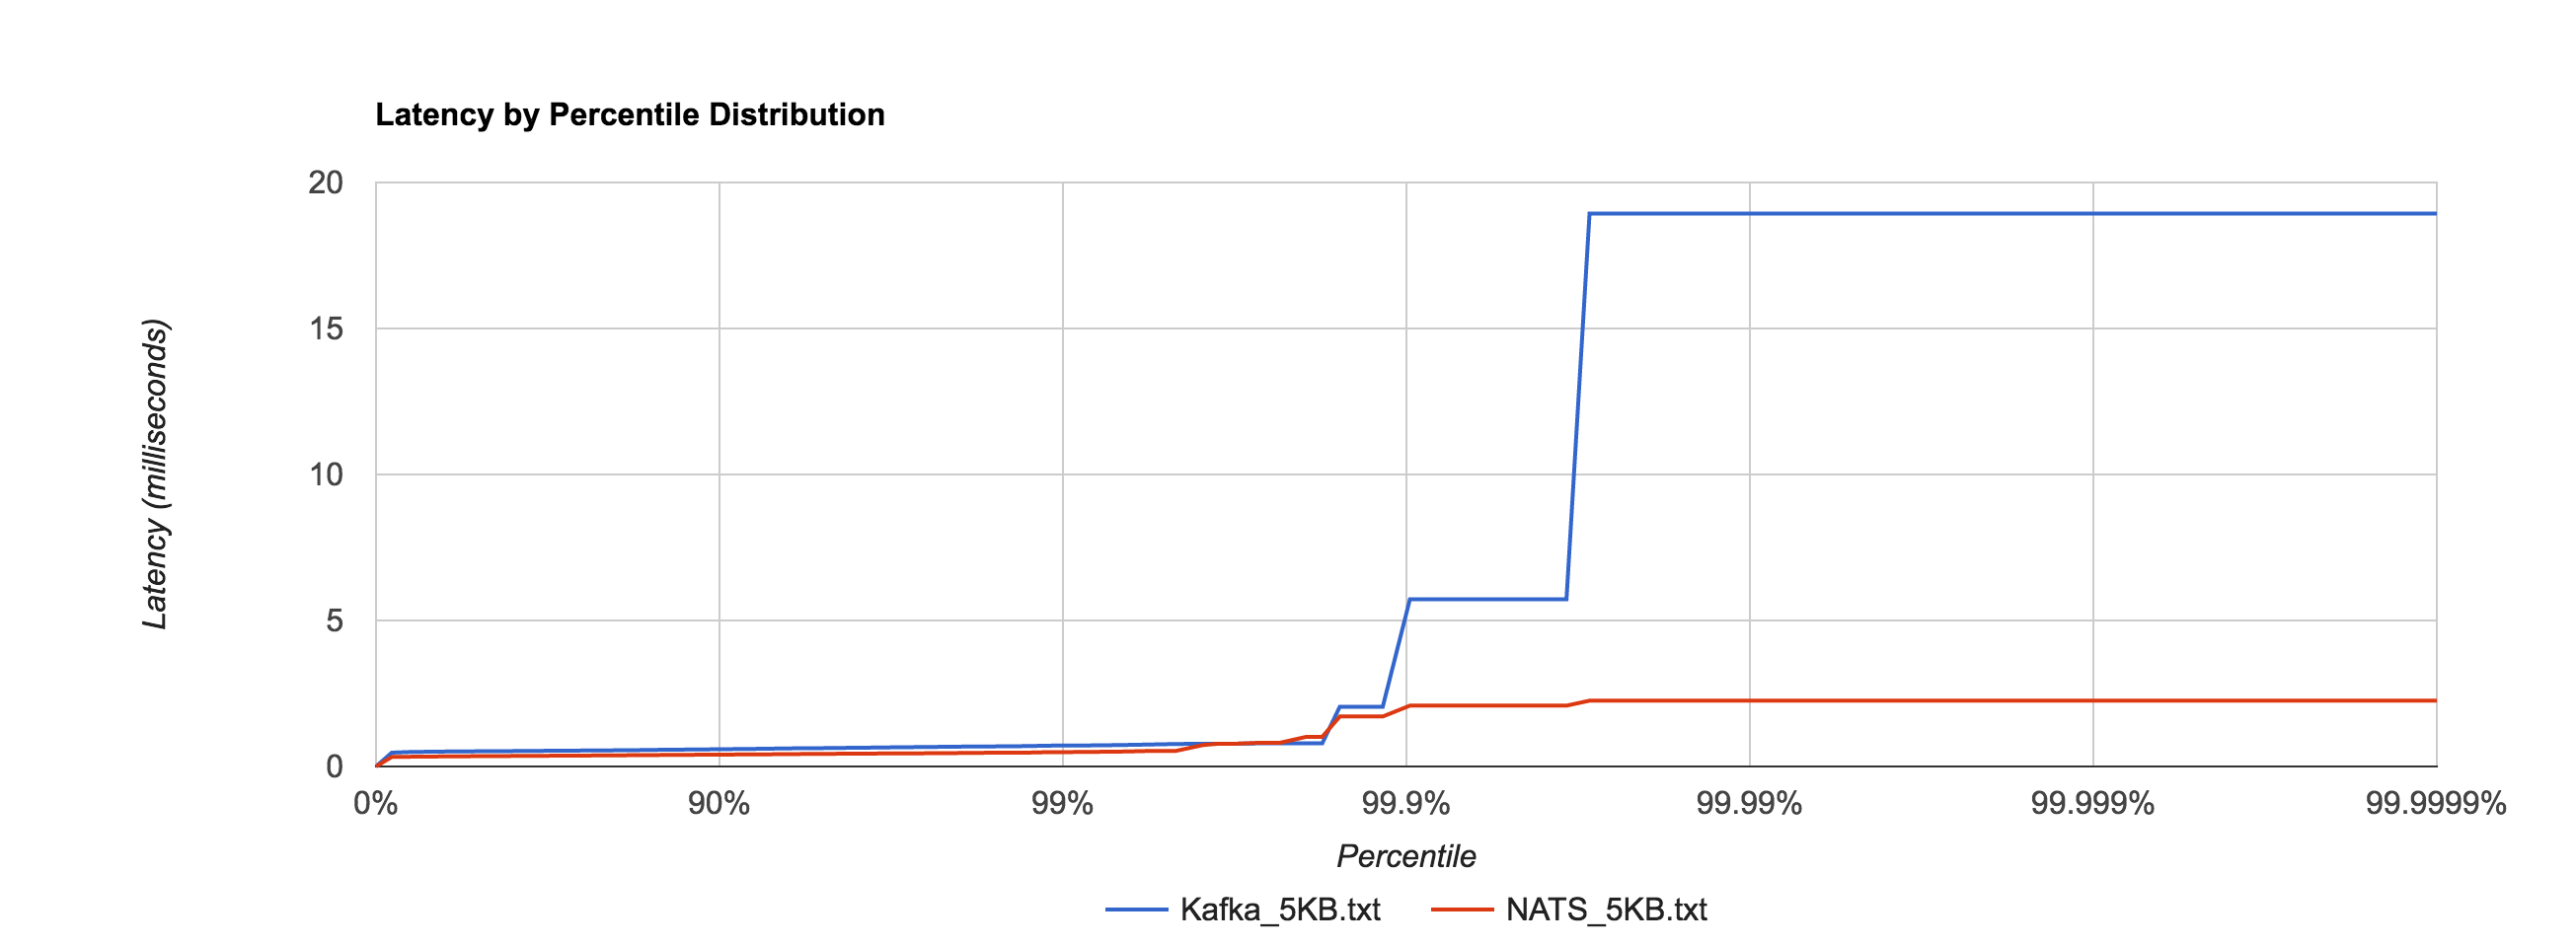
5KB 0.7203ms 5.7236ms 18.9334ms 18.9334ms 18.9334ms
1MB 5337.3174ms 5597.3315ms 5617.3199ms 5617.3199ms 5617.3199ms

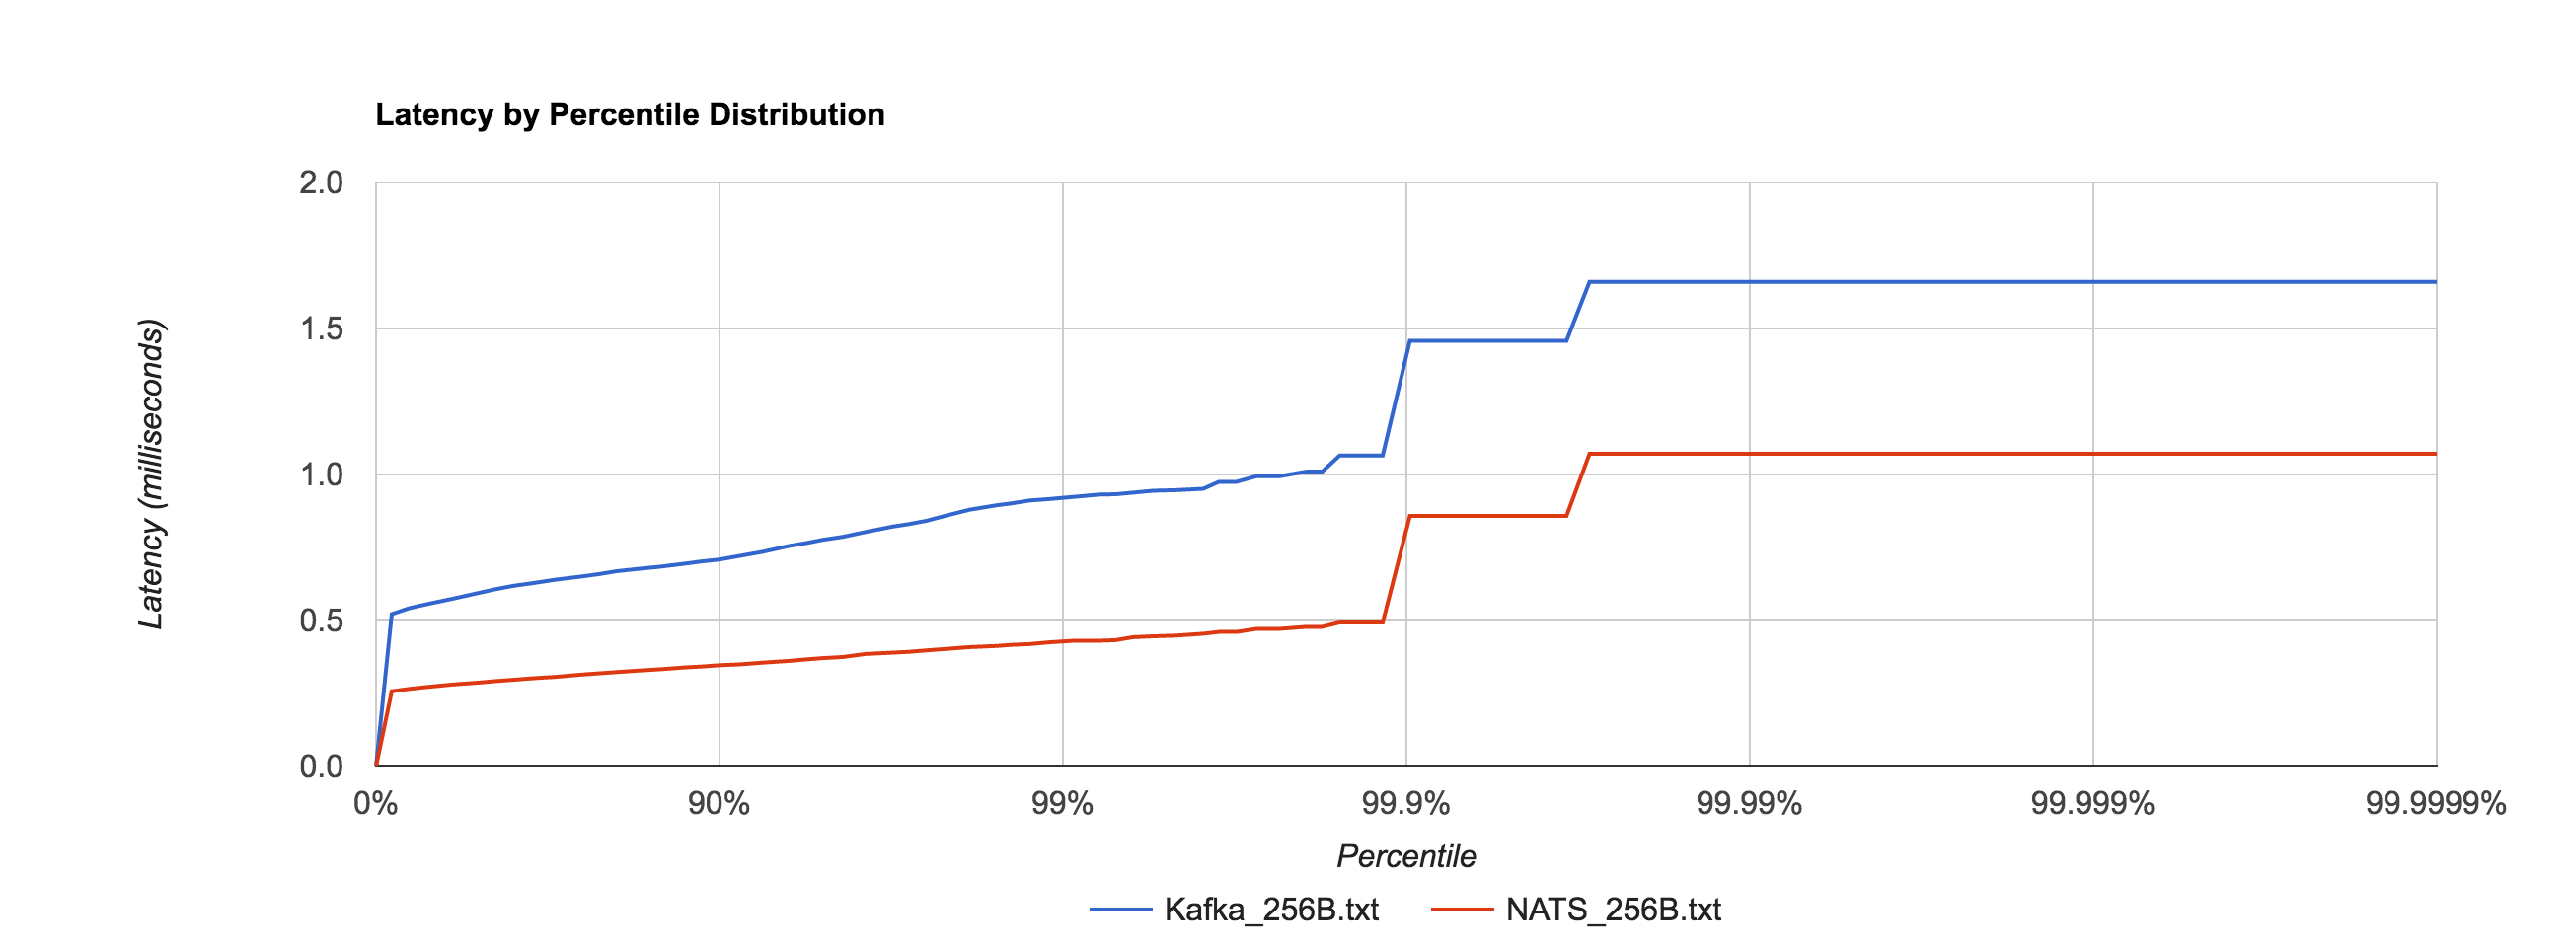
The percentile distributions below compare NATS Streaming and Kafka for the 256B, 1KB, and 5KB configurations, respectively.

nats_kafka_256b

nats_kafka_1kb

nats_kafka_5kb

Next, we’ll look at overall throughput for the two systems. This is done by publishing 100,000 messages using the same range of sizes as before and measuring the elapsed time. Specifically, we measure throughput at the publisher and the subscriber.

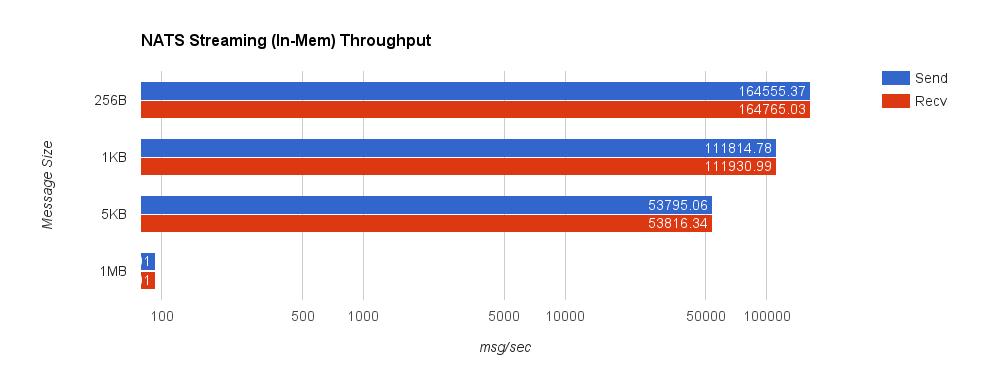
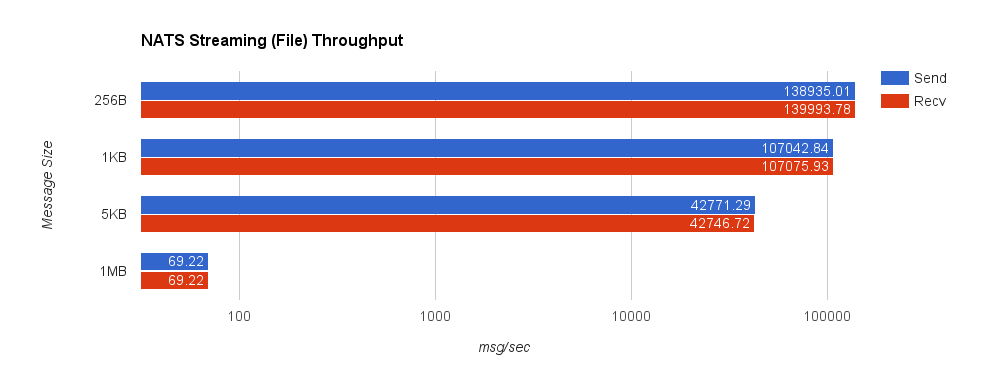
Despite using an asynchronous publisher in both the NATS Streaming and Kafka benchmarks, we do not consider the publisher “complete” until it has received acks for all published messages from the server. In Kafka, we do this by setting request.required.acks to 1, which means the leader replica has received the data, and consuming the received acks. This is important because the default value is 0, which means the producer never waits for an ack from the broker. In NATS Streaming, we provide an ack callback on every publish. We use the same benchmark configuration as the latency tests, separating load generation and consumption on different EC2 instances. Note the log scale in the following charts.

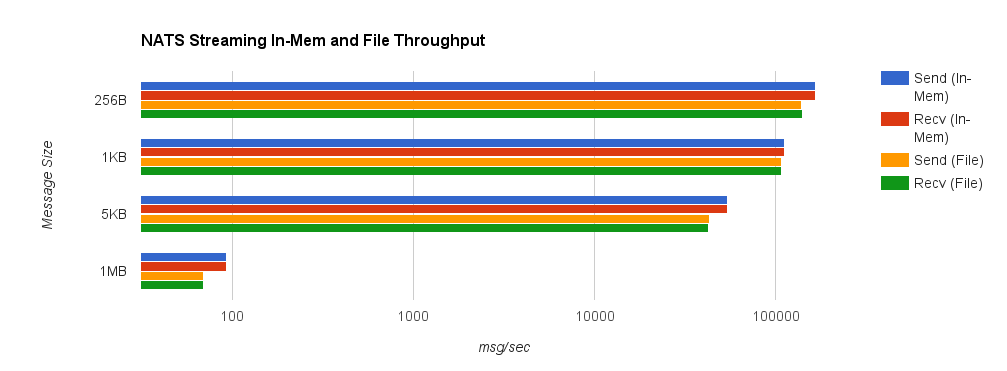
Once again, we’ll start by looking at NATS Streaming using in-memory persistence. The truncated 1MB send and receive throughputs are 93.01 messages/second.

nats_mem_throughput

For comparison, we now look at NATS Streaming with file persistence and –file_sync=false. As before, this provides the closest behavior to Kafka’s default flush behavior. The second chart shows a side-by-side comparison between NATS Streaming with in-memory and file persistence.

nats_file_throughput

nats_compare_throughput

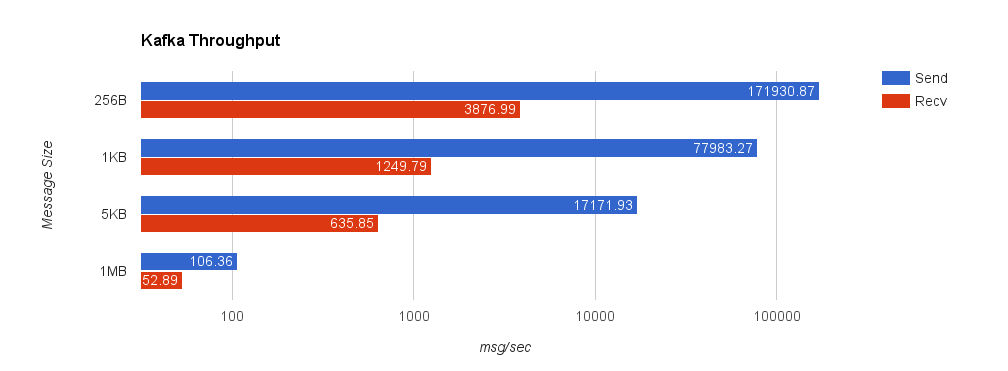
Lastly, we look at Kafka with replication factor 1. Throughput significantly deteriorates when we set request.required.acks = 1 since the producer must wait for all acks from the server. This is important though because, by default, the client does not require an ack from the server. If this were the case, the producer would have no idea how much data actually reached the server once it finished—it could simply be buffered in the client, in flight over the wire, or in the server but not yet on disk. Running the benchmark with request.required.acks = 0 yields much higher throughput on the sender but is basically an exercise in how fast you can write to a channel using the Sarama Go client—slightly misleading.

kafka_throughput

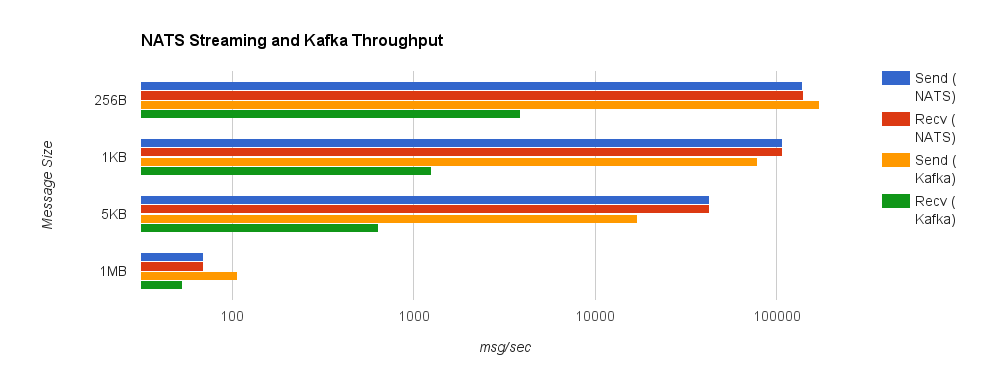
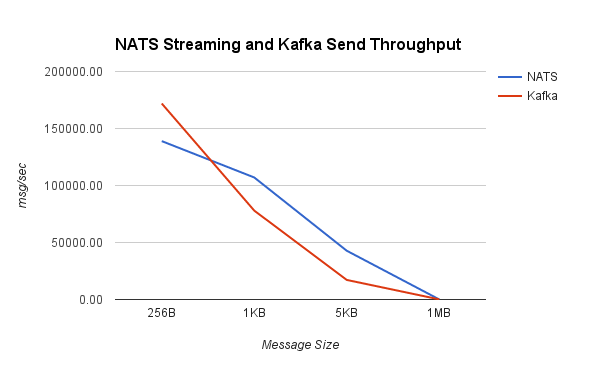
Looking at some comparisons of Kafka and NATS Streaming, we can see that NATS Streaming has higher throughput in all but a few cases.

nats_kafka_throughput

nats_kafka_send_throughput

I want to repeat the disclaimer from before: the purpose of this benchmark is to test drive the newly released NATS Streaming system (which as mentioned earlier, doesn’t yet support clustering), and put its performance into context by looking at a similar configuration of Kafka.

Kafka generally scales very well, so measuring the throughput of a single broker with a single producer and single consumer isn’t particularly meaningful. In reality, we’d be running a cluster with several brokers and partitioning our topics across them.

For as young as it is, NATS Streaming has solid performance (which shouldn’t come as much of a surprise considering the history of NATS itself), and I imagine it will only get better with time as the NATS team continues to optimize. In some ways, NATS Streaming bridges the gap between the commit log as made popular by Kafka and the conventional message queue as made popular by protocols like JMS, AMQP, STOMP, and the like.

The bigger question at this point is how NATS Streaming will tackle scaling and replication (a requirement for true production-readiness in my opinion). Kafka was designed from the ground up for high scalability and availability through the use of external coordination (read ZooKeeper). Naturally, there is a lot of complexity and cost that comes with that. NATS Streaming attempts to keep NATS’ spirit of simplicity, but it’s yet to be seen how it will reconcile that with the complex nature of distributed systems. I’m excited to see where Apcera takes NATS Streaming and generally the NATS ecosystem in the future since the team has a lot of experience in this area.