Security, Maintainability, Velocity: Choose One

There are three competing priorities that companies have as it relates to software development: security, maintainability, and velocity. I’ll elaborate on what I mean by each of these in just a bit. When I originally started thinking about this, I thought of it in the context of the “good, fast, cheap: choose two” project management triangle. But after thinking about it for more than a couple minutes, and as I related it to my own experience and observations at other companies, I realized that in practice it’s much worse. For most organizations building software, it’s more like security, maintainability, velocity: choose one.
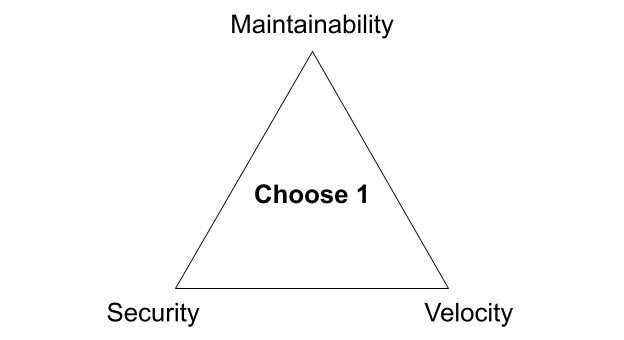
The Software Development Triangle

Of course, most organizations are not explicitly making these trade-offs. Instead, the internal preferences and culture of the company reveal them. I believe many organizations, consciously or not, accept this trade-off as an immovable constraint. More risk-averse groups might even welcome it. Though the triangle most often results in a “choose one” sort of compromise, it’s not some innate law. You can, in fact, have all three with a little bit of careful thought and consideration. And while reality is always more nuanced than what this simple triangle suggests, I find looking at the extremes helps to ground the conversation. It emphasizes the natural tension between these different concerns. Bringing that tension to the forefront allows us to be more intentional about how we manage it.

It wasn’t until recently that I distilled down these trade-offs and mapped them into the triangle shown above, but we’ve been helping clients navigate this exact set of competing priorities for over six years at Real Kinetic. We built Konfig as a direct response to this since it was such a common challenge for organizations. We’re excited to offer a solution which is the culmination of years of consulting and which allows organizations to no longer compromise, but first let’s explore the trade-offs I’m talking about.

Security

Companies, especially mid- to large- sized organizations, care a great deal about security (and rightfully so!). That’s not to say startups don’t care about it, but the stakes are just much higher for enterprises. They are terrified of being the next big name in the headlines after a major data breach or ransomware attack. I call this priority security for brevity, but it actually consists of two things which I think are closely aligned: security and governance.

Governance directly supports security in addition to a number of other concerns like reliability, risk management, and compliance. This is sometimes referred to as Governance, Risk, and Compliance or GRC. Enterprises need control over, and visibility into, all of the pieces that go into building and delivering software. This is where things like SDLC, separation of duties, and access management come into play. Startups may play it more fast and loose, but more mature organizations frequently have compliance or regulatory obligations like SOC 2 Type II, PCI DSS, FINRA, FedRAMP, and so forth. Even if they don’t have regulatory constraints, they usually have a reputation that needs to be protected, which typically means more rigid processes and internal controls. This is where things can go sideways for larger organizations as it usually leads to practices like change review boards, enterprise (ivory tower) architecture programs, and SAFe. Enterprises tend to be pretty good at governance, but it comes at a cost.

It should come as no surprise that security and governance are in conflict with speed, but they are often in contention with well-architected and maintainable systems as well. When organizations enforce strong governance and security practices, it can often lead to developers following bad practices. Let me give an example I have seen firsthand at an organization.

A company has been experiencing stability and reliability issues with its software systems. This has caused several high-profile, revenue-impacting outages which have gotten executives’ attention. The response is to implement a series of process improvements to effectively slow down the release of changes to production. This includes a change review board to sign-off on changes going to production and a production gating process which new workloads going to production must go through before they can be released. The hope is that these process changes will reduce defects and improve reliability of systems in production. At this point, we are wittingly trading off velocity.

What actually happened is that developers began batching up more and more changes to get through the change review board which resulted in “big bang” releases. This caused even more stability issues because now large sets of changes were being released which were increasingly complex, difficult to QA, and harder to troubleshoot. Rollbacks became difficult to impossible due to the size and complexity of releases, increasing the impact of defects. Release backlogs quickly grew, prompting developers to move on to more work rather than sit idle, which further compounded the issue and led to context switching. Decreasing the frequency of deployments only exacerbated these problems. Counterintuitively, slowing down actually increased risk.

To avoid the production gating process, developers began adding functionality to existing services which, architecturally speaking, should have gone into new services. Services became bloated grab bags of miscellaneous functionality since it was easier to piggyback features onto workloads already in production than it was to run the gauntlet of getting a new service to production. These processes were directly and unwittingly impacting system architecture and maintainability. In economics, this is called a “negative externality.” We may have security and governance, but we’ve traded off velocity and maintainability. Adding insult to injury, the processes were not even accomplishing the original goal of improving reliability, they were making it worse!

Maintainability

It’s critical that software systems are not just built to purpose, but also built to last. This means they need to be reliable, scalable, and evolvable. They need to be conducive to finding and correcting bugs. They need to support changing requirements such that new features and functionality can be delivered rapidly. They need to be efficient and cost effective. More generally, software needs to be built in a way that maximizes its useful life.

We simply call this priority maintainability. While it covers a lot, it can basically be summarized as: is the system architected and implemented well? Is it following best practices? Is there a lot of tech debt? How much thought and care has been put into design and implementation? Much of this comes down to gut feel, but an experienced engineer can usually intuit whether or not a system is maintainable pretty quickly. A good proxy can often be the change fail rate, mean time to recovery, and the lead time for implementing new features.

Maintainability’s benefits are more of a long tail. A maintainable system is easier to extend and add new features later, easier to identify and fix bugs, and generally experiences fewer defects. However, the cost for that speed is basically frontloaded. It usually means moving slower towards the beginning while reaping the rewards later. Conversely, it’s easy to go fast if you’re just hacking something together without much concern for maintainability, but you will likely pay the cost later. Companies can become crippled by tech debt and unmaintained legacy systems to the point of “bankruptcy” in which they are completely stuck. This usually leads to major refactors or rewrites which have their own set of problems.

Additionally, building systems that are both maintainable and secure can be surprisingly difficult, especially in more dynamic cloud environments. If you’ve ever dealt with IAM, for example, you know exactly what I mean. Scoping identities with the right roles or permissions, securely managing credentials and secrets, configuring resources correctly, ensuring proper data protections are in place, etc. Misconfigurations are frequently the cause of the major security breaches you see in the headlines. The unfortunate reality is security practices and tooling lag in the industry, and security is routinely treated as an afterthought. Often it’s a matter of “we’ll get it working and then we’ll come back later and fix up the security stuff,” but later never happens. Instead, an IAM principal is left with overly broad access or a resource is configured improperly. This becomes 10x worse when you are unfamiliar with the cloud, which is where many of our clients tend to find themselves.

Velocity

The last competing priority is simply speed to production or velocity. This one probably requires the least explanation, but it’s consistently the priority that is sacrificed the most. In fact, many organizations may even view it as the enemy of the first two priorities. They might equate moving fast with being reckless. Nonetheless, companies are feeling the pressure to deliver faster now more than ever, but it’s much more than just shipping quickly. It’s about developing the ability to adapt and respond to changing market conditions fast and fluidly. Big companies are constantly on the lookout for smaller, more nimble players who might disrupt their business. This is in part why more and more of these companies are prioritizing the move to cloud. The data center has long been their moat and castle as it relates to security and governance, however, and the cloud presents a new and serious risk for them in this space. As a result, velocity typically pays the price.

As I mentioned earlier, velocity is commonly in tension with maintainability as well, it’s usually just a matter of whether that premium is frontloaded or backloaded. More often than not, we can choose to move quickly up front but pay a penalty later on or vice versa. Truthfully though, if you’ve followed the DORA State of DevOps Reports, you know that a lot of companies neither frontload nor backload their velocity premium—they are just slow all around. These are usually more legacy-minded IT shops and organizations that treat software development as an IT cost center. These are also usually the groups that bias more towards security and governance, but they’re probably the most susceptible to disruption. “Move fast and break things” is not a phrase you will hear permeating these organizations, yet they all desire to modernize and accelerate. We regularly watch these companies’ teams spend months configuring infrastructure, and what they construct is often complex, fragile, and insecure.

Choose Three

Businesses today are demanding strong security and governance, well-structured and maintainable infrastructure, and faster speed to production. The reality, however, is that these three priorities are competing with each other, and companies often end up with one of the priorities dominating the others. If we can acknowledge these trade-offs, we can work to better understand and address them.

We built Konfig as a solution that tackles this head-on by providing an opinionated configuration of Google Cloud Platform and GitLab. Most organizations start from a position where they must assemble the building blocks in a way that allows them to deliver software effectively, but their own biases result in a solution that skews one way or the other. Konfig instead provides a turnkey experience that minimizes time-to-production, is secure by default, and has governance and best practices built in from the start. Rather than having to choose one of security, maintainability, and velocity, don’t compromise—have all three. In a follow-up post I’ll explain how Konfig addresses concerns like security and governance, infrastructure maintainability, and speed to production in a “by default” way. We’ll see how IAM can be securely managed for us, how we can enforce architecture standards and patterns, and how we can enable developers to ship production workloads quickly by providing autonomy with guardrails and stable infrastructure.

Getting big wins with small teams on tight deadlines

Part of what we do at Real Kinetic is give companies confidence to ship software in the cloud. Many of our clients are large organizations that have been around for a long time but who don’t always have much experience when it comes to cloud. Others are startups and mid-sized companies who may have some experience, but might just want another set of eyes or are looking to mature some of their practices. Whatever the case, one of the things we frequently talk to our clients about is the value of both serverless and managed services. We have found that these are critical to getting big wins with small teams on tight deadlines in the cloud. Serverless in particular has been key to helping clients get some big wins in ways others didn’t think possible.

We often get pulled into a company to help them develop and launch new products in the cloud. These are typically high-profile projects with tight deadlines. These deadlines are almost always in terms of months, usually less than six. As a result, many of the executives and managers we talk to in these situations are skeptical of their team’s ability to execute on these types of timeframes. Whether it’s lack of cloud experience, operations and security concerns, compliance issues, staffing constraints, or some combination thereof, there’s always a reason as to why it can’t be done.

And then, some months later, it gets done.

Mental Model of the Cloud

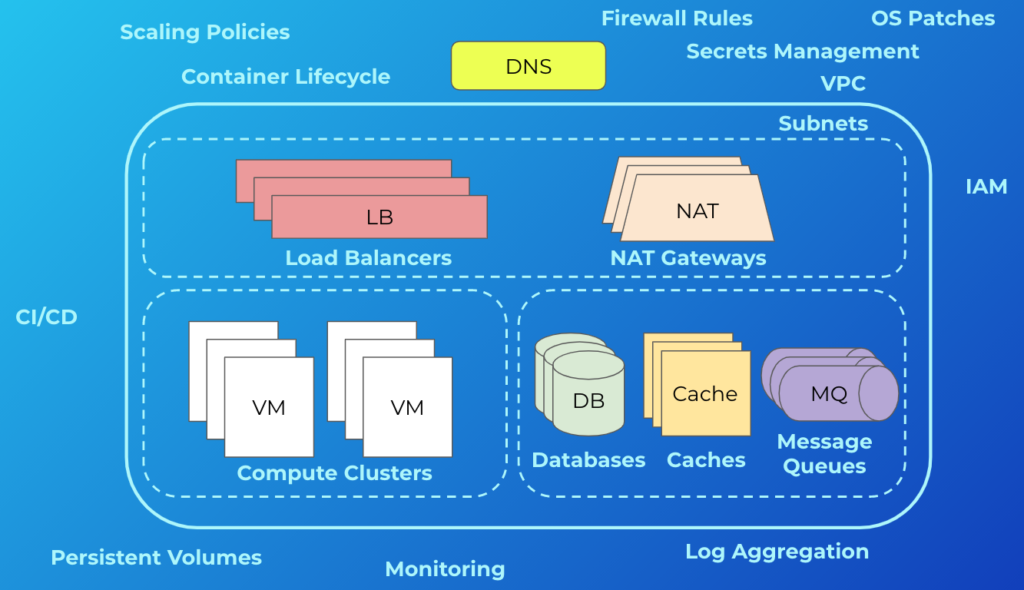
The skepticism is valid. Often people’s mental model of the cloud is something like this:

A subset of typical cloud infrastructure concerns

More often than not, this is what cloud infrastructure looks like. In addition to what’s shown, there are other concerns. These include things like managing backups and disaster recovery, multi-zone or regional deployments, VM images, and reserved instances. It can be deceiving because simply getting an app running in this environment isn’t terribly difficult, and most engineers will tell you that—these are the “day-one” costs. But engineers don’t tend to be the best at giving estimates while still undervaluing their own time. The minds of most seasoned managers, however, will usually go to the “day-two” costs—what are the ongoing maintenance and operations costs, the security and compliance considerations, and the staffing requirements? This is why we consistently see so much skepticism. If this is also your initial foray into the cloud, that’s a lot of uncertainty! A manager’s job, after all, is to reduce uncertainty.

We’ve been there. We’ve also had to manage those day-two costs. I’ve personally gone through the phases of building a complex piece of software in the cloud, having to maintain one, having to manage a team responsible for one, and having to help a team go through the same process as an outside consultant. Getting that perspective has helped me develop an appreciation for what it really means to ship software. It’s why we like to take a different tack at Real Kinetic when it comes to cloud.

We are big on picking a cloud platform and going all-in on it. Whether it’s AWS, GCP, or Azure—pick your platform, embrace its capabilities, and move on. That doesn’t mean there isn’t room to use multiple clouds. Some platforms are better than others in different areas, such as data analytics or machine learning, so it’s wise to leverage the strengths of each platform where it makes sense. This is especially true for larger organizations who will inevitably span multiple clouds. What we mean by going “all-in” on a platform, particularly as it relates to application development, is sidestepping the trap that so many organizations fall intohedging their bets. For a variety of reasons, many companies will take a half measure when adopting a cloud platform by avoiding things like managed services and serverless. Vendor lock-in is usually at the top of their list of concerns. Instead, they end up with something akin to the diagram above, and in doing so, lose out on the differentiated benefits of the platform. They also incur significantly more day-two costs.

The Value and Cost of Serverless

We spend a lot of time talking to our clients about this trade-off. With managers, it usually resonates when we ask if they want their people focusing on shipping business value or doing commodity work. With engineers, architects, or operations folks, it can be more contentious. On more than a few occasions, we’ve talked clients out of using Kubernetes for things that were well-suited to serverless platforms. Serverless is not the right fit for everything, but the reality is many of the workloads we encounter are primarily CRUD-based microservices. These can be a good fit for platforms like AWS Lambda, Google App Engine, or Google Cloud Run. The organizations we’ve seen that have adopted these services for the correct use cases have found reduced operations investment, increased focus on shipping things that matter to the business, accelerated delivery of new products, and better cost efficiency in terms of infrastructure utilization.

If vendor lock-in is your concern, it’s important to understand both the constraints and the trade-offs. Not all serverless platforms are created equal. Some are highly opinionated, others are not. In the early days, Google App Engine was highly opinionated, requiring you to use its own APIs to build your application. This meant moving an application built on App Engine was no small feat. Today, that is no longer the case; the new App Engine runtimes allow you to run just about any application. Cloud Run, a serverless container platform, allows you to deploy a container that can run anywhere. The costs are even less. On the other hand, using a serverless database like Cloud Firestore or DynamoDB requires using a proprietary API, but APIs can be abstracted.

In order to decide if the trade-off makes sense, you need to determine three things:

  1. What is the honest likelihood you’ll need to move in the future?
  2. What are the switching costs—the amount of time and effort needed to move?
  3. What is the value you get using the solution?

These are not always easy things to determine, but the general rule is this: if the value you’re getting offsets the switching costs times the probability of switching—and it often does—then it’s not worth trying to hedge your bet. There can be a lot of hidden considerations, namely operations and development overhead and opportunity costs. It can be easy to forget about these when making a decision. In practice, vendor lock-in tends to be less about code portability and more about capability lock-in—think things like user management, Identity and Access Management, data management, cloud-specific features and services, and so forth. These are what make switching hard, not code.

Another concern we commonly hear with serverless is cost. In our experience, however, this is rarely an issue for appropriate use cases. While serverless can be more expensive in terms of cloud spend for some situations, this cost is normally offset by the reduced engineering and ongoing operations costs. Using serverless and managed services for the right things can be quite cost-effective. This may not always hold true, such as for large organizations who can negotiate with providers for committed cloud spend, but for many cases it makes sense.

Serverless isn’t just about compute. While people typically associate serverless with things like Lambda or Cloud Functions, it actually extends far beyond this. For example, in addition to its serverless compute offerings (Cloud Run, Cloud Functions, and App Engine), GCP has serverless storage (Cloud Storage, Firestore, and Datastore), serverless integration components (Cloud Tasks, Pub/Sub, and Scheduler), and serverless data and machine learning services (BigQuery, AutoML, and Dataflow). While each of these services individually offers a lot of value, it’s not until we start to compose them together in different ways where we really see the value of serverless appear.

Serverless vs. Managed Services

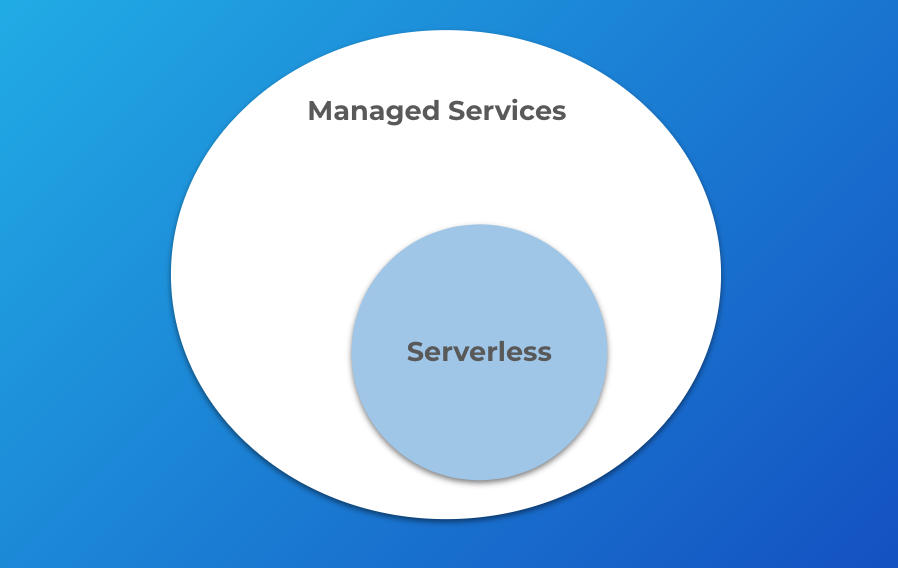
Some might consider the services I mentioned above “managed services”, so let me clarify that. We generally talk about “serverless” being the idea that the cloud provider fully manages and maintains the server infrastructure. This means the notion of “managed services” and “serverless” are closely related, but they are also distinct.

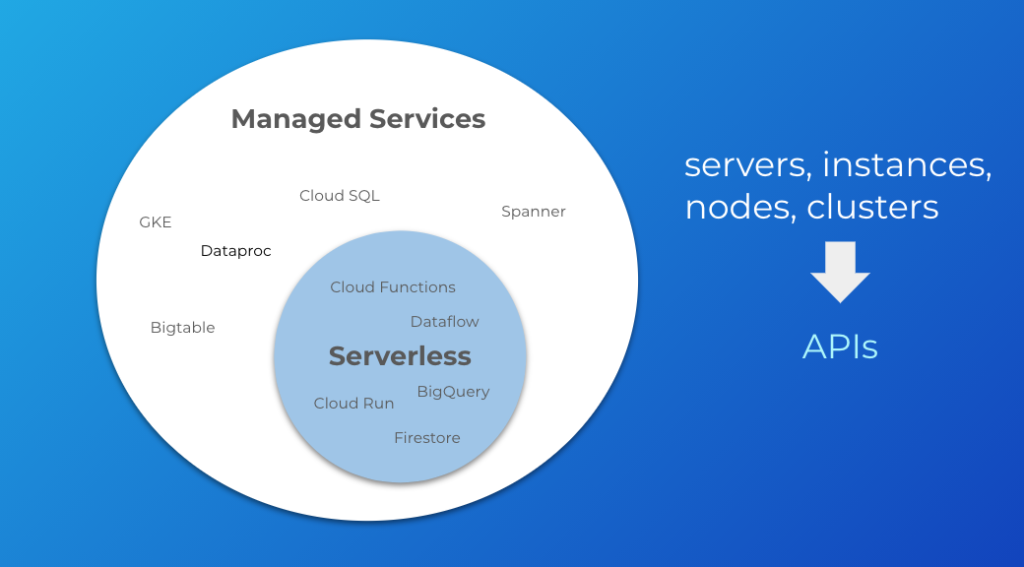
A serverless product is also managed, but not all managed services are serverless. That is to say, serverless is a subset of managed services.

Serverless means you stop thinking about the concept of servers in your architecture. This broadly encompasses words like “servers”, “instances”, “nodes”, and “clusters.” Continuing with our GCP example, these words would be associated with products like GKE, Dataproc, Bigtable, Cloud SQL, and Spanner. These services are decidedly not serverless because they entail some degree of managing and configuring servers or clusters, even though they are managed services.

Instead, you start thinking in terms of APIs and services. This would be things like Cloud Functions, Dataflow, BigQuery, Cloud Run, and Firestore. These have no servers or clusters. They are simply APIs that you interact with to build your applications. They are more specialized managed services.

Why does this distinction matter? It matters because of the ramifications it has for where we invest our time. Managing servers and clusters is going to involve a lot more operations effort, even if the base infrastructure is managed by the cloud provider. Much of this work can be considered “commodity.” It is not work that differentiates the business. This is the trade-off of getting more control—we take on more responsibility. In rough terms, the managed services that live outside of the serverless circle are going to be more in the direction of “DevOps”, meaning they will involve more operations overhead. The managed services inside the serverless circle are going to be more in the direction of “NoOps”. There is still work involved in using them, but the line of responsibility has moved upwards with the cloud provider responsible for more. We get less control over the infrastructure, but that means we can focus more on the business outcomes we develop on top of that infrastructure.

In fairness, it’s not always a black-and-white determination. Things can get a little blurry since serverless might still provide some degree of control over runtime parameters like memory or CPU, but this tends to be limited in comparison to managing a full server. There might also be some notion of “instances”, as in the case of App Engine, but that notion is much more abstract. Finally, some services appear to straddle the line between managed service and serverless. App Engine Flex, for instance, allows you to SSH into its VMs, but you have no real control over them. It’s a heavily sandboxed environment.

Why Serverless?

Serverless enables focusing on business outcomes. By leveraging serverless offerings across cloud platforms, we’ve seen product launches go from years to months (and often single-digit months). We’ve seen release cycles go from weeks to hours. We’ve seen development team sizes go from double digits to a few people. We’ve seen ops teams go from dozens of people to just one or two. It’s allowed these people to focus on more differentiated work. It’s given small teams of people a significant amount of leverage.

It’s no secret. Serverless is how we’ve helped many of our clients at Real Kinetic get big wins with small teams on tight deadlines. It’s not always the right fit and there are always trade-offs to consider. But if you’re not at least considering serverless—and more broadly, managed services—then you’re not getting the value you should be getting out of your cloud platform. Keep in mind that it doesn’t have to be all or nothing. Find the places where you can leverage serverless in combination with managed services or more traditional infrastructure. You too will be surprising and impressing your managers and leadership.

Microservice Observability, Part 2: Evolutionary Patterns for Solving Observability Problems

In part one of this series, I described the difference between monitoring and observability and why the latter starts to become more important when dealing with microservices. Next, we’ll discuss some strategies and patterns for implementing better observability. Specifically, we’ll look at the idea of an observability pipeline and how we can start to iteratively improve observability in our systems.

To recap, observability can be described simply as the ability to ask questions of your systems without knowing those questions in advance. This requires capturing a variety of signals such as logs, metrics, and traces as well as tools for interpreting those signals like log analysis, SIEM, data warehouses, and time-series databases. A number of challenges surface as a result of this. Clint Sharp does a great job discussing the key problems, which I’ll summarize below along with some of my own observations.

Problem 1: Agent Fatigue

A typical microservice-based system requires a lot of different operational tooling—log and metric collectors, uptime monitoring, analytics aggregators, security scanners, APM runtime instrumentation, and so on. Most of these involve agents that run on every node in the cluster (or, in some cases, every pod in Kubernetes). Since vendors optimize for day-one experience and differentiating capabilities, they are incentivized to provide agents unique to their products rather than attempting to unify or standardize on tooling. This causes problems for ops teams who are concerned with the day-two costs of running and managing all of these different agents. Resource consumption alone can be significant, especially if you add in a service mesh like Istio into the mix. Additionally, since each agent is unique, the way they are configured and managed is different. Finally, from a security perspective, every agent added to a system introduces additional attack surface to hosts in the cluster. Each agent brings not just the vendor’s code into production but also all of its dependencies.

Problem 2: Capacity Anxiety

With the elastic microservice architectures I described in part one, capacity planning for things like logs and metrics starts to become a challenge. This point is particularly salient if, for example, you’ve ever been responsible for managing Splunk licensing. With microservices, a new deployment can now cause a spike in log volumes forcing back pressure on your log ingestion across all of your services. I’ve seen Splunk ingestion get backed up for days’ worth of logs, making it nearly impossible to debug production issues when logs are needed most. I’ve seen Datadog metric ingestion grind to a halt after someone added a high-cardinality dimension to classify a metric by user. And I’ve seen security teams turn on cloud audit log exporting to their SIEM only to get flooded with low-level minutiae and noise. Most tools prioritize gross data ingestion over fine-grained control like sampling, filtering, deduplicating, and aggregating. Using collectors such as Fluentd can help with this problem but add to the first problem. Elastic microservice architectures tend to require more control over data ingestion to avoid capacity issues.

Problem 3: Foresight Required

Unlike monitoring, observability is about asking questions that we hadn’t planned to ask in advance, but we can’t ask those questions if the necessary data was never collected in the first place! The capacity problem described above might cause us to under-instrument our systems, especially when the value of logs is effectively zero—until it’s not. Between monitoring, debugging, security forensics, and other activities, effective operations requires a lot of foresight. Unfortunately, this foresight tends to come from hindsight, which might be too late depending on the situation. Most dashboards are operational scar tissue, after all. Adding or reconfiguring instrumentation after the fact can have significant lag time, which can be the difference between prolonged downtime or a speedy remediation. Elastic microservice architectures benefit greatly from the ability to selectively and dynamically dial up the granularity of operational data when it’s needed and dial it back down when it’s not.

Problem 4: Tooling and Data Accessibility

Because of the problems discussed earlier, it’s not uncommon for organizations to settle on a limited set of operations tools like logging and analytics systems. This can pose its own set of challenges, however, as valuable operational data becomes locked up within certain systems in production environments. Vendor lock-in and high switching costs can make it difficult to use the right tool for the job.

There’s a wide range of data sources that provide high-value signals such as VMs, containers, load balancers, service meshes, audit logs, VPC flow logs, and firewall logs. And there’s a wide range of sinks and downstream consumers that can benefit from these different signals. The problem is that tool and data needs vary from team to team. Different tools or products are needed for different data and different use cases. The data that operations teams care about is different from the data that business analysts, security, or product managers care about. But if the data is siloed based on form or function or the right tools aren’t available, it becomes harder for these different groups to be effective. There’s an ever-changing landscape of tools, products, and services—particularly in the operations space—so the question is: how big of a lift is it for your organization to add or change tools? How easy is it to experiment with new ones? In addition to the data siloing, the “agent fatigue” problem described above can make this challenging when re-rolling host agents at scale.

Solution: The Observability Pipeline

Solving these problems requires a solution that offers the following characteristics:

  1. Allows capturing arbitrarily wide events
  2. Consolidates data collection and instrumentation
  3. Decouples data sources from data sinks
  4. Supports input-to-output schema normalization
  5. Provides a mechanism to encode routing, filtering, and transformation logic

When we implement these different concepts, we get an observability pipeline—a way to unify the collection of operational data, shape it, enrich it, eliminate noise, and route it to any tool in the organization that can benefit from it. With input-to-output schema normalization, we can perform schema-agnostic processing to enrich, filter, aggregate, sample, or drop fields from any shape and adapt data for different destinations. This helps to support a wider range of data collectors and agents. And by decoupling sources and sinks, we can easily introduce or change tools and reroute data without impacting production systems.

We’re starting to see the commercialization of this idea with products like Cribl, but there are ways to solve some of these problems yourself, incrementally, and without the use of commercial software. The remainder of this post will discuss patterns and strategies for building your own observability pipeline. While the details here will be fairly high level, part three of this series will share some implementation details and tactics through examples.

Pattern 1: Structured Data

A key part of improving system observability is being more purposeful in how we structure our data. Specifically, structured logging is critical to supporting production systems and aiding debuggability. The last thing you want to be doing when debugging a production issue is frantically grepping log files trying to pull out needles from a haystack. In the past, logs were primarily consumed by human operators. Today, they are primarily consumed by tools. That requires some adjustments at design time. For example, if we were designing a login system, historically, we might have a logging statement that resembles the following:

log.error(“User '{}' login failed”.format(user))

This would result in a log message like:

ERROR 2019-12-30 09:28.31 User ‘tylertreat' login failed

When debugging login problems, we’d probably use a combination of grep and regular expressions to track down the users experiencing issues. This might be okay for the time being, but as we introduce additional metadata, it becomes more and more kludgy. It also means our logs are extremely fragile. People begin to rely on the format of logs in ways that might even be unknown to the developers responsible for them. Unstructured logs become an implicit, undocumented API.

With structured logs, we make that contract more explicit. Our logging statement might change to something more like:

log.error(“User login failed”,
event=LOGIN_ERROR,
user=“tylertreat”,
email=“tyler.treat@realkinetic.com”,
error=error)

The actual format we use isn’t hugely important. I typically recommend JSON because it’s ubiquitous and easy to write and parse. With JSON, our log looks something like the following:

{
“timestamp”: “2019-12-30 09:28.31”,
“level”: “ERROR”,
“event”: “user_login_error”,
“user”: “tylertreat”,
“email”: “tyler.treat@realkinetic.com”,
“error”: “Invalid username or password”,
“message”: “User login failed”
}

With this, we can parse the structure, index it, query it, even transform or redact it, and we can add new pieces of metadata without breaking consumers. Our logs start to look more like events. Remember, observability is about being able to ask arbitrary questions of our systems. Events are like logs with context, and shifting towards this model helps with being able to ask questions of our systems.

Pattern 2: Request Context and Tracing

With elastic microservice architectures, correlating events and metadata between services becomes essential. Distributed tracing is one component of this. Another is tying our structured logs together and passing shared context between services as a request traverses the system. A pattern that I recommend to teams adopting microservices is to pass a context object to everything. This is actually a pattern that originated in Go for passing request-scoped values, cancelation signals, and deadlines across API boundaries. It turns out, this is also a useful pattern for observability when extended to service boundaries. While it’s contentious to explicitly pass context objects due to the obtrusiveness to APIs, I find it better than relying on implicit, request-local storage.

In its most basic form, a context object is simply a key-value bag that lets us track metadata as a request passes through a service and is persisted through the entire execution path. OpenTracing refers to this as baggage. You can include this context as part of your structured logs. Some suggest having a single event/structured-log-with-context emitted per hop, but I think this is more aspirational. For most, it’s probably easier to get started by adding a context object to your existing logging. Our login system’s logging from above would look something like this:

def login(ctx, username, email, password):
ctx.set(user=username, email=email)
...
log.error(“User login failed”,
event=LOGIN_ERROR,
context=ctx,
error=error)
...

This adds rich metadata to our logs—great for debugging—as they start evolving towards events. The context is also a convenient way to propagate tracing information, such as a span ID, between services.

{
“timestamp”: “2019-12-30 09:28.31”,
“level”: “ERROR”,
“event”: “user_login_error”,
“context”: {
“id”: “accfbb8315c44a52ad893ca6772e1caf”,
“http_method”: “POST”,
“http_path”: “/login”,
“user”: “tylertreat”,
“email”: “tyler.treat@realkinetic.com”,
“span_id”: “34fe6cbf9556424092fb230eab6f4ea6”,
},
“error”: “Invalid username or password”,
“message”: “User login failed”
}

You might be wondering what to put on the context versus just putting on our structured logs. It’s a good question and, like most things, the answer is “it depends.” A good rule of thumb is what can you get for “free” and what do you need to pass along? These should typically be things specific to a particular request. For instance, CPU utilization and memory usage can be pulled from the environment, but a user or correlation ID are request-specific and must be propagated. This decision starts to become more obvious the deeper your microservice architectures get. Just be careful not to leak sensitive data into your logs! While we can introduce tooling into our observability pipeline to help with this risk, I believe code reviews are the best line of defense here.

Pattern 3: Data Schema

With our structured data and context, we can take it a step further and introduce schemas for each data type we collect, such as logs, metrics, and traces. Schemas provide a standard shape to the data and allow consumers to rely on certain fields and types. They might validate data types and enforce required fields like a user ID, license, or trace ID. These schemas basically take the explicit contract described above and codify it into a specification. This is definitely the most organization-dependent pattern, so it’s hard to provide specific advice. The key thing is having structured data that can be easily evolved and relied on for debugging or exploratory purposes.

These schemas also need libraries which implement the specifications and make it easy for developers to actually instrument their systems. There is a plethora of existing libraries available for structured logging. For tracing and metrics, OpenTelemetry has emerged as a vendor-neutral API and forthcoming data specification.

Pattern 4: Data Collector

So far, we’ve talked mostly about development practices that improve observability. While they don’t directly address the problems described above, later, we’ll see how they also help support other parts of the observability pipeline. Now we’re going to look at some actual infrastructure patterns for building out a pipeline.

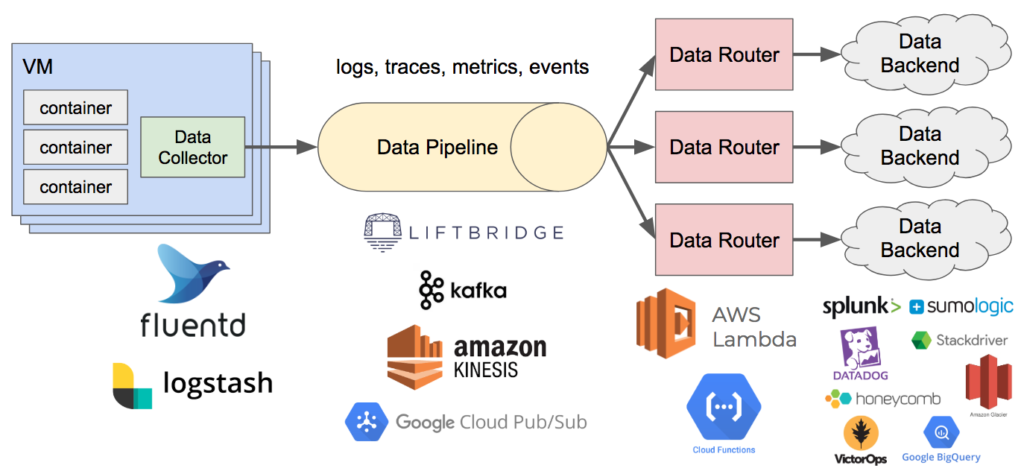
Recall that two of the characteristics we desire in our observability solution are the ability to consolidate data collection and instrumentation and decouple data sources from data sinks. One of the ways we can reduce agent fatigue is by using a data collector to unify the collection of key pieces of observability data—namely logs (or events), metrics, and traces. This component collects the data, optionally performs some transformations or filtering on it, and writes it to a data pipeline. This commonly runs as an agent on the host. In Kubernetes, this might be a DaemonSet with an instance running on each node. From the application or container side, data is written to stdout/stderr or a Unix domain socket which the collector reads. From here, the data gets written to the pipeline, which we’ll look at next.

Moving data collection out of process can be important if your application emits a significant amount of logs or you’re doing anything at a large enough scale. I’ve seen cases where applications were spending more time writing logs than performing actual business logic. Writing logs to disk can easily take down a database or other I/O-intensive workload just by sharing a filesystem with its logging. Rather than sacrificing observability by reducing the volume and granularity of logs, offload it and move it out of the critical execution path. Logging can absolutely affect the performance and reliability of your application.

For this piece, I generally recommend using either Fluentd or Logstash along with the Beats ecosystem. I usually avoid putting too much logic into the data collector due to the way it runs distributed and at scale. If you put a lot of processing logic here, it can become difficult to manage and evolve. I find it works better to have the collector act as a dumb pipe for getting data into the system where it can be processed offline.

Pattern 5: Data Pipeline

Now that we have an agent running on each host collecting our structured data, we need a scalable, fault-tolerant data stream to handle it all. Even at modestly sized organizations, I’ve seen upwards of about 1TB of logs indexed daily with elastic microservice architectures. This volume can be much greater for larger organizations, and it can burst dramatically with the introduction of new services. As a result, decoupling sources and sinks becomes important for reducing capacity anxiety. This data pipeline is often something that can be partitioned for horizontal scalability. In doing this, we might just end up shifting the capacity anxiety from one system to another, but depending on the solution, this can be an easier problem to solve or might not be a problem at all if using a managed cloud service. Finally, a key reason for decoupling is that it also allows us to introduce or change sinks without impacting our production cluster. A benefit of this is that we can also evaluate and compare tools side-by-side. This helps reduce switching costs.

There are quite a few available solutions for this component, both open source and managed. On the open source side, examples include Apache Kafka, Apache Pulsar, and Liftbridge. On the cloud-managed services side, Amazon Kinesis, Google Cloud Pub/Sub, and Azure Event Hubs come to mind. I tend to prefer managed solutions since they allow me to focus on things that directly deliver business value rather than surrounding operational concerns.

Note that there are some important nuances depending on the pipeline implementation you use or which might determine the implementation you choose. For example, questions like how long do you need to retain observability data, do you need the ability to replay data streams, and do you need strict, in-order delivery of messages? Replaying operational data can be useful for retraining ML models or testing monitoring changes, for instance. For systems that are explicitly sharded, there’s also the question of how to partition the data. Random partitioning is usually easiest from a scaling and operations perspective, but it largely depends on how you intend to consume it.

Pattern 6: Data Router

The last pattern and component of our observability pipeline is the data router. With our operational data being written to a pipeline such as Kafka, we need something that can consume it, perform processing, and write it to various backend systems. This is also a great place to perform dynamic sampling, filtering, deduplication, aggregation, or data enrichment. The schema mentioned earlier becomes important here since the shape of the data determines how it gets handled. If you’re dealing with data from multiple sources, you’ll likely need to normalize to some common schema, either at ingestion time or processing time, in order to execute shared logic and perform schema-agnostic processing. Data may also need to be reshaped before writing to destination systems.

This piece can be as sophisticated or naive as you’d like, depending on your needs or your organization’s observability and operations maturity. A simple example is merely looking at the record type and sending logs to Splunk and Amazon Glacier cold storage, sending traces to Stackdriver, sending metrics to Datadog, and sending high-cardinality events to Honeycomb. More advanced use cases might involve dynamic sampling to dial up or down the granularity on demand, dropping values to reduce storage consumption or eliminate noise, masking values to implement data loss prevention, or joining data sources to create richer analytics.

Ultimately, this is a glue component that’s reading data in, parsing the shape of it, and writing it out to assorted APIs or other topics/streams for further downstream processing. Depending on the statefulness of your router logic, this can be a good fit for serverless solutions like AWS Lambda, Google Cloud Functions, Google Cloud Run, Azure Functions, or OpenFaaS. If using Kafka, Kafka Streams might be a good fit.

The Journey to Better Observability

Observability with elastic microservice architectures introduces some unique challenges like agent fatigue, capacity anxiety, required foresight, and tooling and data accessibility. Solving these problems requires a solution that can capture arbitrarily wide events, consolidate data collection and instrumentation, decouple data sources and sinks, support input-to-output schema normalization, and encode routing, filtering, and transformation logic. When we implement this, we get an observability pipeline, which is really just a fancy name for a collection of observability patterns and best practices.

An observability pipeline should be an evolutionary or iterative process. You shouldn’t waste time building out a sophisticated pipeline early on; you should be focused on delivering value to your customers. Instead, start small with items that add immediate value to the observability of your systems.

Something you can begin doing today that adds a ton of value with minimal lift is structured logging. Another high-leverage pattern is passing a context object throughout your service calls to propagate request metadata which can be logged and correlated. Use distributed tracing to understand and identify issues with performance. Next, move log collection out of process using Fluentd or Logstash. If you’re not already, use a centralized logging system—Splunk, Elasticsearch, Sumo Logic, Graylog—there are a bunch of options here, both open source and commercial, SaaS or self-managed. With the out-of-process collector, you can then introduce a data pipeline to decouple log producers from consumers. Again, there are managed options like Amazon Kinesis or Google Cloud Pub/Sub and self-managed ones like Apache Kafka. With this, you can now add, change, or compare consumers and log sinks without impacting production systems. Evaluate a product like Honeycomb for storing high-cardinality events. At this point, you can start to unify the collection of other instrumentation such as metrics and traces and evolve your logs towards context-rich events.

Each of these things will incrementally improve the observability of your systems and can largely be done in a stepwise fashion. Whether you’re just beginning your transition to microservices or have fully adopted them, the journey to better observability doesn’t have to require a herculean effort. Rather, it’s done one step at a time.

In part three of this series, I’ll demonstrate a few implementation details through examples to show some of these observability patterns in practice.

Security by Happenstance

Key rotation, auditing, and secure CI/CD

Companies often require employees to regularly change their passwords for security purposes. PCI compliance, for example, requires that passwords be changed every 90 days. However, NIST, whose guidelines commonly become the foundation for security best practices across countless organizations, recently revised its recommendations around password security. Its Digital Identity Guidelines (NIST 800-63-3) now recommends removing periodic password-change requirements due to a growing body of research suggesting that frequent password changes actually makes security worse. This is because these requirements encourage the use of passwords which are more susceptible to cracking (e.g. incrementing a number or altering a single character) or result in people writing their passwords down.

Unfortunately, many companies have now adapted these requirements to other parts of their IT infrastructure. This is largely due to legacy holdover practices which have crept into modern systems (or simply lingered in older ones), i.e. it’s tech debt. Specifically, I’m talking about practices like using username/password credentials that applications or systems use to access resources instead of individual end users. These special credentials may even provide a system free rein within a network much like a user might have, especially if the network isn’t segmented (often these companies have adopted a perimeter-security model, relying on a strong outer wall to protect their network). As a result, because they are passwords just like a normal user would have, they are subject to the usual 90-day rotation policy or whatever the case may be.

Today, I think we can say with certainty that—along with the perimeter-security model—relying on usernames and passwords for system credentials is a security anti-pattern (and really, user credentials should be relying on multi-factor authentication). With protocols like OAuth2 and OpenID Connect, we can replace these system credentials with cryptographically strong keys. But because these keys, in a way, act like username/passwords, there is a tendency to apply the same 90-day rotation policy to them as well. This is a misguided practice for several reasons and is actually quite risky.

First, changing a user’s password is far less risky than rotating an access key for a live, production system. If we’re changing keys for production systems frequently, there is a potential for prolonged outages. The more you’re touching these keys, the more exposure and opportunity for mistakes there is. For a user, the worst case is they get temporarily locked out. For a system, the worst case is a critical user-facing application goes down. Second, cryptographically strong keys are not “guessable” like a password frequently is. Since they are generated by an algorithm and not intended to be input by a human, they are long and complex. And unlike passwords, keys are not generally susceptible to social engineering. Lastly, if we are requiring keys to be rotated every 90 days, this means an attacker can still have up to 89 days to do whatever they want in the event of a key being compromised. From a security perspective, this frankly isn’t good enough to me. It’s security by happenstance. The Twitter thread below describes a sequence of events that occurred after an AWS key was accidentally leaked to a public code repository which illustrates this point.

To recap that thread, here’s a timeline of what happened:

  1. AWS credentials are pushed to a public repository on GitHub.
  2. 55 seconds later, an email is received from AWS telling the user that their account is compromised and a support ticket is automatically opened.
  3. A minute later (2 minutes after the push), an attacker attempts to use the credentials to list IAM access keys in order to perform a privilege escalation. Since the IAM role attached to the credentials is insufficient, the attempt failed and an event is logged in CloudTrail.
  4. The user disables the key 5 minutes and 58 seconds after the push.
  5. 24 minutes and 58 seconds after the push, GuardDuty fires a notification indicating anomalous behavior: “APIs commonly used to discover the users, groups, policies and permissions in an account, was invoked by IAM principal some_user under unusual circumstances. Such activity is not typically seen from this principal.”

Given this timeline, rotating access keys every 90 days would do absolutely no good. If anything, it would provide a false sense of security. An attack was made a mere 2 minutes after the key was compromised. It makes no difference if it’s rotated every 90 days or every 9 minutes.

If 90-day key rotation isn’t the answer, what is? The timeline above already hits on it. System credentials, i.e. service accounts, should have very limited permissions following the principle of least privilege. For instance, a CI server which builds artifacts should have a service account which only allows it to push artifacts to a storage bucket and nothing else. This idea should be applied to every part of your system.

For things running inside the cloud, such as AWS or GCP, we can usually avoid the need for access keys altogether. With GCP, we rely on service accounts with GCP-managed keys. The keys for these service accounts are not exposed to users at all and are, in fact, rotated approximately every two weeks (Google is able to do this because they own all of the infrastructure involved and have mature automation). With AWS, we rely on Identity and Access Management (IAM) users and roles. The role can then be assumed by the environment without having to deal with a token or key. This situation is ideal because we can avoid key exposure by never having explicit keys in the first place.

For things running outside the cloud, it’s a bit more involved. In these cases, we must deal with credentials somehow. Ideally, we can limit the lifetime of these credentials, such as with AWS’ Security Token Service (STS) or GCP’s short-lived service account credentials. However, in some situations, we may need longer-lived credentials. In either case, the critical piece is using limited-privilege credentials such that if a key is compromised, the scope of the damage is narrow.

The other key component of this is auditing. Both AWS and GCP offer extensive audit logs for governance, compliance, operational auditing, and risk auditing of your cloud resources. With this, we can audit service account usage, detect anomalous behavior, and immediately take action—such as revoking the credential—rather than waiting up to 90 days to rotate it. Amazon also has GuardDuty which provides intelligent threat detection and continuous monitoring which can identify unauthorized activity as seen in the scenario above. Additionally, access credentials and other secrets should never be stored in source code, but tools like git-secrets, GitGuardian, and truffleHog can help detect when it does happen.

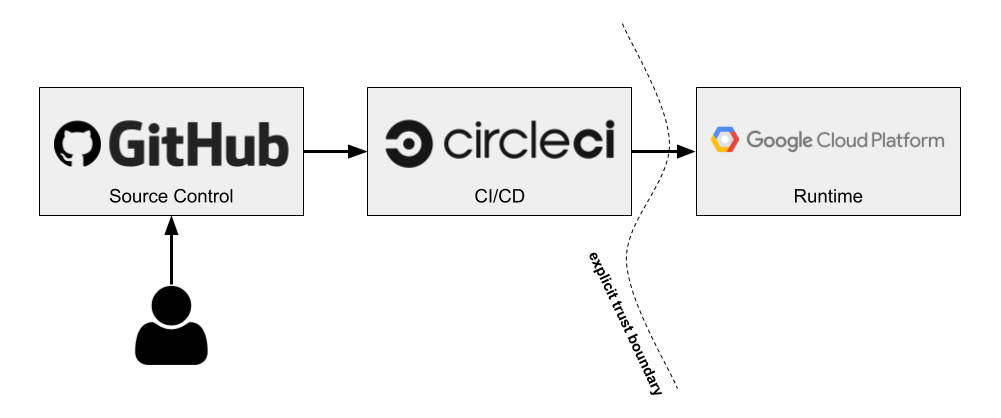
Let’s look at a hypothetical CI/CD pipeline as an example which ties these ideas together. Below is the first pass of our proposed pipeline. In this case, we’re targeting GCP, but the same ideas apply to other environments.

CircleCI is a SaaS-based CI/CD solution. Because it’s deploying to GCP, it will need a service account with the appropriate IAM roles. CircleCI has support for storing secret environment variables, which is how we would store the service account’s credentials. However, there are some downsides to this approach.

First, the service account that Circle needs in order to make deploys could require a fairly wide set of privileges, like accessing a container registry and deploying to a runtime. Because it lives outside of GCP, this service account has a user-managed key. While we could use a KMS to encrypt it or a vault that provides short-lived credentials, we ultimately will need some kind of credential that allows Circle to access these services, so at best we end up with a weird Russian-doll situation. If we’re rotating keys, we might wind up having to do so recursively, and the value of all this indirection starts to come into question. Second, these credentials—or any other application secrets—could easily be dumped out as part of the build script. This isn’t good if we wanted Circle to deploy to a locked-down production environment. Developers could potentially dump out the production service account credentials and now they would be able to make deploys to that environment, circumventing our pipeline.

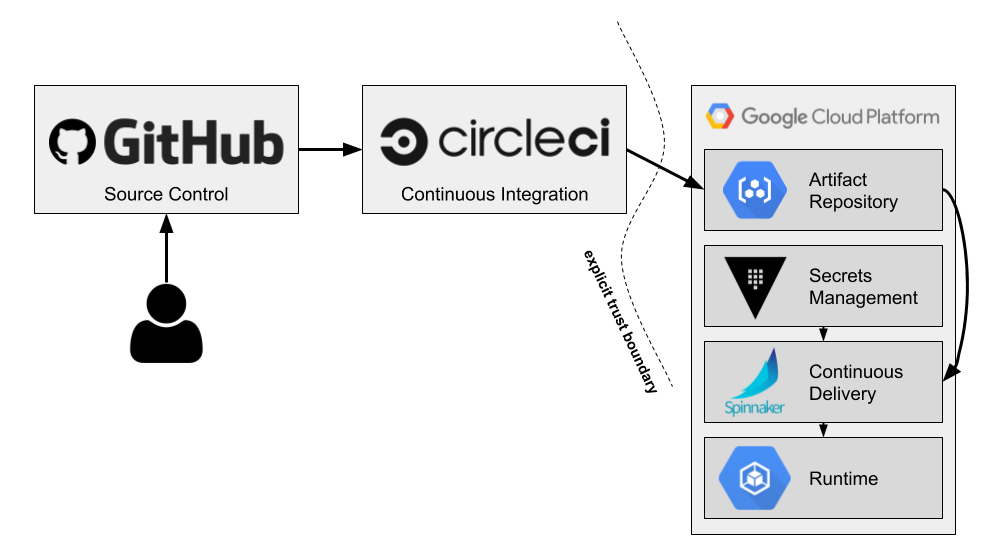
This is why splitting out Continuous Integration (CI) from Continuous Delivery (CD) is important. If, instead, Circle was only responsible for CI and we introduced a separate component for CD, such as Spinnaker, we can solve this problem. Using this approach, now Circle only needs the ability to push an artifact to a Google Cloud Storage bucket or Container Registry. Outside of the service account credentials needed to do this, it doesn’t need to deal with secrets at all. This means there’s no way to dump out secrets in the build because they will be injected later by Spinnaker. The value of the service account credentials is also much more limited. If compromised, it only allows someone to push artifacts to a repository. Spinnaker, which would run in GCP, would then pull secrets from a vault (e.g. Hashicorp’s Vault) and deploy the artifact relying on credentials assumed from the environment. Thus, Spinnaker only needs permissions to pull artifacts and secrets and deploy to the runtime. This pipeline now looks something like the following:

With this pipeline, we now have traceability from code commit and pull request (PR) to deploy. We can then scan audit logs to detect anomalous behavior—a push to an artifact repository that is not associated with the CircleCI service account or a deployment that does not originate from Spinnaker, for example. Likewise, we can ensure these processes correlate back to an actual GitHub PR or CircleCI build. If they don’t, we know something fishy is going on.

To summarize, requiring frequent rotations of access keys is an outdated practice. It’s a remnant of password policies which themselves have become increasingly reneged by security experts. While similar in some ways, keys are fundamentally different than a username and password, particularly in the case of a service account with fine-grained permissions. Without mature practices and automation, rotating these keys frequently is an inherently risky operation that opens up the opportunity for downtime.

Instead, it’s better to rely on tightly scoped (and, if possible, short-lived) service accounts and usage auditing to detect abnormal behavior. This allows us to take action immediately rather than waiting for some arbitrary period to rotate keys where an attacker may have an unspecified amount of time to do as they please. With end-to-end traceability and evidence collection, we can more easily identify suspicious actions and perform forensic analysis.

Note that this does not mean we should never rotate access keys. Rather, we can turn to NIST for its guidance on key management. NIST 800-57 recommends cryptoperiods of 1-2 years for asymmetric authentication keys in order to maximize operational efficiency. Beyond these particular cryptoperiods, the value of rotating keys regularly is in having the confidence you can, in fact, rotate them without incident. The time interval itself is mostly immaterial, but developing this confidence is important in the event of a key actually being compromised. In this case, you want to know you can act swiftly and revoke access without causing outages.

The funny thing about compliance is that, unless you’re going after actual regulatory standards such as FedRAMP or PCI compliance, controls are generally created by the company itself. Compliance auditors mostly ensure the company is following its own controls. So if you hear, “it’s a compliance requirement” or “that’s the way it’s always been done,” try to dig deeper to understand what risk the control is actually trying to mitigate. This allows you to have a dialog with InfoSec or compliance folks and possibly come to the table with better alternatives.

Authenticating Stackdriver Uptime Checks for Identity-Aware Proxy

Google Stackdriver provides a set of tools for monitoring and managing services running in GCP, AWS, or on-prem infrastructure. One feature Stackdriver has is “uptime checks,” which enable you to verify the availability of your service and track response latencies over time from up to six different geographic locations around the world. While Stackdriver uptime checks are not as feature-rich as other similar products such as Pingdom, they are also completely free. For GCP users, this provides a great starting point for quickly setting up health checks and alerting for your applications.

Last week I looked at implementing authentication and authorization for APIs in GCP using Cloud Identity-Aware Proxy (IAP). IAP provides an easy way to implement identity and access management (IAM) for applications and APIs in a centralized place. However, one thing you will bump into when using Stackdriver uptime checks in combination with IAP is authentication. For App Engine in particular, this can be a problem since there is no way to bypass IAP. All traffic, both internal and external to GCP, goes through it. Until Cloud IAM Conditions is released and generally available, there’s no way to—for example—open up a health-check endpoint with IAP.

While uptime checks have support for Basic HTTP authentication, there is no way to script more sophisticated request flows (e.g. to implement the OpenID Connect (OIDC) authentication flow for IAP-protected resources) or implement fine-grained IAM policies (as hinted at above, this is coming with IAP Context-Aware Access and IAM Conditions). So are we relegated to using Nagios or some other more complicated monitoring tool? Not necessarily. In this post, I’ll present a workaround solution for authenticating Stackdriver uptime checks for systems protected by IAP using Google Cloud Functions.

The Solution

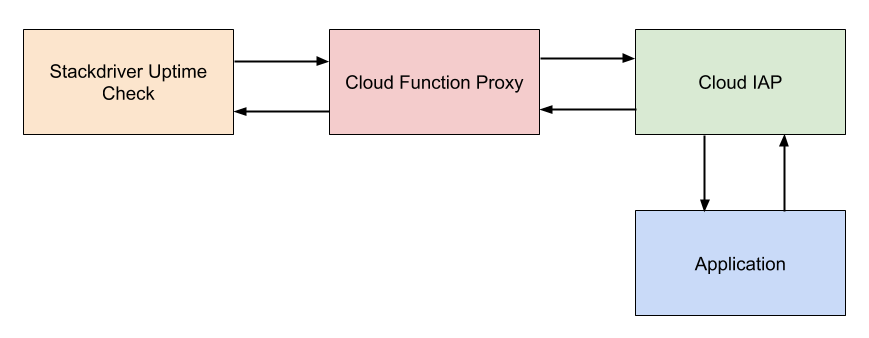
The general strategy is to use a Cloud Function which can authenticate with IAP using a service account to proxy uptime checks to the application. Essentially, the proxy takes a request from a client, looks for a header containing a host, forwards the request that host after performing the necessary authentication, and then forwards the response back to the client. The general architecture of this is shown below.

There are some trade-offs with this approach. The benefit is we get to rely on health checks that are fully managed by GCP and free of charge. Since Cloud Functions are also managed by GCP, there’s no operations involved beyond deploying the proxy and setting it up. The first two million invocations per month are free for Cloud Functions. If we have an uptime check running every five minutes from six different locations, that’s approximately 52,560 invocations per month. This means we could run roughly 38 different uptime checks without exceeding the free tier for invocations. In addition to invocations, the free tier offers 400,000 GB-seconds, 200,000 GHz-seconds of compute time and 5GB of Internet egress traffic per month. Using the GCP pricing calculator, we can estimate the cost for our uptime check. It generally won’t come close to exceeding the free tier.

The downside to this approach is the check is no longer validating availability from the perspective of an end user. Because the actual service request is originating from Google’s infrastructure by way of a Cloud Function as opposed to Stackdriver itself, it’s not quite the same as a true end-to-end check. That said, both Cloud Functions and App Engine rely on the same Google Front End (GFE) infrastructure, so as long as both the proxy and App Engine application are located in the same region, this is probably not all that important. Besides, for App Engine at least, the value of the uptime check is really more around performing a full-stack probe of the application and its dependencies than monitoring the health of Google’s own infrastructure. That is one of the goals behind using managed services after all. The bigger downside is that the latency reported by the uptime check no longer accurately represents the application. It can still be useful for monitoring aggregate trends nonetheless.

The Implementation Setup

I’ve built an open-source implementation of the proxy as a Cloud Function in Python called gcp-oidc-proxy. It’s runnable out of the box without any modification. We’ll assume you have an IAP-protected application you want to setup a Stackdriver uptime check for. To deploy the proxy Cloud Function, first clone the repository to your machine, then from there run the following gcloud command:

$ gcloud functions deploy gcp-oidc-proxy \
   --runtime python37 \
   --entry-point handle_request \
   --trigger-http

This will deploy a new Cloud Function called gcp-oidc-proxy to your configured cloud project. It will assume the project’s default service account. Ordinarily, I would suggest creating a separate service account to limit scopes. This can be configured on the Cloud Function with the –service-account flag, which is under gcloud beta functions deploy at the time of this writing. We’ll omit this step for brevity however.

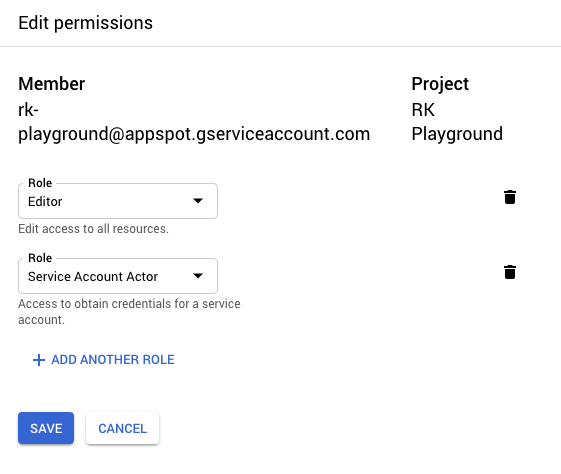
Next, we need to add the “Service Account Actor” IAM role to the Cloud Function’s service account since it will need it to sign JWTs (more on this later). In the GCP console, go to IAM & admin, locate the appropriate service account (in this case, the default service account), and add the respective role.

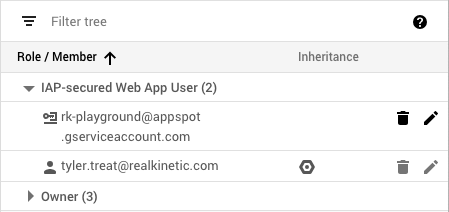
The Cloud Function’s service account must also be added as a member to the IAP with the “IAP-secured Web App User” role in order to properly authenticate. Navigate to Identity-Aware Proxy in the GCP console, select the resource you wish to add the service account to, then click Add Member.

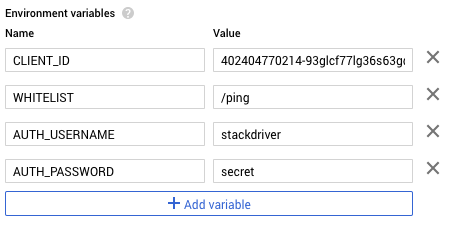
Find the OAuth2 client ID for the IAP by clicking on the options menu next to the IAP resource and select “Edit OAuth client.” Copy the client ID on the next page and then navigate to the newly deployed gcp-oidc-proxy Cloud Function. We need to configure a few environment variables, so click edit and then expand more at the bottom of the page. We’ll add four environment variables: CLIENT_ID, WHITELIST, AUTH_USERNAME, and AUTH_PASSWORD.

CLIENT_ID contains the OAuth2 client ID we copied for the IAP. WHITELIST contains a comma-separated list of URL paths to make accessible or * for everything (I’m using /ping in my example application), and AUTH_USERNAME and AUTH_PASSWORD setup Basic authentication for the Cloud Function. If these are omitted, authentication is disabled.

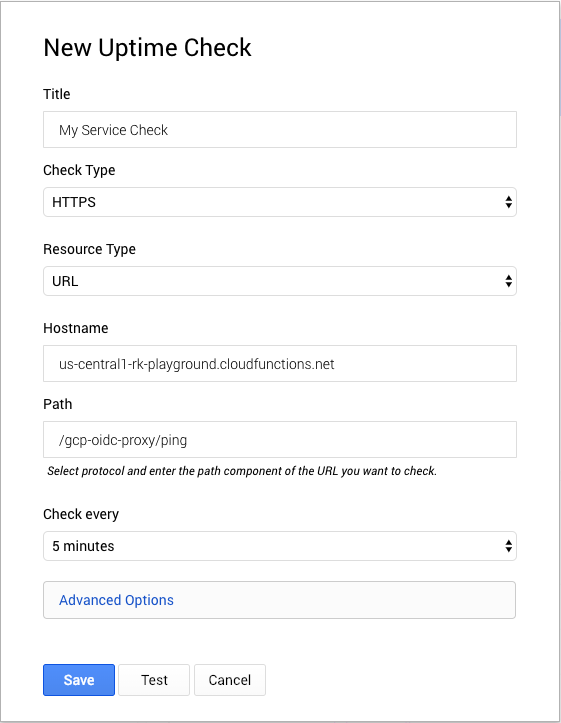
Save the changes to redeploy the function with the new environment variables. Next, we’ll setup a Stackdriver uptime check that uses the proxy to call our service. In the GCP console, navigate to Monitoring then Create Check from the Stackdriver UI. Skip any suggestions for creating a new uptime check. For the hostname, use the Cloud Function host. For the path, use /gcp-oidc/proxy/<your-endpoint>. The proxy will use the path to make a request to the protected resource.

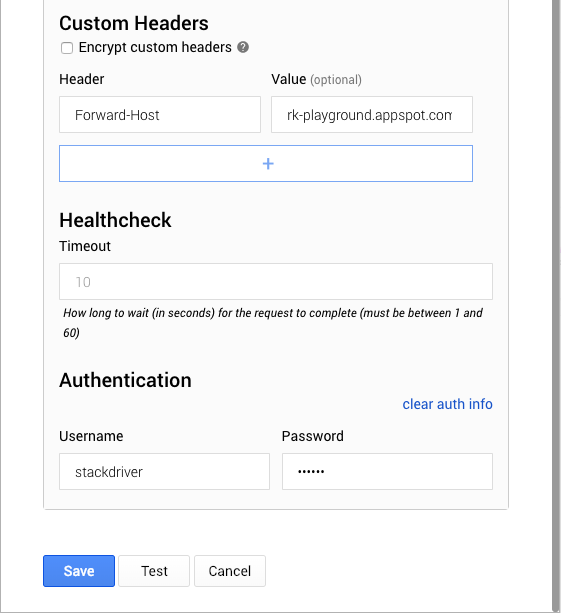
Expand Advanced Options to set the Forward-Host to the host protected by IAP. The proxy uses this header to forward requests. Lastly, we’ll set the authentication username and password that we configured on the Cloud Function.

Click “Test” to ensure our configuration works and the check passes.

The Implementation Details

The remainder of this post will walk you through the implementation details of the proxy. The implementation closely resembles what we did to authenticate API consumers using a service account. We use a header called Forward-Host to allow the client to specify the IAP-authenticated host to forward requests to. If the header is not present, we just return a 400 error. We then use this host and the path of the original request to construct the proxy request and retain the HTTP method and headers (with the exception of the Host header, if present, since this can cause problems).

Before sending the request, we perform the authentication process by generating a JWT signed by the service account and exchange it for a Google-signed OIDC token.

We can cache this token and renew it only once it expires. Then we set the Authorization header with the OIDC token and send the request.

We simply forward on the resulting content body, status code, and headers. We strip HTTP/1.1 “hop-by-hop” headers since these are unsupported by WSGI and Python Cloud Functions rely on Flask. We also strip any Content-Encoding header since this can also cause problems.

Because this proxy allows clients to call into endpoints unauthenticated, we also implement a whitelist to expose only certain endpoints. The whitelist is a list of allowed paths passed in from an environment variable. Alternatively, we can whitelist * to allow all paths. Wildcarding could be implemented to make this even more flexible. We also implement a Basic auth decorator which is configured with environment variables since we can setup uptime checks with a username and password in Stackdriver.

The only other code worth looking at in detail is how we setup the service account credentials and IAM Signer. A Cloud Function has a service account attached to it which allows it to assume the roles of that account. Cloud Functions rely on the Google Compute Engine metadata server which stores service account information among other things. However, the metadata server doesn’t expose the service account key used to sign the JWT, so instead we must use the IAM signBlob API to sign JWTs.

Conclusion

It’s not a particularly simple solution, but it gets the job done. The setup of the Cloud Function could definitely be scripted as well. Once IAM Conditions is generally available, it should be possible to expose certain endpoints in a way that is accessible to Stackdriver without the need for the OIDC proxy. That said, it’s not clear if there is a way to implement uptime checks without exposing an endpoint at all since there is currently no way to assign a service account to a check. Ideally, we would be able to assign a service account and use that with IAP Context-Aware Access to allow the uptime check to access protected endpoints.