API Authentication with GCP Identity-Aware Proxy

Cloud Identity-Aware Proxy (Cloud IAP) is a free service which can be used to implement authentication and authorization for applications running in Google Cloud Platform (GCP). This includes Google App Engine applications as well as workloads running on Compute Engine (GCE) VMs and Google Kubernetes Engine (GKE) by way of Google Cloud Load Balancers.

When enabled, IAP requires users accessing a web application to login using their Google account and ensure they have the appropriate role to access the resource. This can be used to provide secure access to web applications without the need for a VPN. This is part of what Google now calls BeyondCorp, which is an enterprise security model designed to enable employees to work from untrusted networks without a VPN. At Real Kinetic, we frequently bump into companies practicing Death-Star security, which is basically relying on a hard outer shell to protect a soft, gooey interior. It’s simple and easy to administer, but it’s also vulnerable. That’s why we always approach security from a perspective of defense in depth.

However, in this post I want to explore how we can use Cloud IAP to implement authentication and authorization for APIs in GCP. Specifically, I will use App Engine, but the same applies to resources behind an HTTPS load balancer. The goal is to provide a way to securely expose APIs in GCP which can be accessed programmatically.

Configuring Identity-Aware Proxy

Cloud IAP supports authenticating service accounts using OpenID Connect (OIDC). A service account belongs to an application instead of an individual user. You authenticate a service account when you want to allow an application to access your IAP-secured resources. A GCP service account can either have GCP-managed keys (for systems that reside within GCP) or user-managed keys (for systems that reside outside of GCP). GCP-managed keys cannot be downloaded and are automatically rotated and used for signing for a maximum of two weeks. User-managed keys are created, downloaded, and managed by users and expire 10 years from creation. As such, key rotation must be managed by the user as appropriate. In either case, access using a service account can be revoked either by revoking a particular key or removing the service account itself.

An IAP is associated with an App Engine application or HTTPS Load Balancer. One or more service accounts can then be added to an IAP to allow programmatic authentication. When the IAP is off, the resource is accessible to anyone with the URL. When it’s on, it’s only accessible to members who have been granted access. This can include specific Google accounts, groups, service accounts, or a general G Suite domain.

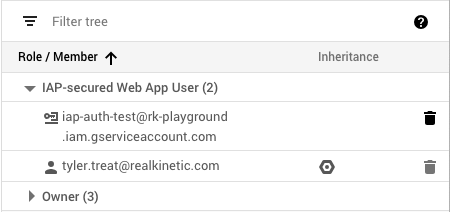
IAP will create an OAuth2 client ID for OIDC authentication which can be used by service accounts. But in order to access our API using a service account, we first need to add it to IAP with the appropriate role. We’ll add it as an IAP-secured Web App User, which allows access to HTTPS resources protected by IAP. In this case, my service account is called “IAP Auth Test,” and the email associated with it is iap-auth-test@rk-playground.iam.gserviceaccount.com.

As you can see, both the service account and my user account are IAP-secured Web App Users. This means I can access the application using my Google login or using the service account credentials. Next, we’ll look at how to properly authenticate using the service account.

Authenticating API Consumers

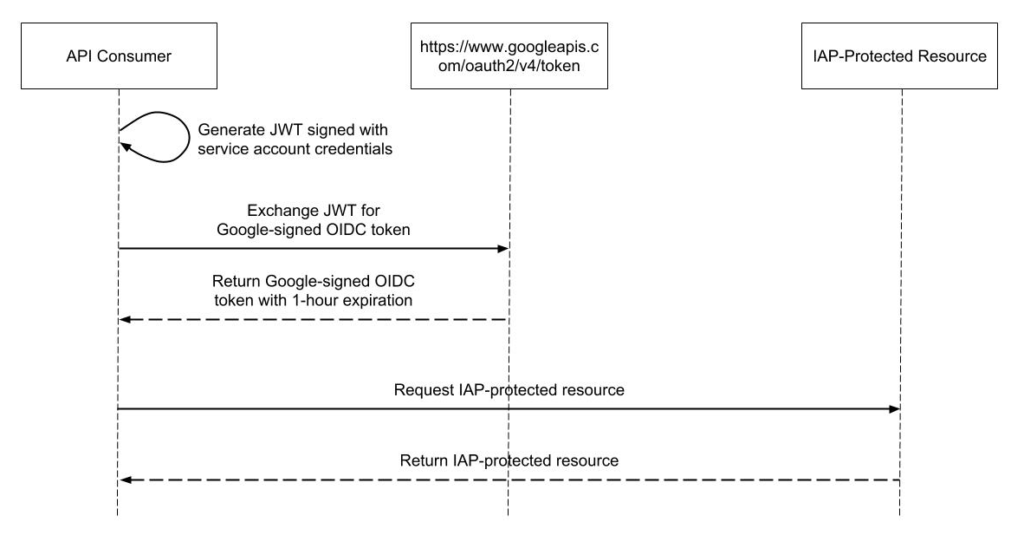
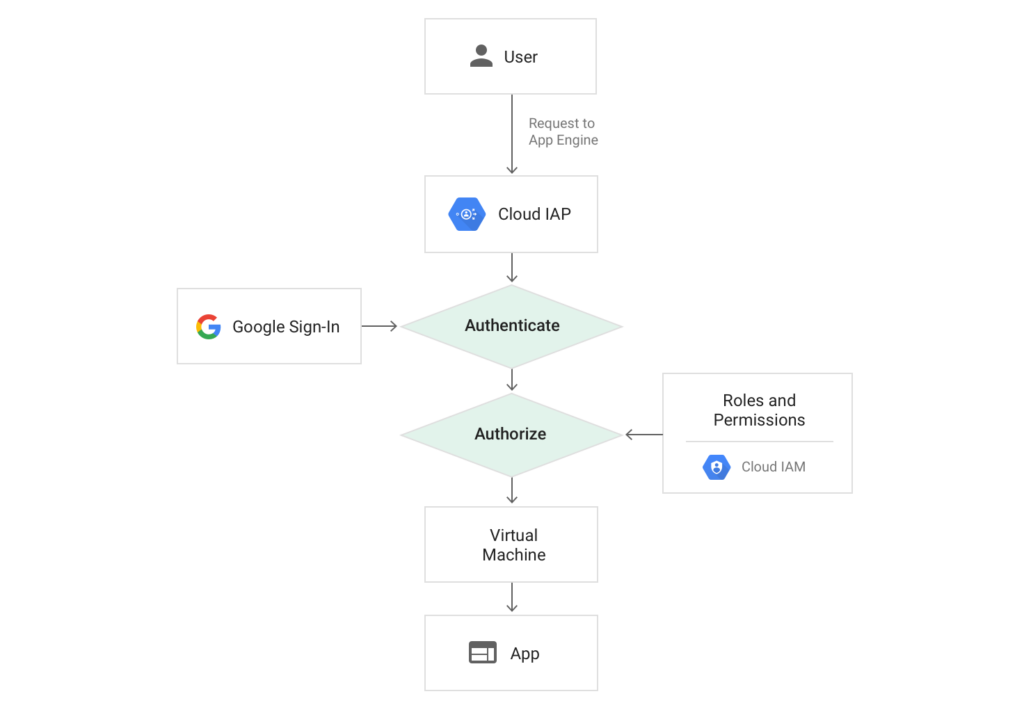
When you create a service account key in the GCP console, it downloads a JSON credentials file to your machine. The API consumer needs the service account credentials to authenticate. The diagram below illustrates the general architecture of how IAP authenticates API calls to App Engine services using service accounts.

In order to make a request to the IAP-authenticated resource, the consumer generates a JWT signed using the service account credentials. The JWT contains an additional target_audience claim containing the OAuth2 client ID from the IAP. To find the client ID, click on the options menu next to the IAP resource and select “Edit OAuth client.” The client ID will be listed on the resulting page. My code to generate this JWT looks like the following:

This assumes you have access to the service account’s private key. If you don’t have access to the private key, e.g. because you’re running on GCE or Cloud Functions and using a service account from the metadata server, you’ll have to use the IAM signBlob API. We’ll cover this in a follow-up post.

This JWT is then exchanged for a Google-signed OIDC token for the client ID specified in the JWT claims. This token has a one-hour expiration and must be renewed by the consumer as needed. To retrieve a Google-signed token, we make a POST request containing the JWT and grant type to https://www.googleapis.com/oauth2/v4/token.

This returns a Google-signed JWT which is good for about an hour. The “exp” claim can be used to check the expiration of the token. Authenticated requests are then made by setting the bearer token in the Authorization header of the HTTP request:

Authorization: Bearer <token>

Below is a sequence diagram showing the process of making an OIDC-authenticated request to an IAP-protected resource.

Because this is quite a bit of code and complexity, I’ve implemented the process flow in Java as a Spring RestTemplate interceptor. This transparently authenticates API calls, caches the OIDC token, and handles automatically renewing it. Google has also provided examples of authenticating from a service account for other languages.

With IAP, we’re able to authenticate and authorize requests at the edge before they even reach our application. And with Cloud Audit Logging, we can monitor who is accessing protected resources. Be aware, however, that if you’re using GCE or GKE, users who can access the application-serving port of the VM can bypass IAP authentication. GCE and GKE firewall rules can’t protect against access from processes running on the same VM as the IAP-secured application. They can protect against access from another VM, but only if properly configured. This does not apply for App Engine since all traffic goes through the IAP infrastructure.

Alternative Solutions

There are some alternatives to IAP for implementing authentication and authorization for APIs. Apigee is one option, which Google acquired not too long ago. This is a more robust API-management solution which will do a lot more than just secure APIs, but it’s also more expensive. Another option is Google Cloud Endpoints, which is an NGINX-based proxy that provides mechanisms to secure and monitor APIs. This is free up to two million API calls per month.

Lastly, you can also simply implement authentication and authorization directly in your application instead of with an API proxy, e.g. using OAuth2. This has downsides in that it can introduce complexity and room for mistakes, but it gives you full control over your application’s security. Following our model of defense in depth, we often encourage clients to implement authentication both at the edge (e.g. by ensuring requests have a valid token) and in the application (e.g. by validating the token on a request). This way, we avoid implementing a Death-Star security model.


The Observability Pipeline

The rise of cloud and containers has led to systems that are much more distributed and dynamic in nature. Highly elastic microservice and serverless architectures mean containers spin up on demand and scale to zero when that demand goes away. In this world, servers are very much cattle, not pets. This shift has exposed deficiencies in some of the tools and practices we used in the world of servers-as-pets. It has also led to new tools and services created to help us support our systems.

Many of the clients we work with at Real Kinetic are trying to navigate their way through this transformation and struggle to figure out where to begin with these solutions. Beau Lyddon, one of our partners, recently gave a talk on exactly this called What is Happening: Attempting to Understand Our Systems (as an aside, Honeycomb’s Charity Majors live-blogged the talk which is worth a read). In this post, I’m going to attempt to summarize some of the key ideas from Beau’s talk and introduce the concept of an observability pipeline, which we think is an essential component in today’s cloud-native, product-oriented world.

Observability Explosion

With traditional static deployments and monolithic architectures, monitoring is not too challenging (that’s not to say it’s easy, but, in relative terms, it’s uncomplicated). This is where tools like Nagios became very popular. When we have only a handful of servers and/or a single, monolithic application, it’s relatively straightforward to determine the health of the system and to correlate system behavior to actual customer or business impact. It’s also feasible to “see inside the box” and get meaningful code-level instrumentation. Once again, tools like AppDynamics and Dynatrace became popular here.

With cloud-native and container-based systems, instances tend to be highly elastic and ephemeral, and what used to comprise a single, monolithic application might now consist of dozens of different microservices and even different instances running different versions of the same service. Simply put, systems are more distributed, more dynamic, and more complex now than ever before—and users have even more expectations. This means many of the tools that were well-suited before might not be adequate now.

For example, the ability to “see inside the box” with intra-process, code-level tracing becomes largely impractical in a highly dynamic cloud environment. By the time you are debugging an issue, the container is gone. This is only exacerbated by the serverless or functions as a service (FaaS) movement. Similarly, it’s much more difficult to correlate the behavior of a single service to the user’s experience since partial failure becomes more of an everyday thing. Thus, many of these tools end up being better suited to static infrastructures where there is a small set of long-lived VMs with a limited number of services. That’s where most of them originated from anyway. Instead, service-level distributed tracing becomes a key part of microservice observability, as does structured logging. With this shift in how we build systems, there has been an explosion in new terms, new tools, and new services.

Of course, in addition to tools, there are also the cultural aspects of monitoring and incident response. Many companies traditionally rely on an operations team to monitor, triage, and—in some cases—even resolve issues. This model quickly becomes untenable as the number of services increases. A single operations team will not be able to maintain enough context for a non-trivial amount of services and systems to do this effectively. This model also leads to ineffective feedback loops if engineers are not on-call and responsible for the operation of their services—something I’ve talked about ad nauseum. My advice is to push ownership of systems onto the teams who built them. This includes on-call duty and general operational responsibilities. However, in order for development teams to take on this responsibility, they need to be empowered to act on it. With this model, which I’ve come to facetiously call NewOps, the operations team becomes responsible for providing the tools and data teams need to adequately operate their services. Some organizations take this even further with dedicated observability teams.

Observability” is a term that has emerged recently within the industry as a more nuanced take on traditional monitoring. While monitoring tends to focus more on the overall health of systems and business metrics, observability aims to provide more granular insights into the behavior of systems along with rich context useful for debugging and business purposes. Put another way, monitoring is about known-unknowns and actionable alerts; observability is about unknown-unknowns and empowering teams to interrogate their systems.

In a sense, observability encompasses all of the telemetry needed to gain insight into the behavior and state of a running system. This includes items like application logs, system logs, audit logs, application metrics, and distributed-tracing data. These are all valuable signals for diagnosing and debugging production issues, especially in a microservice environment where containers are largely ephemeral. In this environment, it is no longer practical to SSH into a machine to debug a problem or tail a log file. Distributed tracing becomes particularly important since a single application transaction may invoke multiple service functions.

Observability Pipeline

It’s important that you can really own your data and prevent it from being locked up inside a single vendor’s solution. Likewise, it’s important that data can be made available to the entire enterprise (or, in some cases, made not available to the entire enterprise). Since the number of tools and products can be quite large, tool and data needs vary from team to team, and the overall amount of data can be overwhelming, I suggest a decoupled approach. By building an observability pipeline, we can decouple the collection of this data from the ingestion of it into a variety of systems.

To illustrate, if we have log data going to Splunk, metrics and traces going to Datadog, client events going to Google Analytics and BigQuery, and everything going to Amazon Glacier for cold storage, the number of integrations quickly becomes large and grows for every additional service we add. It also probably means we are running an agent for many of these services on each host, and if any of these services are unavailable or behind, our application either blocks or we lose critical observability data. With the amount of data we end up collecting, it’s not uncommon to spend more time collecting it than actually performing business logic unless we find a way to efficiently get it out of the critical path.

Finally, as vendors in this space converge on features (which they are), differentiating capabilities are released (which they will need), or licensing/pricing issues arise (which they do), it’s likely that the business will need to add or remove SaaS solutions over time. If these are tightly integrated, this can be difficult to do. An observability pipeline, as we will later see, allows us to evaluate multiple solutions simultaneously or replace solutions transparently to applications and infrastructure. For example, perhaps we need to switch from Splunk to Sumo Logic or Datadog to New Relic or evaluate Honeycomb in addition to New Relic. How big of a lift would this be for your organization today? How easy is it to experiment with a new tool or service?

With an observability pipeline, we decouple the data sources from the destinations and provide a buffer. This makes the observability data easily consumable. We no longer have to figure out what data to send from containers, VMs, and infrastructure, where to send it, and how to send it. Rather, all the data is sent to the pipeline, which handles filtering it and getting it to the right places. This also gives us greater flexibility in terms of adding or removing data sinks, and it provides a buffer between data producers and consumers.

There are a few components to this pipeline which I will cover below. Many of the components can be implemented with existing open source tools or off-the-shelf services, so those I will touch on only briefly. Other parts require more involvement and some up-front thinking, so I’ll speak to them in more detail.

Data Specifications

Structured logging is hugely important to aiding debuggability. Anyone who’s shipped production code has been in the situation where they’re frantically trying to regex logs to pull out the information they need to debug a problem. It’s even worse when we’re debugging a request going through a series of microservices with haphazard logging. But structured logging isn’t just about creating better logs, it’s about creating a data pipeline that can feed the many tools you’ll need to leverage to understand, debug, and optimize complex systems, meet security and compliance requirements, and provide critical business intelligence.

In order to monitor systems, debug problems, make decisions, or automate processes, we need data. And we need the systems to give us data to provide necessary context. Aside from structured logging, one piece of advice we give every client is to pass a context object to basically everything. This context includes all of the important metadata flowing through a system—usually IDs that allow you to correlate events and piece together a story of what’s happening inside your system: user ID, account ID, trace ID, request ID, parent ID, and so on. What we want to avoid is the sort of murder-mystery debugging that often happens. A lone error log is the equivalent of finding a body. We know a crime occurred, but how do we piece together the clues to tell the right story? Observability—that is, being able to ask questions of your systems and truly explore them—requires access to pre-aggregate, raw data and support for high-cardinality dimensions.

The way to decide what goes on the context is to think about the data you wish you had while debugging an issue (this also highlights the importance of developers supporting their own systems). What is the data that would change the behavior of the system? Some examples include the user (or company), their license, time, machine stats (e.g. CPU and memory), software version, configuration data, the incoming request, downstream requests, etc. Of these, what can we get for “free” and what do we need to pass along? “Free” in this case would be things which are machine-provided, such as memory and CPU. The data we can’t get for free should go on the context, typically data that is request-specific. This context should be included on every log message.

This brings us back to the importance of structuring your data. To do this, I encourage creating standard specifications for each data type collected—logs, metrics, traces, events, etc. You can take this as far as you’d like—highly structured with a type system and rigid specification—but at a minimum, get logs into a standard format with property tags. JSON is fine for the actual structure, but be sure to version the spec so that it can evolve. For application events, one pattern that can work well is to create an inheritance structure with a base spec that applies across services (e.g. user context and tracing information are the same) and specialized specs that can be defined by services if needed. Just be careful not to leak sensitive data here—this is one area where code reviews are vital.

Specification Libraries

A key part of empowering developers is providing tools that align the “easy” path with the “right” path. If these aren’t aligned, pain-driven development creates problems. In order for developers to take advantage of structured data, specifications aren’t enough. We need libraries which implement the specs and make it easy for engineers to actually instrument their systems. For logging, there are many existing libraries. Just Google “structured logs” and your language of choice. For tracing and metrics, there are APIs like OpenTracing and OpenCensus. In practice, implementing the spec might be a combination of libraries and transformations made by the data collector described below.

Data Collector

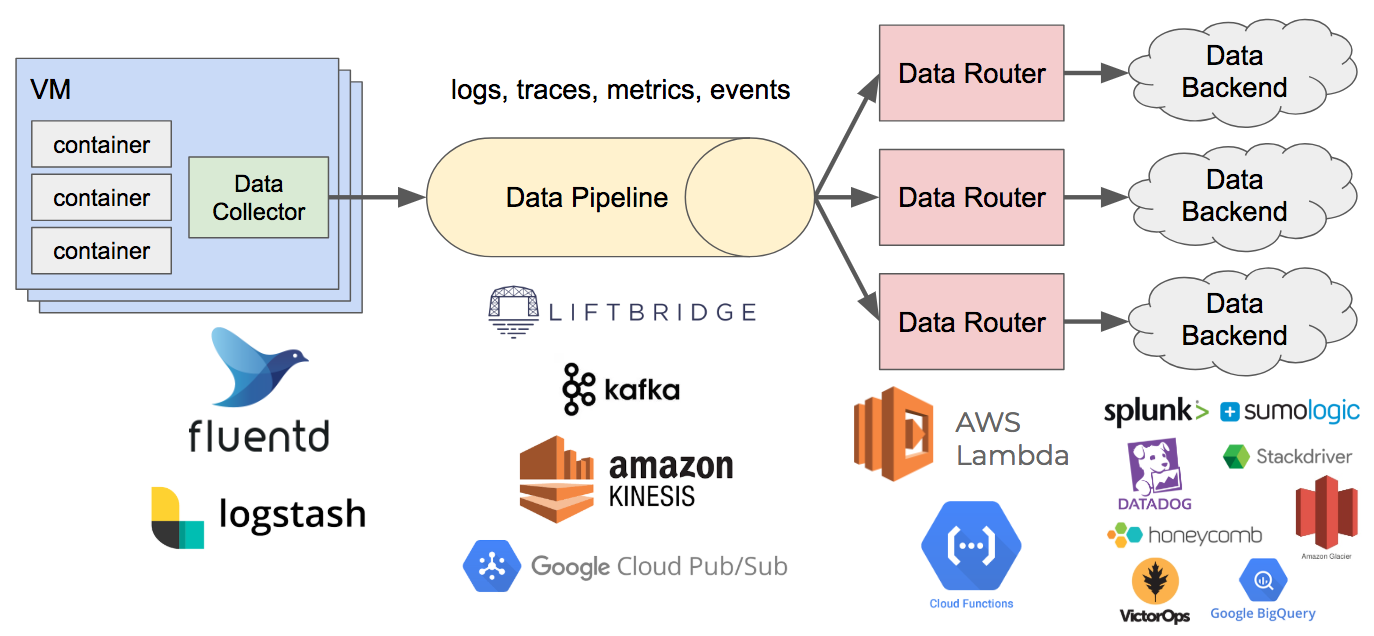
This component is responsible for collecting data from hosts, containers, or other sources and writing it to the data pipeline. It may also perform transformations or filtering of data. A couple popular open source solutions for this are Fluentd and Logstash. Typically this runs as a sidecar or agent on the host, and data is written to stdout/stderr or a Unix domain socket, which it then pushes to the pipeline.

Data Pipeline

This component is a highly scalable data stream which can handle the firehose of observability data being generated and has high availability. This also provides a buffer for the data and decouples producers from consumers. Off-the-shelf solutions include Apache Kafka, Google Cloud Pub/Sub, Amazon Kinesis Data Streams, and Liftbridge.

Data Router

This component consumes data from the pipeline, performs filtering, and writes it to the appropriate backends. It may perform some transformations and processing of the data as well, but generally any heavy processing should be the responsibility of a backend system (e.g. alerting or aggregations). This is where the data specifications come into play. The data type will determine how routers handle incoming data, e.g. routing log data to Splunk and cold storage, routing traces to Google Stackdriver, and routing metrics and APM data to New Relic.

Like the specifications and libraries, this is a component that requires some more involvement. The downside of moving away from agent-based data collection is we now have to handle routing that data ourselves. The upside is most vendors provide good APIs and client libraries which make this easier.

Since this is typically a stateless service, it’s a good fit for “serverless” solutions like Google Cloud Functions or AWS Lambda.

Piecing It All Together

Putting all of these pieces together, the observability pipeline looks something like the following:

One caveat I want to point out is that this is not something you need to build out from day one. At most of the companies where we’ve implemented this, it was something that evolved over time. For instance, with some of the clients we work with who are attempting to move to the cloud and adopt DevOps practices, we typically would not advise making a significant upfront investment to architect this pipeline. This is an ideal goal to work towards that will become increasingly important as the amount of services, traffic, and data scales. Instead, architect your systems from the beginning to be able to adopt this approach more easily—use structured logging, keep collection out-of-process, and use a centralized logging system.

For organizations that are heavily siloed, this approach can help empower teams when it comes to operating their software. Unlocking this data can also be a huge win for the business. It provides a layer of abstraction that allows you to get the data everywhere it needs to be without impacting developers and the core system. Lastly, it allows you to change backing data systems easily or test multiple in parallel. With the amount of data and the number of tools modern systems demand these days, the observability pipeline becomes just as essential to the operations of a service as the CI/CD pipeline.

More Environments Will Not Make Things Easier

Microservices are hard. They require extreme discipline. They require a lot more upfront thinking. They introduce integration challenges and complexity that you otherwise wouldn’t have with a monolith, but service-oriented design is an important part of scaling organization structure. Hundreds of engineers all working on the same codebase will only lead to angst and the inability to be nimble.

This requires a pretty significant change in the way we think about things. We’re creatures of habit, so if we’re not careful, we’ll just keep on applying the same practices we used before we did services. And that will end in frustration.

How can we possibly build working software that comprises dozens of services owned by dozens of teams? Instinct tells us full-scale integration. That’s how we did things before, right? We ran integration tests. We run all of the services we depend on and develop our service against that. But it turns out, these dozen or so services I depend on also have their own dependencies! This problem is not linear.

Okay, so we can’t run everything on our laptop. Instead, let’s just have a development environment that is a facsimile of production with everything deployed. This way, teams can develop their products against real, deployed services. The trade-off is teams need to provide a high level of stability for these “development” services since other teams are relying on them for their own development. If nothing works, development is hamstrung. Personally, I think this is a pretty reasonable trade-off because if we’re disciplined enough, it shouldn’t be hard to provide stable APIs. In fact, if we’re disciplined, it should be a requirement. This is why upfront thinking is critical. Designing your APIs is the most important thing you do. Service-oriented architecture necessitates API-driven development. Literally nothing else matters but the APIs. It reminds me of the famous Jeff Bezos mandate:

  1. All teams will henceforth expose their data and functionality through service interfaces.

  2. Teams must communicate with each other through these interfaces.

  3. There will be no other form of interprocess communication allowed: no direct linking, no direct reads of another team’s data store, no shared-memory model, no back-doors whatsoever. The only communication allowed is via service interface calls over the network.

  4. It doesn’t matter what technology they use. HTTP, Corba, Pubsub, custom protocols – doesn’t matter. Bezos doesn’t care.

  5. All service interfaces, without exception, must be designed from the ground up to be externalizable. That is to say, the team must plan and design to be able to expose the interface to developers in the outside world. No exceptions.

  6. Anyone who doesn’t do this will be fired.

  7. Thank you; have a nice day!

If we’re not disciplined, maintaining stability in a development environment becomes too difficult. So naturally, the solution becomes doubling down—we just need more environments. If every team just gets its own full-scale environment to develop against, no more stability problems. We get to develop our distributed monolith happily in our own little world. That sound you hear is every CFO collectively losing their shit, but whatever, they’re nerds and we’ve gotta get this feature to production!

Besides the obvious cost implications to this approach, perhaps the more insidious problem is it will cause teams to develop in a vacuum. In and of itself, this is not an issue, but for the undisciplined team who is not practicing rigorous API-driven development, it will create moving goalposts. A team will spend months developing its product against static dependencies only to find a massive integration headache come production time. It’s pain deferral, plain and simple. That pain isn’t being avoided or managed, you’re just neglecting to deal with instability and integration to a point where it is even more difficult. It is the opposite of the “fail-fast” mindset. It’s failing slowly and drawn out.

“We need to run everything with this particular configuration to test this, and if anyone so much as sneezes my service becomes unstable.” Good luck with that. I’ve got a dirty little secret: if you’re not disciplined, no amount of environments will make things easier. If you can’t keep your service running in an integration environment, production isn’t going to be any easier.

Similarly, massive end-to-end integration tests spanning numerous services  are an anti-pattern. Another dirty little secret: integrated tests are a scam. With a big enough system, you cannot reasonably expect to write meaningful large-scale tests in any tractable way.

What are we to do then? With respect to development, get it out of your head that you can run a facsimile of production to build features against. If you need local development, the only sane and cost-effective option is to stub. Stub everything. If you have a consistent RPC layer—discipline—this shouldn’t be too difficult. You might even be able to generate portions of stubs.

We used Google App Engine heavily at Workiva, which is a PaaS encompassing numerous services—app server, datastore, task queues, memcache, blobstore, cron, mail—all managed by Google. We were doing serverless before serverless was even a thing. App Engine provides an SDK for developing applications locally on your machine. Numerous times I overheard someone who thought the SDK was just running a facsimile of App Engine on their laptop. In reality, it was running a bunch of stubs!

If you need a full-scale deployed environment, keep in mind that stability is the cost of entry. Otherwise, you’re just delaying problems. In either case, you need stable APIs.

With respect to integration testing, the only tractable solution that doesn’t lull you into a false sense of security is consumer-driven contract testing. We run our tests against a stub, but these tests are also included in a consumer-driven contract. An API provider runs consumer-driven contract tests against its service to ensure it’s not breaking any downstream services.

All of this aside, the broader issue is ensuring a highly disciplined engineering organization. Without this, the rest becomes much more difficult as pain-driven development takes hold. Discipline is a key part of doing service-oriented design and preventing things from getting out of control as a company scales. Moving to microservices means using the right tools and processes, not just applying the old ones in a new context.

Building a Distributed Log from Scratch, Part 5: Sketching a New System

In part four of this series we looked at some key trade-offs involved with a distributed log implementation and discussed a few lessons learned while building NATS Streaming. In this fifth and final installment, we’ll conclude by outlining the design for a new log-based system that draws from the previous entries in the series.

The Context

For context, NATS and NATS Streaming are two different things. NATS Streaming is a log-based streaming system built on top of NATS, and NATS is a lightweight pub/sub messaging system. NATS was originally built (and then open sourced) as the control plane for Cloud Foundry. NATS Streaming was built in response to the community’s ask for higher-level guarantees—durability, at-least-once delivery, and so forth—beyond what NATS provided. It was built as a separate layer on top of NATS. I tend to describe NATS as a dial tone—ubiquitous and always on—perfect for “online” communications. NATS Streaming is the voicemail—leave a message after the beep and someone will get to it later. There are, of course, more nuances than this, but that’s the gist.

The key point here is that NATS and NATS Streaming are distinct systems with distinct protocols, distinct APIs, and distinct client libraries. In fact, NATS Streaming was designed to essentially act as a client to NATS. As such, clients don’t talk to NATS Streaming directly, rather all communication goes through NATS. However, the NATS Streaming binary can be configured to either embed NATS or point to a standalone deployment. The architecture is shown below in a diagram borrowed from the NATS website.
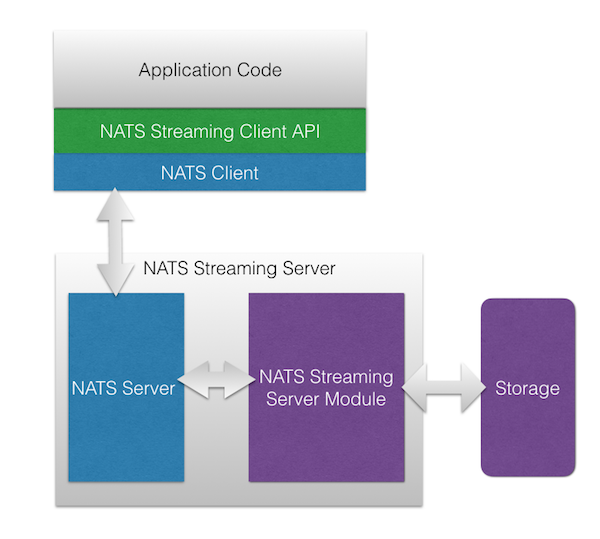
Architecturally, this makes a lot of sense. It supports the end-to-end principle in that we layer on additional functionality rather than bake it in to the underlying infrastructure. After all, we can always build stronger guarantees on top, but we can’t always remove them from below. This particular architecture, however, introduces a few challenges (disclosure: while I’m still a fan, I’m no longer involved with the NATS project and the NATS team is aware of these problems and no doubt working to address many of them).

First, there is no “cross-talk” between NATS and NATS Streaming, meaning messages published to NATS are not visible in NATS Streaming and vice versa. Again, they are two completely separate systems that just share the same infrastructure. This means we’re not really layering on message durability to NATS, we’re just exposing a new system which provides these semantics.

Second, because NATS Streaming runs as a “sidecar” to NATS and all of its communication runs through NATS, there is an inherent bottleneck at the NATS connection. This may only be a theoretical limit, but it precludes certain optimizations like using sendfile to do zero-copy reads of the log. It also means we rely on timeouts even in cases where the server could send a response immediately, such as when there is no leader elected for the cluster.

Third, NATS Streaming currently lacks a compelling story around linear scaling other than running multiple clusters and partitioning channels among them at the application level. With respect to scaling a single channel, the only alternative at the moment is to partition it into multiple channels at the application level. My hope is that as clustering matures, this will too.

Fourth, without extending its protocol, NATS Streaming’s authorization is intrinsically limited to the authorization provided by NATS since all communication goes through it. In and of itself, this isn’t a problem. NATS supports multi-user authentication and subject-level permissions, but since NATS Streaming uses an opaque protocol atop NATS, it’s difficult to setup proper ACLs at the streaming level. Of course, many layered protocols support authentication, e.g. HTTP atop TCP. For example, the NATS Streaming protocol could carry authentication tokens or session keys, but it currently does not do this.

Fifth, NATS Streaming does not support wildcard semantics, which—at least in my opinion—is a large selling point of NATS and, as a result, something users have come to expect. Specifically, NATS supports two wildcards in subject subscriptions: asterisk (*) which matches any token in the subject (e.g. foo.* matches foo.bar, foo.baz, etc.) and full wildcard (>) which matches one or more tokens at the tail of the subject (e.g. foo.> matches foo.bar, foo.bar.baz, etc.). Note that this limitation in NATS Streaming is not directly related to the overall architecture but more in how we design the log.

More generally, clustering and data replication was more of an afterthought in NATS Streaming. As we discussed in part four, it’s hard to add this after the fact. Combined with the APIs NATS Streaming provides (which do flow control and track consumer state), this creates a lot of complexity in the server.

A New System

I wasn’t involved much with NATS Streaming beyond the clustering implementation. However, from that work—and through my own use of NATS and from discussions I’ve had with the community—I’ve thought about how I would build something like it if I were to start over. It would look a bit different from NATS Streaming and Kafka, yet also share some similarities. I’ve dubbed this theoretical system Jetstream (update: this is now Liftbridge), though I’ve yet to actually build anything beyond small prototypes. It’s a side project of mine I hope to get to at some point.

Core NATS has a strong community with solid mindshare, but NATS Streaming doesn’t fully leverage this since it’s a new silo. Jetstream aims to address the above problems starting from a simple proposition: many people are already using NATS today and simply want streaming semantics for what they already have. However, we must also acknowledge that other users are happy with NATS as it currently is and have no need for additional features that might compromise simplicity or performance. This was a deciding factor in choosing not to build NATS Streaming’s functionality directly into NATS.

Like NATS Streaming, Jetstream is a separate component which acts as a NATS client. Unlike NATS Streaming, it augments NATS as opposed to implementing a wholly new protocol. More succinctly, Jetstream is a durable stream augmentation for NATS. Next, we’ll talk about how it accomplishes this by sketching out a design.

Cross-Talk

In NATS Streaming, the log is modeled as a channel. Clients create channels implicitly by publishing or subscribing to a topic (called a subject in NATS). A channel might be foo but internally this is translated to a NATS pub/sub subject such as _STAN.pub.foo. Therefore, while NATS Streaming is technically a client of NATS, it’s done so just to dispatch communication between the client and server. The log is implemented on top of plain pub/sub messaging.

Jetstream is merely a consumer of NATS. In it, the log is modeled as a stream. Clients create streams explicitly, which are subscriptions to NATS subjects that are sequenced, replicated, and durably stored. Thus, there is no “cross-talk” or internal subjects needed because Jetstream messages are NATS messages. Clients just publish their messages to NATS as usual and, behind the scenes, Jetstream will handle storing them in a log. In some sense, it’s just an audit log of messages flowing through NATS.
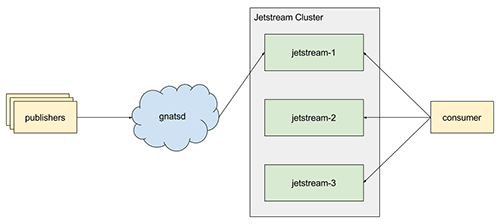
With this, we get wildcards for free since streams are bound to NATS subjects. There are some trade-offs to this, however, which we will discuss in a bit.

Performance

Jetstream does not track subscription positions. It is up to consumers to track their position in a stream or, optionally, store their position in a stream (more on this later). This means we treat a stream as a simple log, allowing us to do fast, sequential disk I/O and minimize replication and protocol chatter as well as code complexity.

Consumers connect directly to Jetstream using a pull-based socket API. The log is stored in the manner described in part one. This enables us to do zero-copy reads from a stream and other important optimizations which NATS Streaming is precluded from doing. It also simplifies things around flow control and batching as we discussed in part three.

Scalability

Jetstream is designed to be clustered and horizontally scalable from the start. We make the observation that NATS is already efficient at routing messages, particularly with high consumer fan-out, and provides clustering of the interest graph. Streams provide the unit of storage and scalability in Jetstream.

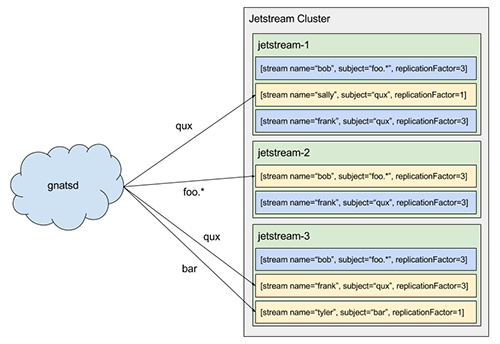
A stream is a named log attached to a NATS subject. Akin to a partition in Kafka, each stream has a replicationFactor, which controls the number of nodes in the Jetstream cluster that participate in replicating the stream, and each stream has a leader. The leader is responsible for receiving messages from NATS, sequencing them, and performing replication (NATS provides per-publisher message ordering).

Like Kafka’s controller, there is a single metadata leader for a Jetstream cluster which is responsible for processing requests to create or delete streams. If a request is sent to a follower, it’s automatically forwarded to the leader. When a stream is created, the metadata leader selects replicationFactor nodes to participate in the stream (initially, this selection is random but could be made more intelligent, e.g. selecting based on current load) and replicates the stream to all nodes in the cluster. Once this replication completes, the stream has been created and its leader begins processing messages. This means NATS messages are not stored unless there is a stream matching their subject (this is the trade-off to support wildcards, but it also means we don’t waste resources storing messages we might not care about). This can be mitigated by having publishers ensure a stream exists before publishing, e.g. at startup.

There can exist multiple streams attached to the same NATS subject or even subjects that are semantically equivalent, e.g. foo.bar and foo.*. Each of these streams will receive a copy of the message as NATS handles this fan-out. However, the stream name is unique within a given subject. For example, creating two streams for the subject foo.bar named foo and bar, respectively, will create two streams which will independently sequence all of the messages on the NATS subject foo.bar, but attempting to create two streams for the same subject both named foo will result in creating just a single stream (creation is idempotent).

With this in mind, we can scale linearly with respect to consumers—covered in part three—by adding more nodes to the Jetstream cluster and creating more streams which will be distributed among the cluster. This has the advantage that we don’t need to worry about partitioning so long as NATS is able to withstand the load (there is also an assumption that we can ensure reasonable balance of stream leaders across the cluster). We’ve basically split out message routing from storage and consumption, which allows us to scale independently.

Additionally, streams can join a named consumer group. This, in effect, partitions a NATS subject among the streams in the group, again covered in part three, allowing us to create competing consumers for load-balancing purposes. This works by using NATS queue subscriptions, so the downside is partitioning is effectively random. The upside is consumer groups don’t affect normal streams.
Compaction and Offset Tracking

Streams support multiple log-compaction rules: time-based, message-based, and size-based. As in Kafka, we also support a fourth kind: key compaction. This is how offset storage will work, which was described in part three, but it also enables some other interesting use cases like KTables in Kafka Streams.

As discussed above, messages in Jetstream are simply NATS messages. There is no special protocol needed for Jetstream to process messages. However, publishers can choose to optionally “enhance” their messages by providing additional metadata and serializing their messages into envelopes. The envelope includes a special cookie Jetstream uses to detect if a message is an envelope or a simple NATS message (if the cookie is present by coincidence and envelope deserialization fails, we fall back to treating it as a normal message).

One of the metadata fields on the envelope is an optional message key. A stream can be configured to compact by key. In this case, it retains only the last message for each key (if no key is present, the message is always retained).

Consumers can optionally store their offsets in Jetstream (this can also be transparently managed by a client library similar to Kafka’s high-level consumer). This works by storing offsets in a stream keyed by consumer. A consumer (or consumer library) publishes their latest offset. This allows them to later retrieve their offset from the stream, and key compaction means Jetstream will only retain the latest offset for each consumer. For improved performance, the client library should only periodically checkpoint this offset.

Authorization

Because Jetstream is a separate server which is merely a consumer of NATS, it can provide ACLs or other authorization mechanisms on streams. A simple configuration might be to restrict NATS access to Jetstream and configure Jetstream to only allow access to certain subjects. There is more work involved because there is a separate access-control system, but this gives greater flexibility by separating out the systems.

At-Least Once Delivery

To ensure at-least-once delivery of messages, Jetstream relies on replication and publisher acks. When a message is received on a stream, it’s assigned an offset by the leader and then replicated. Upon a successful replication, the stream publishes an ack to NATS on the reply subject of the message, if present (the reply subject is a part of the NATS message protocol).

There are two implications with this. First, if the publisher doesn’t care about ensuring its message is stored, it need not set a reply subject. Second, because there are potentially multiple (or no) streams attached to a subject (and creation/deletion of streams is dynamic), it’s not possible for the publisher to know how many acks to expect. This is a trade-off we make for enabling subject fan-out and wildcards while remaining scalable and fast. We make the assertion that if guaranteed delivery is important, the publisher should be responsible for determining the destination streams a priori. This allows attaching streams to a subject for use cases that do not require strong guarantees without the publisher having to be aware. Note that this might be an area for future improvement to increase usability, such as storing streams in a registry. However, this is akin to other similar systems, like Kafka, where you must first create a topic and then you publish to that topic.

One caveat to this is if there are existing application-level uses of the reply subject on NATS messages. That is, if other systems are already publishing replies, then Jetstream will overload this. The alternative would be to require the envelope, which would include a canonical reply subject for acks, for at-least-once delivery. Otherwise we would need a change to the NATS protocol itself.

Replication Protocol

For metadata replication and leadership election, we rely on Raft. However, for replication of streams, rather than using Raft or other quorum-based techniques, we use a technique similar to Kafka as described in part two.

For each stream, we maintain an in-sync replica set (ISR), which is all of the replicas currently up to date (at stream creation time, this is all of the replicas). During replication, the leader writes messages to a WAL, and we only wait on replicas in the ISR before committing. If a replica falls behind or fails, it’s removed from the ISR. If the leader fails, any replica in the ISR can take its place. If a failed replica catches back up, it rejoins the ISR. The general stream replication process is as follows:

  1. Client creates a stream with a replicationFactor of n.
  2. Metadata leader selects n replicas to participate and one leader at random (this comprises the initial ISR).
  3. Metadata leader replicates the stream via Raft to the entire cluster.
  4. The nodes participating in the stream initialize it, and the leader subscribes to the NATS subject.
  5. The leader initializes the high-water mark (HW) to 0. This is the offset of the last committed message in the stream.
  6. The leader begins sequencing messages from NATS and writes them to the log uncommitted.
  7. Replicas consume from the leader’s log to replicate messages to their own log. We piggyback the leader’s HW on these responses, and replicas periodically checkpoint the HW to stable storage.
  8. Replicas acknowledge they’ve replicated the message.
  9. Once the leader has heard from the ISR, the message is committed and the HW is updated.

Note that clients only see committed messages in the log. There are a variety of failures that can occur in the replication process. A few of them are described below along with how they are mitigated.

If a follower suspects that the leader has failed, it will notify the metadata leader. If the metadata leader receives a notification from the majority of the ISR within a bounded period, it will select a new leader for the stream, apply this update to the Raft group, and notify the replica set. These notifications need to go through Raft as well in the event of a metadata leader failover occurring at the same time as a stream leader failure. Committed messages are always preserved during a leadership change, but uncommitted messages could be lost.

If the stream leader detects that a replica has failed or fallen too far behind, it removes the replica from the ISR by notifying the metadata leader. The metadata leader replicates this fact via Raft. The stream leader continues to commit messages with fewer replicas in the ISR, entering an under-replicated state.

When a failed replica is restarted, it recovers the latest HW from stable storage and truncates its log up to the HW. This removes any potentially uncommitted messages in the log. The replica then begins fetching messages from the leader starting at the HW. Once the replica has caught up, it’s added back into the ISR and the system resumes its fully replicated state.

If the metadata leader fails, Raft will handle electing a new leader. The metadata Raft group stores the leader and ISR for every stream, so failover of the metadata leader is not a problem.

There are a few other corner cases and nuances to handle, but this covers replication in broad strokes. We also haven’t discussed how to implement failure detection (Kafka uses ZooKeeper for this), but we won’t prescribe that here.

Wrapping Up

This concludes our series on building a distributed log that is fast, highly available, and scalable. In part one, we introduced the log abstraction and talked about the storage mechanics behind it. In part two, we covered high availability and data replication. In part three, we we discussed scaling message delivery. In part four, we looked at some trade-offs and lessons learned. Lastly, in part five, we outlined the design for a new log-based system that draws from the previous entries in the series.

The goal of this series was to learn a bit about the internals of a log abstraction, to learn how it can achieve the three priorities described earlier, and to learn some applied distributed systems theory. Hopefully you found it useful or, at the very least, interesting.

If you or your company are looking for help with system architecture, performance, or scalability, contact Real Kinetic.
Building a Distributed Log from Scratch, Part 4: Trade-Offs and Lessons Learned

In part three of this series we talked about scaling message delivery in a distributed log. In part four, we’ll look at some key trade-offs involved with such systems and discuss a few lessons learned while building NATS Streaming.

Competing Goals

There are a number of competing goals when building a distributed log (these goals also extend to many other types of systems). Recall from part one that our key priorities for this type of system are performance, high availability, and scalability. The preceding parts of this series described at various levels how we can accomplish these three goals, but astute readers likely noticed that some of these things conflict with one another.

It’s easy to make something fast if it’s not fault-tolerant or scalable. If our log runs on a single server, our only constraints are how fast we can send data over the network and how fast the disk I/O is. And this is how a lot of systems, including many databases, tend to work—not only because it performs well, but because it’s simple. We can make these types of systems fault-tolerant by introducing a standby server and allowing clients to failover, but there are a couple issues worth mentioning with this.

With data systems, such as a log, high availability does not just pertain to continuity of service, but also availability of data. If I write data to the system and the system acknowledges that, that data should not be lost in the event of a failure. So with a standby server, we need to ensure data is replicated to avoid data loss (otherwise, in the context of a message log, we must relax our requirement of guaranteed delivery).

NATS Streaming initially shipped as a single-node system, which raised immediate concerns about production-readiness due to a single point of failure. The first step at trying to address some of these concerns was to introduce a fault-tolerance mode whereby a group of servers would run and only one would run as the active server. The active server would obtain an exclusive lock and process requests. Upon detecting a failure, standby servers would attempt to obtain the lock and become the active server.

Aside from the usual issues with distributed locks, this design requires a shared storage layer. With NATS Streaming, this meant either a shared volume, such as Gluster or EFS, or a shared MySQL database. This poses a performance challenge and isn’t particularly “cloud-native” friendly. Another issue is data is not replicated unless done so out-of-band by the storage layer. When we add in data replication, performance is hamstrung even further. But this was a quick and easy solution that offered some solace with respect to a SPOF (disclosure: I was not involved with NATS or NATS Streaming at this time). The longer term solution was to provide first-class clustering and data-replication support, but sometimes it’s more cost effective to provide fast recovery of a single-node system.

Another challenge with the single-node design is scalability. There is only so much capacity that one node can handle. At a certain point, scaling out becomes a requirement, and so we start partitioning. This is a common technique for relational databases where we basically just run multiple databases and divide up the data by some key. NATS Streaming is no different as it offers a partitioning story for dividing up channels between servers. The trouble with partitioning is it complicates things as it typically requires cooperation from the application. To make matters worse, NATS Streaming does not currently offer partitioning at the channel level, which means if a single topic has a lot of load, the solution is to manually partition it into multiple channels at the application level. This is why Kafka chose to partition its topics by default.

So performance is at odds with fault-tolerance and scalability, but another factor is what I call simplicity of mechanism. That is, the simplicity of the design plays an important role in the performance of a system. This plays out at multiple levels. We saw that, at an architectural level, using a simple, single-node design performs best but falls short as a robust solution. In part one, we saw that using a simple file structure for our log allowed us to take advantage of the hardware and operating system in terms of sequential disk access, page caching, and zero-copy reads. In part two, we made the observation that we can treat the log itself as a replicated WAL to solve the problem of data replication in an efficient way. And in part three, we discussed how a simple pull-based model can reduce complexity around flow control and batching.

At the same time, simplicity of “UX” makes performance harder. When I say UX, I mean the ergonomics of the system and how easy it is to use, operate, etc. NATS Streaming initially optimized for UX, which is why it fills an interesting space. Simplicity is a core part of the NATS philosophy, so it caught a small mindshare with developers frustrated or overwhelmed by Kafka. There is appetite for a “Kafka lite,” something which serves a similar purpose to Kafka but without all the bells and whistles and probably not targeted at large enterprises—a classic Innovator’s Dilemma to be sure.

NATS Streaming tracks consumer positions automatically, provides simple APIs, and uses a simple push-based protocol. This also means building a client library is a much less daunting task. The downside is the server needs to do more work. With a single node, as NATS Streaming was initially designed, this isn’t much of a problem. Where it starts to rear its head is when we need to replicate that state across a cluster of nodes. This has important implications with respect to performance and scale. Smart middleware has a natural tendency to become more complex, more fragile, and slower. The end-to-end principle attests to this. Amusingly, NATS Streaming was originally named STAN because it’s the opposite of NATS, a fast and simple messaging system with minimal guarantees.

Simplicity of mechanism tends to simply push complexity around in the system. For example, NATS Streaming provides an ergonomic API to clients by shifting the complexity to the server. Kafka scales and performs exceptionally well by shifting the complexity to other parts of the system, namely the client and ZooKeeper.

Scalability and fault-tolerance are equally at odds with simplicity for reasons mostly described above. The important point here is that these cannot be an afterthought. As I learned while implementing clustering in NATS Streaming, you can’t cleanly and effectively bolt on fault-tolerance onto an existing complex system. One of the laws of Systemantics comes to mind here: “A complex system designed from scratch never works and cannot be patched up to make it work. You have to start over, beginning with a working simple system.” Scalability and fault-tolerance need to be designed from day one.

Lastly, availability is inherently at odds with consistency. This is simply the CAP theorem. Guaranteeing strong consistency requires a quorum when replicating data, which hinders availability and performance. The key here is minimize what you need to replicate or relax your requirements.

Lessons Learned

The section above already contains several lessons learned in the process of working on NATS Streaming and implementing clustering, but I’ll capture a few important ones here.

First, distributed systems are complex enough. Simple is usually better—and faster. Again, we go back to the laws of systems here: “A complex system that works is invariably found to have evolved from a simple system that works.”

Second, lean on existing work. A critical part to delivering clustering rapidly was sticking with Raft and an existing Go implementation for leader election and data replication. There was considerable time spent designing a proprietary solution before I joined which still had edge cases not fully thought through. Not only is Raft off the shelf, it’s provably correct (implementation bugs notwithstanding). And following from the first lesson learned, start with a solution that works before worrying about optimization. It’s far easier to make a correct solution fast than it is to make a fast solution correct. Don’t roll your own coordination protocol if you don’t need to (and chances are you don’t need to).

There are probably edge cases for which you haven’t written tests. There are many failures modes, and you can only write so many tests. Formal methods and property-based testing can help a lot here. Similarly, chaos and fault-injection testing such as Kyle Kingsbury’s Jepsen help too.

Lastly, be honest with your users. Don’t try to be everything to everyone. Instead, be explicit about design decisions, trade-offs, guarantees, defaults, etc. If there’s one takeaway from Kyle’s Jepsen series it’s that many vendors are dishonest in their documentation and marketing. MongoDB became infamous for having unsafe defaults and implementation issues early on, most likely because they make benchmarks look much more impressive.

In part five of this series, we’ll conclude by outlining the design for a new log-based system that draws from ideas in the previous entries in the series.