Authenticating Stackdriver Uptime Checks for Identity-Aware Proxy

Google Stackdriver provides a set of tools for monitoring and managing services running in GCP, AWS, or on-prem infrastructure. One feature Stackdriver has is “uptime checks,” which enable you to verify the availability of your service and track response latencies over time from up to six different geographic locations around the world. While Stackdriver uptime checks are not as feature-rich as other similar products such as Pingdom, they are also completely free. For GCP users, this provides a great starting point for quickly setting up health checks and alerting for your applications.

Last week I looked at implementing authentication and authorization for APIs in GCP using Cloud Identity-Aware Proxy (IAP). IAP provides an easy way to implement identity and access management (IAM) for applications and APIs in a centralized place. However, one thing you will bump into when using Stackdriver uptime checks in combination with IAP is authentication. For App Engine in particular, this can be a problem since there is no way to bypass IAP. All traffic, both internal and external to GCP, goes through it. Until Cloud IAM Conditions is released and generally available, there’s no way to—for example—open up a health-check endpoint with IAP.

While uptime checks have support for Basic HTTP authentication, there is no way to script more sophisticated request flows (e.g. to implement the OpenID Connect (OIDC) authentication flow for IAP-protected resources) or implement fine-grained IAM policies (as hinted at above, this is coming with IAP Context-Aware Access and IAM Conditions). So are we relegated to using Nagios or some other more complicated monitoring tool? Not necessarily. In this post, I’ll present a workaround solution for authenticating Stackdriver uptime checks for systems protected by IAP using Google Cloud Functions.

The Solution

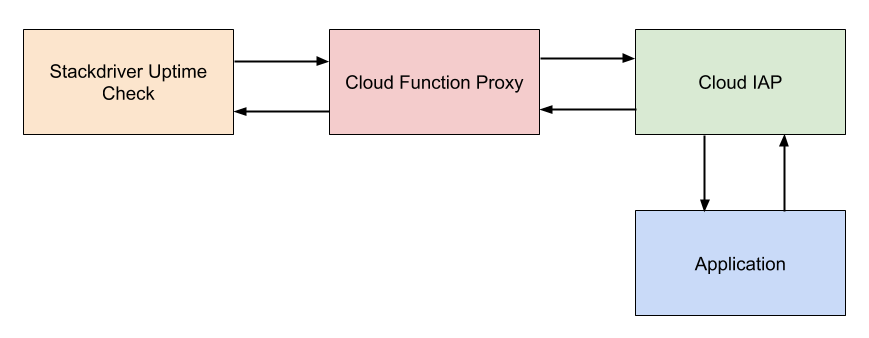
The general strategy is to use a Cloud Function which can authenticate with IAP using a service account to proxy uptime checks to the application. Essentially, the proxy takes a request from a client, looks for a header containing a host, forwards the request that host after performing the necessary authentication, and then forwards the response back to the client. The general architecture of this is shown below.

There are some trade-offs with this approach. The benefit is we get to rely on health checks that are fully managed by GCP and free of charge. Since Cloud Functions are also managed by GCP, there’s no operations involved beyond deploying the proxy and setting it up. The first two million invocations per month are free for Cloud Functions. If we have an uptime check running every five minutes from six different locations, that’s approximately 52,560 invocations per month. This means we could run roughly 38 different uptime checks without exceeding the free tier for invocations. In addition to invocations, the free tier offers 400,000 GB-seconds, 200,000 GHz-seconds of compute time and 5GB of Internet egress traffic per month. Using the GCP pricing calculator, we can estimate the cost for our uptime check. It generally won’t come close to exceeding the free tier.

The downside to this approach is the check is no longer validating availability from the perspective of an end user. Because the actual service request is originating from Google’s infrastructure by way of a Cloud Function as opposed to Stackdriver itself, it’s not quite the same as a true end-to-end check. That said, both Cloud Functions and App Engine rely on the same Google Front End (GFE) infrastructure, so as long as both the proxy and App Engine application are located in the same region, this is probably not all that important. Besides, for App Engine at least, the value of the uptime check is really more around performing a full-stack probe of the application and its dependencies than monitoring the health of Google’s own infrastructure. That is one of the goals behind using managed services after all. The bigger downside is that the latency reported by the uptime check no longer accurately represents the application. It can still be useful for monitoring aggregate trends nonetheless.

The Implementation Setup

I’ve built an open-source implementation of the proxy as a Cloud Function in Python called gcp-oidc-proxy. It’s runnable out of the box without any modification. We’ll assume you have an IAP-protected application you want to setup a Stackdriver uptime check for. To deploy the proxy Cloud Function, first clone the repository to your machine, then from there run the following gcloud command:

$ gcloud functions deploy gcp-oidc-proxy \
   --runtime python37 \
   --entry-point handle_request \
   --trigger-http

This will deploy a new Cloud Function called gcp-oidc-proxy to your configured cloud project. It will assume the project’s default service account. Ordinarily, I would suggest creating a separate service account to limit scopes. This can be configured on the Cloud Function with the –service-account flag, which is under gcloud beta functions deploy at the time of this writing. We’ll omit this step for brevity however.

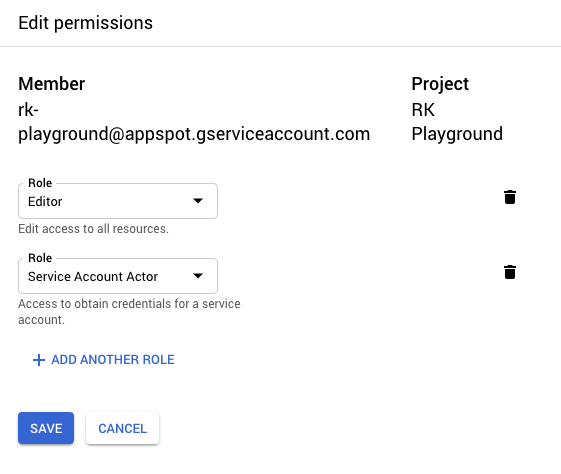
Next, we need to add the “Service Account Actor” IAM role to the Cloud Function’s service account since it will need it to sign JWTs (more on this later). In the GCP console, go to IAM & admin, locate the appropriate service account (in this case, the default service account), and add the respective role.

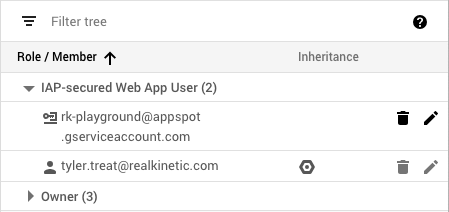
The Cloud Function’s service account must also be added as a member to the IAP with the “IAP-secured Web App User” role in order to properly authenticate. Navigate to Identity-Aware Proxy in the GCP console, select the resource you wish to add the service account to, then click Add Member.

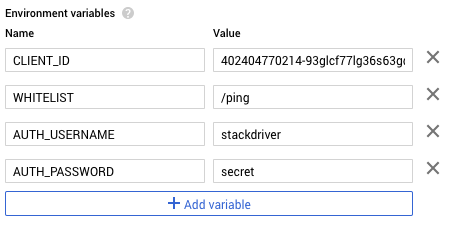
Find the OAuth2 client ID for the IAP by clicking on the options menu next to the IAP resource and select “Edit OAuth client.” Copy the client ID on the next page and then navigate to the newly deployed gcp-oidc-proxy Cloud Function. We need to configure a few environment variables, so click edit and then expand more at the bottom of the page. We’ll add four environment variables: CLIENT_ID, WHITELIST, AUTH_USERNAME, and AUTH_PASSWORD.

CLIENT_ID contains the OAuth2 client ID we copied for the IAP. WHITELIST contains a comma-separated list of URL paths to make accessible or * for everything (I’m using /ping in my example application), and AUTH_USERNAME and AUTH_PASSWORD setup Basic authentication for the Cloud Function. If these are omitted, authentication is disabled.

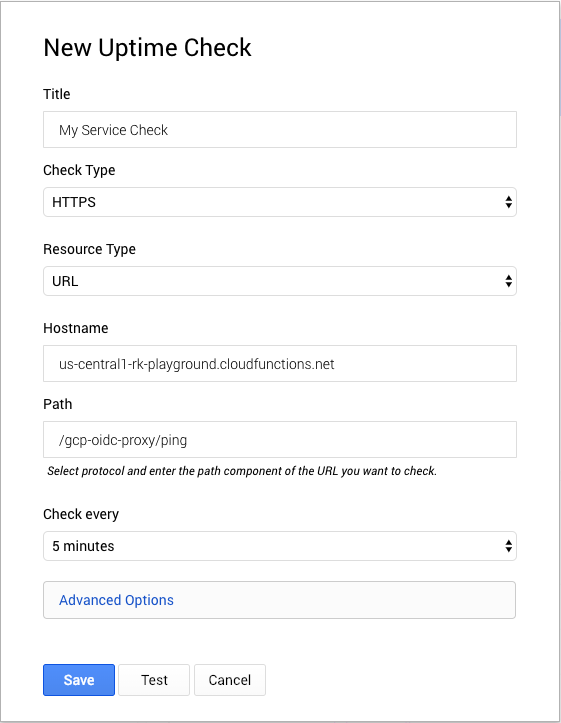
Save the changes to redeploy the function with the new environment variables. Next, we’ll setup a Stackdriver uptime check that uses the proxy to call our service. In the GCP console, navigate to Monitoring then Create Check from the Stackdriver UI. Skip any suggestions for creating a new uptime check. For the hostname, use the Cloud Function host. For the path, use /gcp-oidc/proxy/<your-endpoint>. The proxy will use the path to make a request to the protected resource.

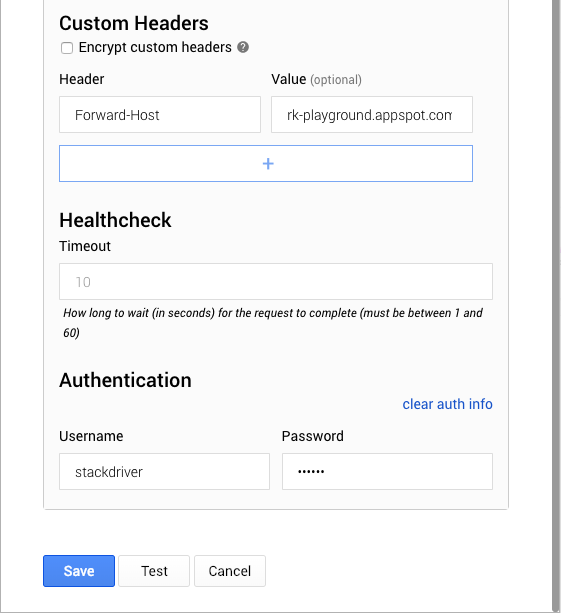
Expand Advanced Options to set the Forward-Host to the host protected by IAP. The proxy uses this header to forward requests. Lastly, we’ll set the authentication username and password that we configured on the Cloud Function.

Click “Test” to ensure our configuration works and the check passes.

The Implementation Details

The remainder of this post will walk you through the implementation details of the proxy. The implementation closely resembles what we did to authenticate API consumers using a service account. We use a header called Forward-Host to allow the client to specify the IAP-authenticated host to forward requests to. If the header is not present, we just return a 400 error. We then use this host and the path of the original request to construct the proxy request and retain the HTTP method and headers (with the exception of the Host header, if present, since this can cause problems).

Before sending the request, we perform the authentication process by generating a JWT signed by the service account and exchange it for a Google-signed OIDC token.

We can cache this token and renew it only once it expires. Then we set the Authorization header with the OIDC token and send the request.

We simply forward on the resulting content body, status code, and headers. We strip HTTP/1.1 “hop-by-hop” headers since these are unsupported by WSGI and Python Cloud Functions rely on Flask. We also strip any Content-Encoding header since this can also cause problems.

Because this proxy allows clients to call into endpoints unauthenticated, we also implement a whitelist to expose only certain endpoints. The whitelist is a list of allowed paths passed in from an environment variable. Alternatively, we can whitelist * to allow all paths. Wildcarding could be implemented to make this even more flexible. We also implement a Basic auth decorator which is configured with environment variables since we can setup uptime checks with a username and password in Stackdriver.

The only other code worth looking at in detail is how we setup the service account credentials and IAM Signer. A Cloud Function has a service account attached to it which allows it to assume the roles of that account. Cloud Functions rely on the Google Compute Engine metadata server which stores service account information among other things. However, the metadata server doesn’t expose the service account key used to sign the JWT, so instead we must use the IAM signBlob API to sign JWTs.

Conclusion

It’s not a particularly simple solution, but it gets the job done. The setup of the Cloud Function could definitely be scripted as well. Once IAM Conditions is generally available, it should be possible to expose certain endpoints in a way that is accessible to Stackdriver without the need for the OIDC proxy. That said, it’s not clear if there is a way to implement uptime checks without exposing an endpoint at all since there is currently no way to assign a service account to a check. Ideally, we would be able to assign a service account and use that with IAP Context-Aware Access to allow the uptime check to access protected endpoints.

API Authentication with GCP Identity-Aware Proxy

Cloud Identity-Aware Proxy (Cloud IAP) is a free service which can be used to implement authentication and authorization for applications running in Google Cloud Platform (GCP). This includes Google App Engine applications as well as workloads running on Compute Engine (GCE) VMs and Google Kubernetes Engine (GKE) by way of Google Cloud Load Balancers.

When enabled, IAP requires users accessing a web application to login using their Google account and ensure they have the appropriate role to access the resource. This can be used to provide secure access to web applications without the need for a VPN. This is part of what Google now calls BeyondCorp, which is an enterprise security model designed to enable employees to work from untrusted networks without a VPN. At Real Kinetic, we frequently bump into companies practicing Death-Star security, which is basically relying on a hard outer shell to protect a soft, gooey interior. It’s simple and easy to administer, but it’s also vulnerable. That’s why we always approach security from a perspective of defense in depth.

However, in this post I want to explore how we can use Cloud IAP to implement authentication and authorization for APIs in GCP. Specifically, I will use App Engine, but the same applies to resources behind an HTTPS load balancer. The goal is to provide a way to securely expose APIs in GCP which can be accessed programmatically.

Configuring Identity-Aware Proxy

Cloud IAP supports authenticating service accounts using OpenID Connect (OIDC). A service account belongs to an application instead of an individual user. You authenticate a service account when you want to allow an application to access your IAP-secured resources. A GCP service account can either have GCP-managed keys (for systems that reside within GCP) or user-managed keys (for systems that reside outside of GCP). GCP-managed keys cannot be downloaded and are automatically rotated and used for signing for a maximum of two weeks. User-managed keys are created, downloaded, and managed by users and expire 10 years from creation. As such, key rotation must be managed by the user as appropriate. In either case, access using a service account can be revoked either by revoking a particular key or removing the service account itself.

An IAP is associated with an App Engine application or HTTPS Load Balancer. One or more service accounts can then be added to an IAP to allow programmatic authentication. When the IAP is off, the resource is accessible to anyone with the URL. When it’s on, it’s only accessible to members who have been granted access. This can include specific Google accounts, groups, service accounts, or a general G Suite domain.

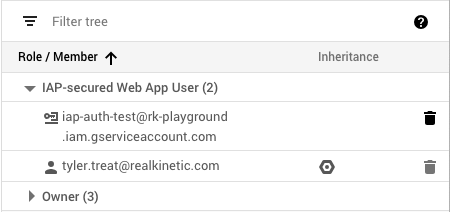
IAP will create an OAuth2 client ID for OIDC authentication which can be used by service accounts. But in order to access our API using a service account, we first need to add it to IAP with the appropriate role. We’ll add it as an IAP-secured Web App User, which allows access to HTTPS resources protected by IAP. In this case, my service account is called “IAP Auth Test,” and the email associated with it is iap-auth-test@rk-playground.iam.gserviceaccount.com.

As you can see, both the service account and my user account are IAP-secured Web App Users. This means I can access the application using my Google login or using the service account credentials. Next, we’ll look at how to properly authenticate using the service account.

Authenticating API Consumers

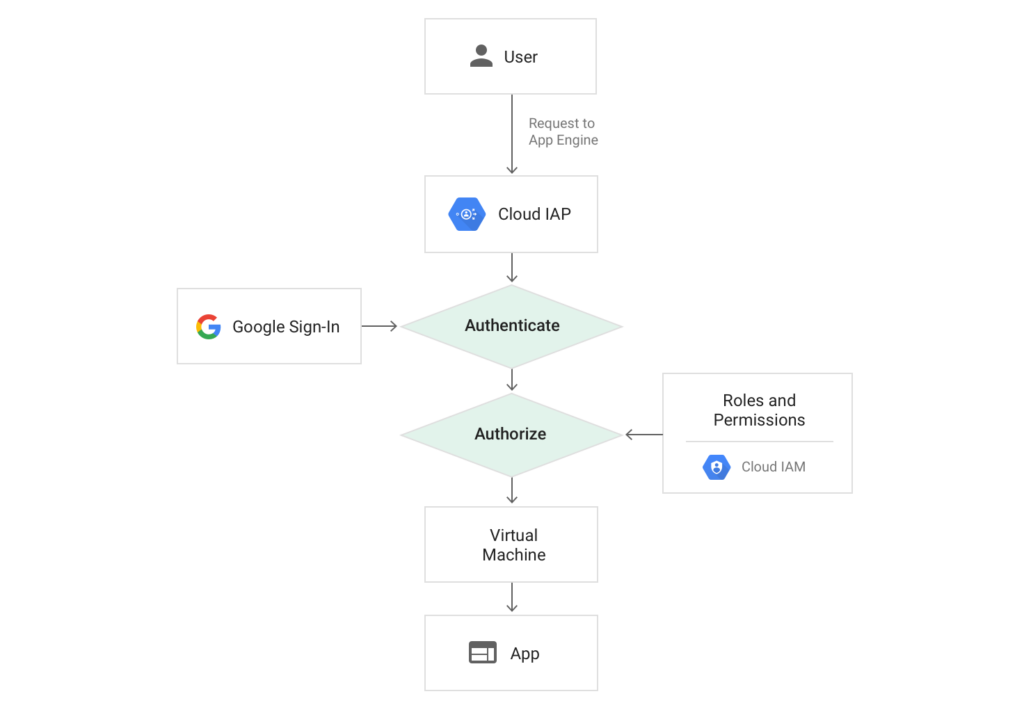
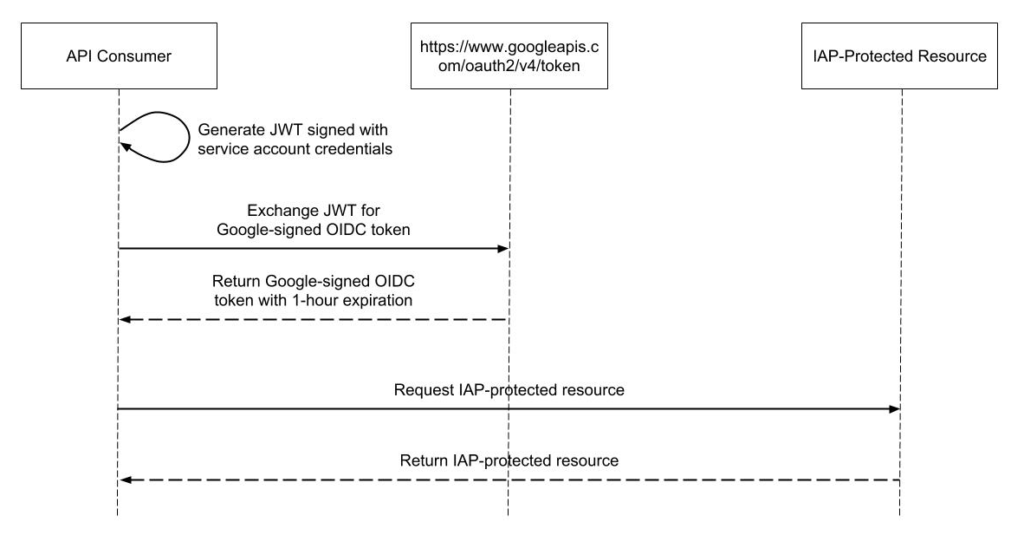
When you create a service account key in the GCP console, it downloads a JSON credentials file to your machine. The API consumer needs the service account credentials to authenticate. The diagram below illustrates the general architecture of how IAP authenticates API calls to App Engine services using service accounts.

In order to make a request to the IAP-authenticated resource, the consumer generates a JWT signed using the service account credentials. The JWT contains an additional target_audience claim containing the OAuth2 client ID from the IAP. To find the client ID, click on the options menu next to the IAP resource and select “Edit OAuth client.” The client ID will be listed on the resulting page. My code to generate this JWT looks like the following:

This assumes you have access to the service account’s private key. If you don’t have access to the private key, e.g. because you’re running on GCE or Cloud Functions and using a service account from the metadata server, you’ll have to use the IAM signBlob API. We’ll cover this in a follow-up post.

This JWT is then exchanged for a Google-signed OIDC token for the client ID specified in the JWT claims. This token has a one-hour expiration and must be renewed by the consumer as needed. To retrieve a Google-signed token, we make a POST request containing the JWT and grant type to https://www.googleapis.com/oauth2/v4/token.

This returns a Google-signed JWT which is good for about an hour. The “exp” claim can be used to check the expiration of the token. Authenticated requests are then made by setting the bearer token in the Authorization header of the HTTP request:

Authorization: Bearer <token>

Below is a sequence diagram showing the process of making an OIDC-authenticated request to an IAP-protected resource.

Because this is quite a bit of code and complexity, I’ve implemented the process flow in Java as a Spring RestTemplate interceptor. This transparently authenticates API calls, caches the OIDC token, and handles automatically renewing it. Google has also provided examples of authenticating from a service account for other languages.

With IAP, we’re able to authenticate and authorize requests at the edge before they even reach our application. And with Cloud Audit Logging, we can monitor who is accessing protected resources. Be aware, however, that if you’re using GCE or GKE, users who can access the application-serving port of the VM can bypass IAP authentication. GCE and GKE firewall rules can’t protect against access from processes running on the same VM as the IAP-secured application. They can protect against access from another VM, but only if properly configured. This does not apply for App Engine since all traffic goes through the IAP infrastructure.

Alternative Solutions

There are some alternatives to IAP for implementing authentication and authorization for APIs. Apigee is one option, which Google acquired not too long ago. This is a more robust API-management solution which will do a lot more than just secure APIs, but it’s also more expensive. Another option is Google Cloud Endpoints, which is an NGINX-based proxy that provides mechanisms to secure and monitor APIs. This is free up to two million API calls per month.

Lastly, you can also simply implement authentication and authorization directly in your application instead of with an API proxy, e.g. using OAuth2. This has downsides in that it can introduce complexity and room for mistakes, but it gives you full control over your application’s security. Following our model of defense in depth, we often encourage clients to implement authentication both at the edge (e.g. by ensuring requests have a valid token) and in the application (e.g. by validating the token on a request). This way, we avoid implementing a Death-Star security model.


Operations in the World of Developer Enablement

NewOps is not a replacement for DevOps, it’s an evolution of it by looking at Operations through the lens of product. It’s what I’ve come to call “Developer Enablement” because the goal is to shift the focus of Ops teams from being masters of production to enablers of production. Through Developer Enablement, teams are enabled—and tasked with the responsibility—to control their own destiny. This extends far beyond just the responsibility of building products. It includes how we build, test, secure, deploy, monitor, and operate systems.

For some, this might come naturally. Many startups don’t have the privilege of siloing up their organizations (although you’d be surprised!). For others, this can be a major shift in how we build software. Especially in large, established organizations with more specialized roles, responsibilities can be so siloed people aren’t even aware they’re happening. Basic “ilities” like scalability, reliability, and even security become someone else’s responsibility. “Good Operations” means no one even knows you’re there, unless something goes wrong.

So when this is turned on its ear, and these responsibilities are placed on the dev team’s shoulders, how do they adapt? In many cases, teams are eager to take on these new responsibilities but also blissfully unaware of what that actually entails. DBAs are a good example of this. Often a staple of enterprise IT Ops, DBAs are tasked with—among other things—installing and patching DBMSs, performing backups, managing HA and DR strategies, balancing database workloads, managing resources, tuning performance, configuring security settings, and monitoring systems. Many of these responsibilities are invisible to developers.

With cloud and Developer Enablement, this can change in profound ways. However, in a typical lift-and-shift, the role of DBAs is widely unchanged. In this case, we’re just running the same stuff in someone else’s data center. There are still databases to be patched, replication to be managed, backups to be made, and so on. But pure lift-and-shifts, at least as an end goal, are largely a misstep. You throw away all that institutional memory—the knowledge and experience you have managing your own data center—for more expensive compute with which you have less experience administering. Things change when we start to rely on managed cloud services. We no longer run our own databases on VMs but instead rely on cloud-managed ones. This is where things become much more grey—but also much more interesting.

Developer Enablement in the Cloud

First, a quick aside. There are two different concepts we’re talking about here: cloud and Developer Enablement (DevOps for brevity). These are two distinct but related concepts. We can “do” DevOps on-prem, just as we can in the cloud. Likewise, we can also do traditional Operations in the cloud, just as we can on-prem. One of the benefits of cloud is it allows us to focus more investment on business-differentiating things, but it also makes implementing DevOps easier for two reasons. First, the cloud provider takes on more operational responsibilities (the stuff that supports—but doesn’t directly contribute to—business value). Second, it provides a lower barrier to self-service infrastructure. This means developers can, of their own accord, provision and manage supporting infrastructure like databases, caches, queues, and other things without a go-between or the customary “throw-it-over-the-wall” approach. This is a key part of Developer Enablement.

In the world of Developer Enablement in the cloud, what is the role of a DBA, or any other Ops person for that matter? When you start to map who is accountable for what, you quickly realize there is far too much nuance to cleanly map responsibilities. Which cloud provider are we talking about? Within that cloud provider, which database offering? Proprietary NoSQL databases like Google’s Cloud Datastore? Relational databases like Amazon’s RDS? Globally-distributed databases like Spanner? How we handle things like HA and DR vary drastically depending on the service and service provider. In some cases, the vendor is entirely responsible, e.g. because the database has built-in replication. In other cases, the customer. Sometimes it’s a combination of both, such as a database that has automated backups which must first be enabled. It’s not as cut and dry as it used to be.

As we push more responsibility onto developers, how do we ensure they are actually tackling all of those responsibilities, especially the ones they might not even know about? How do we implement DevOps responsibly?

The goal of Developer Enablement is not to enable developers by giving them total control and free rein. Instead, it’s to empower them in a way that is “safe” for the business. People often misconstrue DevOps and automation as things that reduce lead times and increase deployment frequencies by simply pulling security out of the process. This is categorically not the purpose of DevOps. In fact, the intention is to improve security by integrating it more deeply and earlier into the process in a more reliable and repeatable way, i.e. “shift left.” Developer Enablement is about providing the tools, automation, services, and standards teams need to do just this.

So when we say we want to implement DevOps and Developer Enablement, we’re not saying we want to hand developers the keys to production with a pat on the back. We’re saying we want to pave a path to production which allows developers to release software in a way that is safe and secure with greater autonomy—because autonomy enables building more reliable software faster. In this world, Operations teams become increasingly Developer Enablement teams because there is simply less stuff to operate. It becomes more about supporting development teams and organizing around products than acting purely as a gatekeeper or service provider. It’s pretty amazing how things start to improve when you align yourself this way.

Responsibilities of Developer Enablement

Those Operations teams still have extremely valuable skill sets however. It’s just that they start to act more in an advisory role than the assembly-line-worker role converting Jira tickets into outputs. For instance, DBAs have deep expertise on the intricacies and operations of various database systems, but when Amazon is now responsible for installing the database, patching it, scaling it, monitoring it, performing backups, managing replication and failovers, and handling encryption and security, what do the DBAs do? They become domain experts and developer advocates. They make sure teams aren’t shooting themselves—or the company—in the foot and provide domain expertise and tooling in a supporting role. When a developer complains about a slow query, they are the ones who can help them identify, understand, and fix the problem. “It’s doing a full-table scan since you’re missing an index,” or “You have a hot partition because you’re using a timestamp as the partition key. Try using a more uniform ID to distribute workloads evenly.” These folks can often help developers better structure their data to improve application performance and scalability.

In addition to this supporting role, these Developer Enablement teams also help ensure dev teams are thinking about all the things they need to be considering. In the case of data, how is encryption handled? HA? DR? Data migrations? Rollbacks? Not that all of these things need to be handled by the teams themselves—again, often the cloud provider has it covered—but simply ensuring that they have been considered and can be spoken to is important. It’s vital to start this conversation early in the development process.

The Three Phases of Development

There are basically three phases of development to consider. There’s the “playground” phase, which is when teams are essentially exploring different technologies. At this stage, there can be little-to-no oversight outside of controlling cloud spend (which is important for when your intern accidentally starts a task bomb before leaving for the weekend). Teams are free to try out new ideas without worrying about production. Often this work happens in a separate “experimentation” cloud project.

Next, there’s the “green-light” phase. The thing being built is going to production, it’s part of the company’s strategic plan, people are talking about it, etc. At this point, we start an ongoing dialogue with the team and provide them with a list of the key things to be thinking about. This should not be a 10-page document. It should be a one-page document hitting the main areas. An example portion of this might look like the following:

  • How do you plan to implement HA?
  • What classifications of data will this system handle and how do you plan to secure that data in transit and at rest?
  • How much traffic do you expect the system to handle and how will you scale it?
  • How will the system handle authentication and authorization?
  • What are the integration points?
  • Who will support the system in production?
  • What is the CI/CD story for the system?
  • What is the testing strategy?

Depending on your company’s culture, this can sometimes be seen as an affront or threat to teams if they’re used to Ops or InfoSec groups gatekeeping. That is not the goal as it’s intended to be in an advisory capacity. This ends up having a couple benefits. First, it gets teams thinking about and planning for key operational items, and second, it uncovers any major gaps early in the process. The number of times I’ve heard someone ask, “What’s HA?” after reading this list is non-zero. The purpose of this isn’t to shame anyone, just to provide a way to start critical discussions between the team and Developer Enablement groups.

Finally, there’s the “ready-for-production” phase. The team is ready to ship what they’ve been building. This is where things get real. Typically, there are a few things that should happen here. When launching a new service or product, there should be a comprehensive review of the system. The team will sit down with a group of their peers, architects, and security engineers and walk them through the system. People hate the dreaded architecture review, so we call it a product technical walkthrough instead.

Operational Readiness and Change Management

About a month or so prior to the walkthrough, the team should be working through an “operational-readiness checklist” which is used to guide the walkthrough. This checklist is much more detailed than the previous one, enumerating items like what the deploy process consists of, configuration management, API versioning, incident-response procedures, system observability, etc. The checklist we commonly use with clients at Real Kinetic is about seven pages long and covers 10 areas: Deployment, Testing, Reliability/Failover, Architecture, Costs, Security, CI/CD, Infrastructure, Capacity/Performance Estimates, and Operations and Support. This checklist is used to probe different areas. If certain areas feel a little weak, this can lead to deeper discussions depending on the importance or severity. If a system is particularly critical to the business or high-risk, this process can veto a release. Having a sign-off process like this makes some people nervous, but it’s important to point out that this should only apply to new launches. It is not a general change-management process. It’s really about helping teams learn about running systems in production and understanding what that takes.

In addition to the product technical walkthrough, we also recommend doing a security assessment for new services. This usually encompasses a vulnerability and threat assessment, risk assessment, pen testing, the whole nine yards. I usually also like to see some sort of load profiling done on the service before putting it in production (though load and chaos testing should ideally be part of the normal development process, not saved for the very end).

When it comes to infrastructure, there’s also the question of how to manage changes. This is where infrastructure as code (IaC) becomes hugely important as it not only provides a way to automate infrastructure changes, but also a means to review those changes. We can treat infrastructure changes in the same way we treat application changes—storing them in source control, doing code reviews on them, running them through static analysis tools, and so forth. Infrastructure changes, like all changes, should go through a code review process. It cannot be overstated how essential code reviews are and how much they benefit your organization. And once again, this is where Developer Enablement comes into play. I recommend IaC changes be reviewed by a Developer Enablement team member. This provides a touchpoint where they can provide domain expertise and ensure changes are within acceptable parameters. If a developer is requesting a change which falls outside those parameters, such as a database instance with 1TB of RAM for example, it requires a conversation and sign-off process.

Conclusion

With Developer Enablement, what used to be Operations becomes primarily a product and advisory team. “Product” in the sense of providing systems and tools that help developers take on more responsibility, from day-to-day development to operations and support. “Advisory” in the sense of offering domain expertise and guidance. Through this approach, we get better alignment by giving engineers end-to-end ownership from development to on-call and improve efficiency by reducing handoffs. This also lets us scale more effectively. Through products and reduced hand-offs, a Developer Enablement group can empower far more engineers than any conventional Ops team could.

Multi-Cloud Is a Trap

It comes up in a lot of conversations with clients. We want to be cloud-agnostic. We need to avoid vendor lock-in. We want to be able to shift workloads seamlessly between cloud providers. Let me say it again: multi-cloud is a trap. Outside of appeasing a few major retailers who might not be too keen on stuff running in Amazon data centers, I can think of few reasons why multi-cloud should be a priority for organizations of any scale.

A multi-cloud strategy looks great on paper, but it creates unneeded constraints and results in a wild-goose chase. For most, it ends up being a distraction, creating more problems than it solves and costing more money than it’s worth. I’m going to caveat that claim in just a bit because it’s a bold blanket statement, but bear with me. For now, just know that when I say “multi-cloud,” I’m referring to the idea of running the same services across vendors or designing applications in a way that allows them to move between providers effortlessly. I’m not speaking to the notion of leveraging the best parts of each cloud provider or using higher-level, value-added services across vendors.

Multi-cloud rears its head for a number of reasons, but they can largely be grouped into the following points: disaster recovery (DR), vendor lock-in, and pricing. I’m going to speak to each of these and then discuss where multi-cloud actually does come into play.

Disaster Recovery

Multi-cloud gets pushed as a means to implement DR. When discussing DR, it’s important to have a clear understanding of how cloud providers work. Public cloud providers like AWS, GCP, and Azure have a concept of regions and availability zones (n.b. Azure only recently launched availability zones in select regions, which they’ve learned the hard way is a good idea). A region is a collection of data centers within a specific geographic area. An availability zone (AZ) is one or more data centers within a region. Each AZ is isolated with dedicated network connections and power backups, and AZs in a region are connected by low-latency links. AZs might be located in the same building (with independent compute, power, cooling, etc.) or completely separated, potentially by hundreds of miles.

Region-wide outages are highly unusual. When they happen, it’s a high-profile event since it usually means half the Internet is broken. Since AZs themselves are geographically isolated to an extent, a natural disaster taking down an entire region would basically be the equivalent of a meteorite wiping out the state of Virginia. The more common cause of region failures are misconfigurations and other operator mistakes. While rare, they do happen. However, regions are highly isolated, and providers perform maintenance on them in staggered windows to avoid multi-region failures.

That’s not to say a multi-region failure is out of the realm of possibility (any more than a meteorite wiping out half the continental United States or some bizarre cascading failure). Some backbone infrastructure services might span regions, which can lead to larger-scale incidents. But while having a presence in multiple cloud providers is obviously safer than a multi-region strategy within a single provider, there are significant costs to this. DR is an incredibly nuanced topic that I think goes underappreciated, and I think cloud portability does little to minimize those costs in practice. You don’t need to be multi-cloud to have a robust DR strategy—unless, perhaps, you’re operating at Google or Amazon scale. After all, Amazon.com is one of the world’s largest retailers, so if your DR strategy can match theirs, you’re probably in pretty good shape.

Vendor Lock-In

Vendor lock-in and the related fear, uncertainty, and doubt therein is another frequently cited reason for a multi-cloud strategy. Beau hits on this in Stop Wasting Your Beer Money:

The cloud. DevOps. Serverless. These are all movements and markets created to commoditize the common needs. They may not be the perfect solution. And yes, you may end up “locked in.” But I believe that’s a risk worth taking. It’s not as bad as it sounds. Tim O’Reilly has a quote that sums this up:

“Lock-in” comes because others depend on the benefit from your services, not because you’re completely in control.

We are locked-in because we benefit from this service. First off, this means that we’re leveraging the full value from this service. And, as a group of consumers, we have more leverage than we realize. Those providers are going to do what is necessary to continue to provide value that we benefit from. That is what drives their revenue. As O’Reilly points out, the provider actually has less control than you think. They’re going to build the system they believe benefits the largest portion of their market. They will focus on what we, a player in the market, value.

Competition is the other key piece of leverage. As strong as a provider like AWS is, there are plenty of competing cloud providers. And while competitors attempt to provide differentiated solutions to what they view as gaps in the market they also need to meet the basic needs. This is why we see so many common services across these providers. This is all for our benefit. We should take advantage of this leverage being provided to us. And yes, there will still be costs to move from one provider to another but I believe those costs are actually significantly less than the costs of going from on-premise to the cloud in the first place. Once you’re actually on the cloud you gain agility.

The mental gymnastics I see companies go through to avoid vendor lock-in and “reasons” for multi-cloud always astound me. It’s baffling the amount of money companies are willing to spend on things that do not differentiate them in any way whatsoever and, in fact, forces them to divert resources from business-differentiating things.

I think there are a couple reasons for this. First, as Beau points out, we have a tendency to overvalue our own abilities and undervalue our costs. This causes us to miscalculate the build versus buy decision. This is also closely related to the IKEA effect, in which consumers place a disproportionately high value on products they partially created. Second, as the power and influence in organizations has shifted from IT to the business—and especially with the adoption of product mindset—it strikes me as another attempt by IT operations to retain control and relevance.

Being cloud-agnostic should not be an important enough goal that it drives key decisions. If that’s your starting point, you’re severely limiting your ability to fully reap the benefits of cloud. You’re just renting compute. Platforms like Pivotal Cloud Foundry and Red Hat OpenShift tout the ability to run on every major private and public cloud, but doing so—by definition—necessitates an abstraction layer that abstracts away all the differentiating features of each cloud platform. When you abstract away the differentiating features to avoid lock-in, you also abstract away the value. You end up with vendor “lock-out,” which basically means you aren’t leveraging the full value of services. Either the abstraction reduces things to a common interface or it doesn’t. If it does, it’s unclear how it can leverage differentiated provider features and remain cloud-agnostic. If it doesn’t, it’s unclear what the value of it is or how it can be truly multi-cloud.

Not to pick on PCF or Red Hat too much, but as the major cloud providers continue to unbundle their own platforms and rebundle them in a more democratized way, the value proposition of these multi-cloud platforms begins to diminish. In the pre-Kubernetes and containers era—aka the heyday of Platform as a Service (PaaS)—there was a compelling story. Now, with the prevalence of containers, Kubernetes, and especially things like Google’s GKE and GKE On-Prem (and equivalents in other providers), that story is getting harder to tell. Interestingly, the recently announced Knative was built in close partnership with, among others, both Pivotal and Red Hat, which seems to be a play to capture some of the value from enterprise adoption of serverless computing using the momentum of Kubernetes.

But someone needs to run these multi-cloud platforms as a service, and therein lies the rub. That responsibility is usually dumped on an operations or shared-services team who now needs to run it in multiple clouds—and probably subscribe to a services contract with the vendor.

A multi-cloud deployment requires expertise for multiple cloud platforms. A PaaS might abstract that away from developers, but it’s pushed down onto operations staff. And we’re not even getting in to the security and compliance implications of certifying multiple platforms. For some companies who are just now looking to move to the cloud, this will seriously derail things. Once we get past the airy-fairy marketing speak, we really get into the hairy details of what it means to be multi-cloud.

There’s just less room today for running a PaaS that is not managed for you. It’s simply not strategic to any business. I also like to point out that revenues for companies like Pivotal and Red Hat are largely driven by services. These platforms act as a way to drive professional services revenue.

Generally speaking, the risk posed to businesses by vendor lock-in of non-strategic systems is low. For example, a database stores data. Whether it’s Amazon DynamoDB, Google Cloud Datastore, or Azure Cosmos DB—there might be technical differences like NoSQL, relational, ANSI-compliant SQL, proprietary, and so on—fundamentally, they just put data in and get data out. There may be engineering effort involved in moving between them, but it’s not insurmountable and that cost is often far outweighed by the benefits we get using them. Where vendor lock-in can become a problem is when relying on core strategic systems. These might be systems which perform actual business logic or are otherwise key enablers of a company’s business. As Joel Spolsky says, “If it’s a core business function—do it yourself, no matter what. Pick your core business competencies and goals, and do those in house.”

Pricing

Price competitiveness might be the weakest argument of all for multi-cloud. The reality is, as they commoditize more and more, all providers are in a race to the bottom when it comes to cost. Between providers, you will end up spending more in some areas and less in others. Multi-cloud price arbitrage is not a thing, it’s just something people pretend is a thing. For one, it’s wildly impractical. For another, it fails to account for volume discounts. As I mentioned in my comparison of AWS and GCP, it really comes down more to where you want to invest your resources when picking a cloud provider due to their differing philosophies.

And to Beau’s point earlier, the lock-in angle on pricing, i.e. a vendor locking you in and then driving up prices, just doesn’t make sense. First, that’s not how economies of scale work. And once you’re in the cloud, the cost of moving from one provider to another is dramatically less than when you were on-premise, so this simply would not be in providers’ best interest. They will do what’s necessary to capture the largest portion of the market and competitive forces will drive Infrastructure as a Service (IaaS) costs down. Because of the competitive environment and desire to capture market share, pricing is likely to converge.  For cloud providers to increase margins, they will need to move further up the stack toward Software as a Service (SaaS) and value-added services.

Additionally, most public cloud providers offer volume discounts. For instance, AWS offers Reserved Instances with significant discounts up to 75% for EC2. Other AWS services also have volume discounts, and Amazon uses consolidated billing to combine usage from all the accounts in an organization to give you a lower overall price when possible. GCP offers sustained use discounts, which are automatic discounts that get applied when running GCE instances for a significant portion of the billing month. They also implement what they call inferred instances, which is bin-packing partial instance usage into a single instance to prevent you from losing your discount if you replace instances. Finally, GCP likewise has an equivalent to Amazon’s Reserved Instances called committed use discounts. If resources are spread across multiple cloud providers, it becomes more difficult to qualify for many of these discounts.

Where Multi-Cloud Makes Sense

I said I would caveat my claim and here it is. Yes, multi-cloud can be—and usually is—a distraction for most organizations. If you are a company that is just now starting to look at cloud, it will serve no purpose but to divert you from what’s really important. It will slow things down and plant seeds of FUD.

Some companies try to do build-outs on multiple providers at the same time in an attempt to hedge the risk of going all in on one. I think this is counterproductive and actually increases the risk of an unsuccessful outcome. For smaller shops, pick a provider and focus efforts on productionizing it. Leverage managed services where you can, and don’t use multi-cloud as a reason not to. For larger companies, it’s not unreasonable to have build-outs on multiple providers, but it should be done through controlled experimentation. And that’s one of the benefits of cloud, we can make limited investments and experiment without big up-front expenditures—watch out for that with the multi-cloud PaaS offerings and service contracts.

But no, that doesn’t mean multi-cloud doesn’t have a place. Things are never that cut and dry. For large enterprises with multiple business units, multi-cloud is an inevitability. This can be a result of product teams at varying levels of maturity, corporate IT infrastructure, and certainly through mergers and acquisitions. The main value of multi-cloud, and I think one of the few arguments for it, is leveraging the strengths of each cloud where they make sense. This gets back to providers moving up the stack. As they attempt to differentiate with value-added services, multi-cloud starts to become a lot more meaningful. Secondarily, there might be a case for multi-cloud due to data-sovereignty reasons, but I think this is becoming less and less of a concern with the prevalence of regions and availability zones. However, some services, such as Google’s Cloud Spanner, might forgo AZ-granularity due to being “globally available” services, so this is something to be aware of when dealing with regulations like GDPR. Finally, for enterprises with colocation facilities, hybrid cloud will always be a reality, though this gets complicated when extending those out to multiple cloud providers.

If you’re just beginning to dip your toe into cloud, a multi-cloud strategy should not be at the forefront of your mind. It definitely should not be your guiding objective and something that drives core decisions or strategic items for the business. It has a time and place, but outside of that, it’s just a fool’s errand—a distraction from what’s truly important.

The Observability Pipeline

The rise of cloud and containers has led to systems that are much more distributed and dynamic in nature. Highly elastic microservice and serverless architectures mean containers spin up on demand and scale to zero when that demand goes away. In this world, servers are very much cattle, not pets. This shift has exposed deficiencies in some of the tools and practices we used in the world of servers-as-pets. It has also led to new tools and services created to help us support our systems.

Many of the clients we work with at Real Kinetic are trying to navigate their way through this transformation and struggle to figure out where to begin with these solutions. Beau Lyddon, one of our partners, recently gave a talk on exactly this called What is Happening: Attempting to Understand Our Systems (as an aside, Honeycomb’s Charity Majors live-blogged the talk which is worth a read). In this post, I’m going to attempt to summarize some of the key ideas from Beau’s talk and introduce the concept of an observability pipeline, which we think is an essential component in today’s cloud-native, product-oriented world.

Observability Explosion

With traditional static deployments and monolithic architectures, monitoring is not too challenging (that’s not to say it’s easy, but, in relative terms, it’s uncomplicated). This is where tools like Nagios became very popular. When we have only a handful of servers and/or a single, monolithic application, it’s relatively straightforward to determine the health of the system and to correlate system behavior to actual customer or business impact. It’s also feasible to “see inside the box” and get meaningful code-level instrumentation. Once again, tools like AppDynamics and Dynatrace became popular here.

With cloud-native and container-based systems, instances tend to be highly elastic and ephemeral, and what used to comprise a single, monolithic application might now consist of dozens of different microservices and even different instances running different versions of the same service. Simply put, systems are more distributed, more dynamic, and more complex now than ever before—and users have even more expectations. This means many of the tools that were well-suited before might not be adequate now.

For example, the ability to “see inside the box” with intra-process, code-level tracing becomes largely impractical in a highly dynamic cloud environment. By the time you are debugging an issue, the container is gone. This is only exacerbated by the serverless or functions as a service (FaaS) movement. Similarly, it’s much more difficult to correlate the behavior of a single service to the user’s experience since partial failure becomes more of an everyday thing. Thus, many of these tools end up being better suited to static infrastructures where there is a small set of long-lived VMs with a limited number of services. That’s where most of them originated from anyway. Instead, service-level distributed tracing becomes a key part of microservice observability, as does structured logging. With this shift in how we build systems, there has been an explosion in new terms, new tools, and new services.

Of course, in addition to tools, there are also the cultural aspects of monitoring and incident response. Many companies traditionally rely on an operations team to monitor, triage, and—in some cases—even resolve issues. This model quickly becomes untenable as the number of services increases. A single operations team will not be able to maintain enough context for a non-trivial amount of services and systems to do this effectively. This model also leads to ineffective feedback loops if engineers are not on-call and responsible for the operation of their services—something I’ve talked about ad nauseum. My advice is to push ownership of systems onto the teams who built them. This includes on-call duty and general operational responsibilities. However, in order for development teams to take on this responsibility, they need to be empowered to act on it. With this model, which I’ve come to facetiously call NewOps, the operations team becomes responsible for providing the tools and data teams need to adequately operate their services. Some organizations take this even further with dedicated observability teams.

Observability” is a term that has emerged recently within the industry as a more nuanced take on traditional monitoring. While monitoring tends to focus more on the overall health of systems and business metrics, observability aims to provide more granular insights into the behavior of systems along with rich context useful for debugging and business purposes. Put another way, monitoring is about known-unknowns and actionable alerts; observability is about unknown-unknowns and empowering teams to interrogate their systems.

In a sense, observability encompasses all of the telemetry needed to gain insight into the behavior and state of a running system. This includes items like application logs, system logs, audit logs, application metrics, and distributed-tracing data. These are all valuable signals for diagnosing and debugging production issues, especially in a microservice environment where containers are largely ephemeral. In this environment, it is no longer practical to SSH into a machine to debug a problem or tail a log file. Distributed tracing becomes particularly important since a single application transaction may invoke multiple service functions.

Observability Pipeline

It’s important that you can really own your data and prevent it from being locked up inside a single vendor’s solution. Likewise, it’s important that data can be made available to the entire enterprise (or, in some cases, made not available to the entire enterprise). Since the number of tools and products can be quite large, tool and data needs vary from team to team, and the overall amount of data can be overwhelming, I suggest a decoupled approach. By building an observability pipeline, we can decouple the collection of this data from the ingestion of it into a variety of systems.

To illustrate, if we have log data going to Splunk, metrics and traces going to Datadog, client events going to Google Analytics and BigQuery, and everything going to Amazon Glacier for cold storage, the number of integrations quickly becomes large and grows for every additional service we add. It also probably means we are running an agent for many of these services on each host, and if any of these services are unavailable or behind, our application either blocks or we lose critical observability data. With the amount of data we end up collecting, it’s not uncommon to spend more time collecting it than actually performing business logic unless we find a way to efficiently get it out of the critical path.

Finally, as vendors in this space converge on features (which they are), differentiating capabilities are released (which they will need), or licensing/pricing issues arise (which they do), it’s likely that the business will need to add or remove SaaS solutions over time. If these are tightly integrated, this can be difficult to do. An observability pipeline, as we will later see, allows us to evaluate multiple solutions simultaneously or replace solutions transparently to applications and infrastructure. For example, perhaps we need to switch from Splunk to Sumo Logic or Datadog to New Relic or evaluate Honeycomb in addition to New Relic. How big of a lift would this be for your organization today? How easy is it to experiment with a new tool or service?

With an observability pipeline, we decouple the data sources from the destinations and provide a buffer. This makes the observability data easily consumable. We no longer have to figure out what data to send from containers, VMs, and infrastructure, where to send it, and how to send it. Rather, all the data is sent to the pipeline, which handles filtering it and getting it to the right places. This also gives us greater flexibility in terms of adding or removing data sinks, and it provides a buffer between data producers and consumers.

There are a few components to this pipeline which I will cover below. Many of the components can be implemented with existing open source tools or off-the-shelf services, so those I will touch on only briefly. Other parts require more involvement and some up-front thinking, so I’ll speak to them in more detail.

Data Specifications

Structured logging is hugely important to aiding debuggability. Anyone who’s shipped production code has been in the situation where they’re frantically trying to regex logs to pull out the information they need to debug a problem. It’s even worse when we’re debugging a request going through a series of microservices with haphazard logging. But structured logging isn’t just about creating better logs, it’s about creating a data pipeline that can feed the many tools you’ll need to leverage to understand, debug, and optimize complex systems, meet security and compliance requirements, and provide critical business intelligence.

In order to monitor systems, debug problems, make decisions, or automate processes, we need data. And we need the systems to give us data to provide necessary context. Aside from structured logging, one piece of advice we give every client is to pass a context object to basically everything. This context includes all of the important metadata flowing through a system—usually IDs that allow you to correlate events and piece together a story of what’s happening inside your system: user ID, account ID, trace ID, request ID, parent ID, and so on. What we want to avoid is the sort of murder-mystery debugging that often happens. A lone error log is the equivalent of finding a body. We know a crime occurred, but how do we piece together the clues to tell the right story? Observability—that is, being able to ask questions of your systems and truly explore them—requires access to pre-aggregate, raw data and support for high-cardinality dimensions.

The way to decide what goes on the context is to think about the data you wish you had while debugging an issue (this also highlights the importance of developers supporting their own systems). What is the data that would change the behavior of the system? Some examples include the user (or company), their license, time, machine stats (e.g. CPU and memory), software version, configuration data, the incoming request, downstream requests, etc. Of these, what can we get for “free” and what do we need to pass along? “Free” in this case would be things which are machine-provided, such as memory and CPU. The data we can’t get for free should go on the context, typically data that is request-specific. This context should be included on every log message.

This brings us back to the importance of structuring your data. To do this, I encourage creating standard specifications for each data type collected—logs, metrics, traces, events, etc. You can take this as far as you’d like—highly structured with a type system and rigid specification—but at a minimum, get logs into a standard format with property tags. JSON is fine for the actual structure, but be sure to version the spec so that it can evolve. For application events, one pattern that can work well is to create an inheritance structure with a base spec that applies across services (e.g. user context and tracing information are the same) and specialized specs that can be defined by services if needed. Just be careful not to leak sensitive data here—this is one area where code reviews are vital.

Specification Libraries

A key part of empowering developers is providing tools that align the “easy” path with the “right” path. If these aren’t aligned, pain-driven development creates problems. In order for developers to take advantage of structured data, specifications aren’t enough. We need libraries which implement the specs and make it easy for engineers to actually instrument their systems. For logging, there are many existing libraries. Just Google “structured logs” and your language of choice. For tracing and metrics, there are APIs like OpenTracing and OpenCensus. In practice, implementing the spec might be a combination of libraries and transformations made by the data collector described below.

Data Collector

This component is responsible for collecting data from hosts, containers, or other sources and writing it to the data pipeline. It may also perform transformations or filtering of data. A couple popular open source solutions for this are Fluentd and Logstash. Typically this runs as a sidecar or agent on the host, and data is written to stdout/stderr or a Unix domain socket, which it then pushes to the pipeline.

Data Pipeline

This component is a highly scalable data stream which can handle the firehose of observability data being generated and has high availability. This also provides a buffer for the data and decouples producers from consumers. Off-the-shelf solutions include Apache Kafka, Google Cloud Pub/Sub, Amazon Kinesis Data Streams, and Liftbridge.

Data Router

This component consumes data from the pipeline, performs filtering, and writes it to the appropriate backends. It may perform some transformations and processing of the data as well, but generally any heavy processing should be the responsibility of a backend system (e.g. alerting or aggregations). This is where the data specifications come into play. The data type will determine how routers handle incoming data, e.g. routing log data to Splunk and cold storage, routing traces to Google Stackdriver, and routing metrics and APM data to New Relic.

Like the specifications and libraries, this is a component that requires some more involvement. The downside of moving away from agent-based data collection is we now have to handle routing that data ourselves. The upside is most vendors provide good APIs and client libraries which make this easier.

Since this is typically a stateless service, it’s a good fit for “serverless” solutions like Google Cloud Functions or AWS Lambda.

Piecing It All Together

Putting all of these pieces together, the observability pipeline looks something like the following:

One caveat I want to point out is that this is not something you need to build out from day one. At most of the companies where we’ve implemented this, it was something that evolved over time. For instance, with some of the clients we work with who are attempting to move to the cloud and adopt DevOps practices, we typically would not advise making a significant upfront investment to architect this pipeline. This is an ideal goal to work towards that will become increasingly important as the amount of services, traffic, and data scales. Instead, architect your systems from the beginning to be able to adopt this approach more easily—use structured logging, keep collection out-of-process, and use a centralized logging system.

For organizations that are heavily siloed, this approach can help empower teams when it comes to operating their software. Unlocking this data can also be a huge win for the business. It provides a layer of abstraction that allows you to get the data everywhere it needs to be without impacting developers and the core system. Lastly, it allows you to change backing data systems easily or test multiple in parallel. With the amount of data and the number of tools modern systems demand these days, the observability pipeline becomes just as essential to the operations of a service as the CI/CD pipeline.