In part one of this series, I described the difference between monitoring and observability and why the latter starts to become more important when dealing with microservices. Next, we’ll discuss some strategies and patterns for implementing better observability. Specifically, we’ll look at the idea of an observability pipeline and how we can start to iteratively improve observability in our systems.
To recap, observability can be described simply as the ability to ask questions of your systems without knowing those questions in advance. This requires capturing a variety of signals such as logs, metrics, and traces as well as tools for interpreting those signals like log analysis, SIEM, data warehouses, and time-series databases. A number of challenges surface as a result of this. Clint Sharp does a great job discussing the key problems, which I’ll summarize below along with some of my own observations.
Problem 1: Agent Fatigue
A typical microservice-based system requires a lot of different operational tooling—log and metric collectors, uptime monitoring, analytics aggregators, security scanners, APM runtime instrumentation, and so on. Most of these involve agents that run on every node in the cluster (or, in some cases, every pod in Kubernetes). Since vendors optimize for day-one experience and differentiating capabilities, they are incentivized to provide agents unique to their products rather than attempting to unify or standardize on tooling. This causes problems for ops teams who are concerned with the day-two costs of running and managing all of these different agents. Resource consumption alone can be significant, especially if you add in a service mesh like Istio into the mix. Additionally, since each agent is unique, the way they are configured and managed is different. Finally, from a security perspective, every agent added to a system introduces additional attack surface to hosts in the cluster. Each agent brings not just the vendor’s code into production but also all of its dependencies.
Problem 2: Capacity Anxiety
With the elastic microservice architectures I described in part one, capacity planning for things like logs and metrics starts to become a challenge. This point is particularly salient if, for example, you’ve ever been responsible for managing Splunk licensing. With microservices, a new deployment can now cause a spike in log volumes forcing back pressure on your log ingestion across all of your services. I’ve seen Splunk ingestion get backed up for days’ worth of logs, making it nearly impossible to debug production issues when logs are needed most. I’ve seen Datadog metric ingestion grind to a halt after someone added a high-cardinality dimension to classify a metric by user. And I’ve seen security teams turn on cloud audit log exporting to their SIEM only to get flooded with low-level minutiae and noise. Most tools prioritize gross data ingestion over fine-grained control like sampling, filtering, deduplicating, and aggregating. Using collectors such as Fluentd can help with this problem but add to the first problem. Elastic microservice architectures tend to require more control over data ingestion to avoid capacity issues.
Problem 3: Foresight Required
Unlike monitoring, observability is about asking questions that we hadn’t planned to ask in advance, but we can’t ask those questions if the necessary data was never collected in the first place! The capacity problem described above might cause us to under-instrument our systems, especially when the value of logs is effectively zero—until it’s not. Between monitoring, debugging, security forensics, and other activities, effective operations requires a lot of foresight. Unfortunately, this foresight tends to come from hindsight, which might be too late depending on the situation. Most dashboards are operational scar tissue, after all. Adding or reconfiguring instrumentation after the fact can have significant lag time, which can be the difference between prolonged downtime or a speedy remediation. Elastic microservice architectures benefit greatly from the ability to selectively and dynamically dial up the granularity of operational data when it’s needed and dial it back down when it’s not.
Problem 4: Tooling and Data Accessibility
Because of the problems discussed earlier, it’s not uncommon for organizations to settle on a limited set of operations tools like logging and analytics systems. This can pose its own set of challenges, however, as valuable operational data becomes locked up within certain systems in production environments. Vendor lock-in and high switching costs can make it difficult to use the right tool for the job.
There’s a wide range of data sources that provide high-value signals such as VMs, containers, load balancers, service meshes, audit logs, VPC flow logs, and firewall logs. And there’s a wide range of sinks and downstream consumers that can benefit from these different signals. The problem is that tool and data needs vary from team to team. Different tools or products are needed for different data and different use cases. The data that operations teams care about is different from the data that business analysts, security, or product managers care about. But if the data is siloed based on form or function or the right tools aren’t available, it becomes harder for these different groups to be effective. There’s an ever-changing landscape of tools, products, and services—particularly in the operations space—so the question is: how big of a lift is it for your organization to add or change tools? How easy is it to experiment with new ones? In addition to the data siloing, the “agent fatigue” problem described above can make this challenging when re-rolling host agents at scale.
Solution: The Observability Pipeline
Solving these problems requires a solution that offers the following characteristics:
- Allows capturing arbitrarily wide events
- Consolidates data collection and instrumentation
- Decouples data sources from data sinks
- Supports input-to-output schema normalization
- Provides a mechanism to encode routing, filtering, and transformation logic
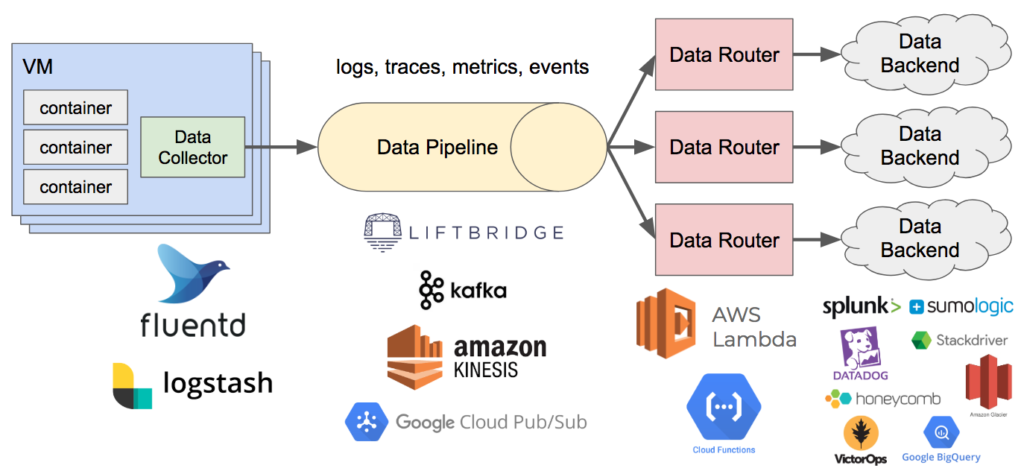
When we implement these different concepts, we get an observability pipeline—a way to unify the collection of operational data, shape it, enrich it, eliminate noise, and route it to any tool in the organization that can benefit from it. With input-to-output schema normalization, we can perform schema-agnostic processing to enrich, filter, aggregate, sample, or drop fields from any shape and adapt data for different destinations. This helps to support a wider range of data collectors and agents. And by decoupling sources and sinks, we can easily introduce or change tools and reroute data without impacting production systems.
We’re starting to see the commercialization of this idea with products like Cribl, but there are ways to solve some of these problems yourself, incrementally, and without the use of commercial software. The remainder of this post will discuss patterns and strategies for building your own observability pipeline. While the details here will be fairly high level, part three of this series will share some implementation details and tactics through examples.
Pattern 1: Structured Data
A key part of improving system observability is being more purposeful in how we structure our data. Specifically, structured logging is critical to supporting production systems and aiding debuggability. The last thing you want to be doing when debugging a production issue is frantically grepping log files trying to pull out needles from a haystack. In the past, logs were primarily consumed by human operators. Today, they are primarily consumed by tools. That requires some adjustments at design time. For example, if we were designing a login system, historically, we might have a logging statement that resembles the following:
log.error(“User '{}' login failed”.format(user))
This would result in a log message like:
ERROR 2019-12-30 09:28.31 User ‘tylertreat' login failed
When debugging login problems, we’d probably use a combination of grep and regular expressions to track down the users experiencing issues. This might be okay for the time being, but as we introduce additional metadata, it becomes more and more kludgy. It also means our logs are extremely fragile. People begin to rely on the format of logs in ways that might even be unknown to the developers responsible for them. Unstructured logs become an implicit, undocumented API.
With structured logs, we make that contract more explicit. Our logging statement might change to something more like:
log.error(“User login failed”,
          event=LOGIN_ERROR,
          user=“tylertreat”,
          email=“tyler.treat@realkinetic.com”,
          error=error)
The actual format we use isn’t hugely important. I typically recommend JSON because it’s ubiquitous and easy to write and parse. With JSON, our log looks something like the following:
{
    “timestamp”: “2019-12-30 09:28.31”,
    “level”: “ERROR”,
    “event”: “user_login_error”,
    “user”: “tylertreat”,
    “email”: “tyler.treat@realkinetic.com”,
    “error”: “Invalid username or password”,
    “message”: “User login failed”
}
With this, we can parse the structure, index it, query it, even transform or redact it, and we can add new pieces of metadata without breaking consumers. Our logs start to look more like events. Remember, observability is about being able to ask arbitrary questions of our systems. Events are like logs with context, and shifting towards this model helps with being able to ask questions of our systems.
Pattern 2: Request Context and Tracing
With elastic microservice architectures, correlating events and metadata between services becomes essential. Distributed tracing is one component of this. Another is tying our structured logs together and passing shared context between services as a request traverses the system. A pattern that I recommend to teams adopting microservices is to pass a context object to everything. This is actually a pattern that originated in Go for passing request-scoped values, cancelation signals, and deadlines across API boundaries. It turns out, this is also a useful pattern for observability when extended to service boundaries. While it’s contentious to explicitly pass context objects due to the obtrusiveness to APIs, I find it better than relying on implicit, request-local storage.
In its most basic form, a context object is simply a key-value bag that lets us track metadata as a request passes through a service and is persisted through the entire execution path. OpenTracing refers to this as baggage. You can include this context as part of your structured logs. Some suggest having a single event/structured-log-with-context emitted per hop, but I think this is more aspirational. For most, it’s probably easier to get started by adding a context object to your existing logging. Our login system’s logging from above would look something like this:
def login(ctx, username, email, password):
    ctx.set(user=username, email=email)
    ...
    log.error(“User login failed”,
              event=LOGIN_ERROR,
              context=ctx,
              error=error)
    ...
This adds rich metadata to our logs—great for debugging—as they start evolving towards events. The context is also a convenient way to propagate tracing information, such as a span ID, between services.
{
    “timestamp”: “2019-12-30 09:28.31”,
    “level”: “ERROR”,
    “event”: “user_login_error”,
    “context”: {
        “id”: “accfbb8315c44a52ad893ca6772e1caf”,
        “http_method”: “POST”,
        “http_path”: “/login”,
        “user”: “tylertreat”,
        “email”: “tyler.treat@realkinetic.com”,
        “span_id”: “34fe6cbf9556424092fb230eab6f4ea6”,
    },
    “error”: “Invalid username or password”,
    “message”: “User login failed”
}
You might be wondering what to put on the context versus just putting on our structured logs. It’s a good question and, like most things, the answer is “it depends.” A good rule of thumb is what can you get for “free” and what do you need to pass along? These should typically be things specific to a particular request. For instance, CPU utilization and memory usage can be pulled from the environment, but a user or correlation ID are request-specific and must be propagated. This decision starts to become more obvious the deeper your microservice architectures get. Just be careful not to leak sensitive data into your logs! While we can introduce tooling into our observability pipeline to help with this risk, I believe code reviews are the best line of defense here.
Pattern 3: Data Schema
With our structured data and context, we can take it a step further and introduce schemas for each data type we collect, such as logs, metrics, and traces. Schemas provide a standard shape to the data and allow consumers to rely on certain fields and types. They might validate data types and enforce required fields like a user ID, license, or trace ID. These schemas basically take the explicit contract described above and codify it into a specification. This is definitely the most organization-dependent pattern, so it’s hard to provide specific advice. The key thing is having structured data that can be easily evolved and relied on for debugging or exploratory purposes.
These schemas also need libraries which implement the specifications and make it easy for developers to actually instrument their systems. There is a plethora of existing libraries available for structured logging. For tracing and metrics, OpenTelemetry has emerged as a vendor-neutral API and forthcoming data specification.
Pattern 4: Data Collector
So far, we’ve talked mostly about development practices that improve observability. While they don’t directly address the problems described above, later, we’ll see how they also help support other parts of the observability pipeline. Now we’re going to look at some actual infrastructure patterns for building out a pipeline.
Recall that two of the characteristics we desire in our observability solution are the ability to consolidate data collection and instrumentation and decouple data sources from data sinks. One of the ways we can reduce agent fatigue is by using a data collector to unify the collection of key pieces of observability data—namely logs (or events), metrics, and traces. This component collects the data, optionally performs some transformations or filtering on it, and writes it to a data pipeline. This commonly runs as an agent on the host. In Kubernetes, this might be a DaemonSet with an instance running on each node. From the application or container side, data is written to stdout/stderr or a Unix domain socket which the collector reads. From here, the data gets written to the pipeline, which we’ll look at next.
Moving data collection out of process can be important if your application emits a significant amount of logs or you’re doing anything at a large enough scale. I’ve seen cases where applications were spending more time writing logs than performing actual business logic. Writing logs to disk can easily take down a database or other I/O-intensive workload just by sharing a filesystem with its logging. Rather than sacrificing observability by reducing the volume and granularity of logs, offload it and move it out of the critical execution path. Logging can absolutely affect the performance and reliability of your application.
For this piece, I generally recommend using either Fluentd or Logstash along with the Beats ecosystem. I usually avoid putting too much logic into the data collector due to the way it runs distributed and at scale. If you put a lot of processing logic here, it can become difficult to manage and evolve. I find it works better to have the collector act as a dumb pipe for getting data into the system where it can be processed offline.
Pattern 5: Data Pipeline
Now that we have an agent running on each host collecting our structured data, we need a scalable, fault-tolerant data stream to handle it all. Even at modestly sized organizations, I’ve seen upwards of about 1TB of logs indexed daily with elastic microservice architectures. This volume can be much greater for larger organizations, and it can burst dramatically with the introduction of new services. As a result, decoupling sources and sinks becomes important for reducing capacity anxiety. This data pipeline is often something that can be partitioned for horizontal scalability. In doing this, we might just end up shifting the capacity anxiety from one system to another, but depending on the solution, this can be an easier problem to solve or might not be a problem at all if using a managed cloud service. Finally, a key reason for decoupling is that it also allows us to introduce or change sinks without impacting our production cluster. A benefit of this is that we can also evaluate and compare tools side-by-side. This helps reduce switching costs.
There are quite a few available solutions for this component, both open source and managed. On the open source side, examples include Apache Kafka, Apache Pulsar, and Liftbridge. On the cloud-managed services side, Amazon Kinesis, Google Cloud Pub/Sub, and Azure Event Hubs come to mind. I tend to prefer managed solutions since they allow me to focus on things that directly deliver business value rather than surrounding operational concerns.
Note that there are some important nuances depending on the pipeline implementation you use or which might determine the implementation you choose. For example, questions like how long do you need to retain observability data, do you need the ability to replay data streams, and do you need strict, in-order delivery of messages? Replaying operational data can be useful for retraining ML models or testing monitoring changes, for instance. For systems that are explicitly sharded, there’s also the question of how to partition the data. Random partitioning is usually easiest from a scaling and operations perspective, but it largely depends on how you intend to consume it.
Pattern 6: Data Router
The last pattern and component of our observability pipeline is the data router. With our operational data being written to a pipeline such as Kafka, we need something that can consume it, perform processing, and write it to various backend systems. This is also a great place to perform dynamic sampling, filtering, deduplication, aggregation, or data enrichment. The schema mentioned earlier becomes important here since the shape of the data determines how it gets handled. If you’re dealing with data from multiple sources, you’ll likely need to normalize to some common schema, either at ingestion time or processing time, in order to execute shared logic and perform schema-agnostic processing. Data may also need to be reshaped before writing to destination systems.
This piece can be as sophisticated or naive as you’d like, depending on your needs or your organization’s observability and operations maturity. A simple example is merely looking at the record type and sending logs to Splunk and Amazon Glacier cold storage, sending traces to Stackdriver, sending metrics to Datadog, and sending high-cardinality events to Honeycomb. More advanced use cases might involve dynamic sampling to dial up or down the granularity on demand, dropping values to reduce storage consumption or eliminate noise, masking values to implement data loss prevention, or joining data sources to create richer analytics.
Ultimately, this is a glue component that’s reading data in, parsing the shape of it, and writing it out to assorted APIs or other topics/streams for further downstream processing. Depending on the statefulness of your router logic, this can be a good fit for serverless solutions like AWS Lambda, Google Cloud Functions, Google Cloud Run, Azure Functions, or OpenFaaS. If using Kafka, Kafka Streams might be a good fit.
The Journey to Better Observability
Observability with elastic microservice architectures introduces some unique challenges like agent fatigue, capacity anxiety, required foresight, and tooling and data accessibility. Solving these problems requires a solution that can capture arbitrarily wide events, consolidate data collection and instrumentation, decouple data sources and sinks, support input-to-output schema normalization, and encode routing, filtering, and transformation logic. When we implement this, we get an observability pipeline, which is really just a fancy name for a collection of observability patterns and best practices.
An observability pipeline should be an evolutionary or iterative process. You shouldn’t waste time building out a sophisticated pipeline early on; you should be focused on delivering value to your customers. Instead, start small with items that add immediate value to the observability of your systems.
Something you can begin doing today that adds a ton of value with minimal lift is structured logging. Another high-leverage pattern is passing a context object throughout your service calls to propagate request metadata which can be logged and correlated. Use distributed tracing to understand and identify issues with performance. Next, move log collection out of process using Fluentd or Logstash. If you’re not already, use a centralized logging system—Splunk, Elasticsearch, Sumo Logic, Graylog—there are a bunch of options here, both open source and commercial, SaaS or self-managed. With the out-of-process collector, you can then introduce a data pipeline to decouple log producers from consumers. Again, there are managed options like Amazon Kinesis or Google Cloud Pub/Sub and self-managed ones like Apache Kafka. With this, you can now add, change, or compare consumers and log sinks without impacting production systems. Evaluate a product like Honeycomb for storing high-cardinality events. At this point, you can start to unify the collection of other instrumentation such as metrics and traces and evolve your logs towards context-rich events.
Each of these things will incrementally improve the observability of your systems and can largely be done in a stepwise fashion. Whether you’re just beginning your transition to microservices or have fully adopted them, the journey to better observability doesn’t have to require a herculean effort. Rather, it’s done one step at a time.
In part three of this series, I’ll demonstrate a few implementation details through examples to show some of these observability patterns in practice.
Follow @tyler_treat
3 Replies to “Microservice Observability, Part 2: Evolutionary Patterns for Solving Observability Problems”